| Param | Original file | Final file |
|---|---|---|
| Filename | modeM0/AS1A12_052T04_9000005582_40955cztM0_level2.fits | modeM0/AS1A12_052T04_9000005582_40955cztM0_level2_quad_clean.evt |
| Size (bytes) | 276,949,440 | 83,563,200 |
| Size | 264.1 MB | 79.7 MB |
| Events in quadrant A | 2,643,149 | 572,402 |
| Events in quadrant B | 2,112,478 | 580,930 |
| Events in quadrant C | 2,402,958 | 539,258 |
| Events in quadrant D | 2,711,190 | 494,310 |
| Mode M9 | |||
|---|---|---|---|
| Quadrant | BADHDUFLAG | Total packets | Discarded packets |
| A | 0 | 32 | 0 |
| B | 0 | 32 | 0 |
| C | 0 | 32 | 0 |
| D | 0 | 33 | 0 |
| Mode SS | |||
|---|---|---|---|
| Quadrant | BADHDUFLAG | Total packets | Discarded packets |
| A | 0 | 102 | 0 |
| B | 0 | 102 | 0 |
| C | 0 | 102 | 0 |
| D | 0 | 102 | 0 |
| Mode M0 | |||
|---|---|---|---|
| Quadrant | BADHDUFLAG | Total packets | Discarded packets |
| A | 0 | 10844 | 3 |
| B | 0 | 9797 | 2 |
| C | 0 | 10226 | 2 |
| D | 0 | 11594 | 2 |
| Quadrant | Total seconds | Saturated seconds | Saturation percentage |
|---|---|---|---|
| A | 4893 | 13 | 0.265686% |
| B | 4893 | 5 | 0.102187% |
| C | 4893 | 40 | 0.817494% |
| D | 4893 | 147 | 3.004292% |
Noise dominated data is calculated using 1-second bins in cleaned event files. If a bin has >2000 counts, and if more than 50% of those come from <1% of pixels, then it is considered to be noise-dominated and hence unusable.
| Quadrant | # 1 sec bins | Bins with >0 counts | Bins with >2000 counts | High rate bins dominated by noise | Noise dominated (total time) | Noise dominated (detector-on time) | Marked lightcurve |
|---|---|---|---|---|---|---|---|
| A | 6985 | 4894 | 5 | 5 | 0.07% | 0.10% | 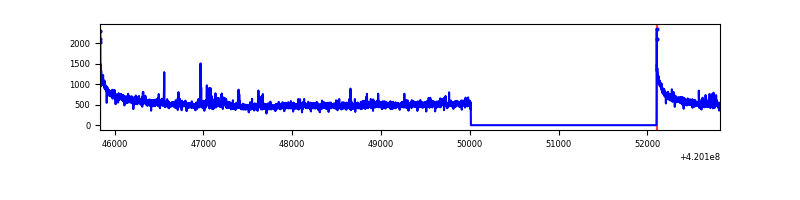 |
| B | 6985 | 4894 | 0 | 0 | 0.00% | 0.00% | 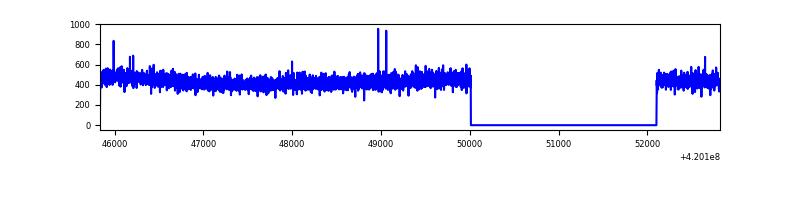 |
| C | 6985 | 4894 | 31 | 31 | 0.44% | 0.63% | 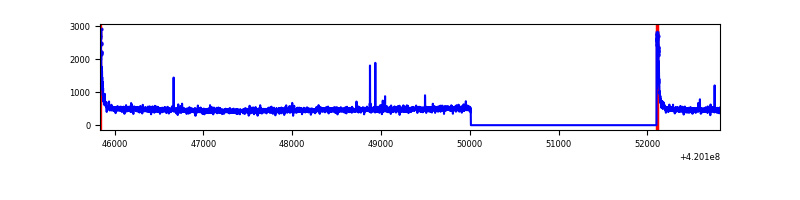 |
| D | 6985 | 4894 | 132 | 132 | 1.89% | 2.70% | 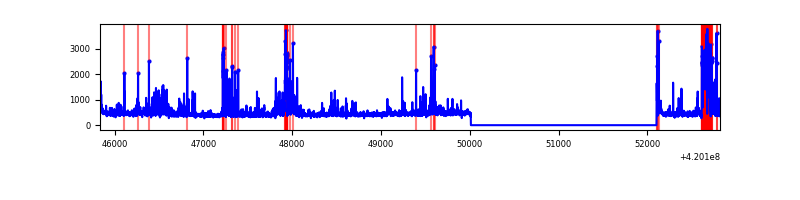 |
Top three noisy pixels from each quadrant. If the there are fewer than three noisy pixels in the level2.evt file, extra rows are filled as -1
| Pixel properties | Quadrant properties | ||||||
|---|---|---|---|---|---|---|---|
| Quadrant | DetID | PixID | Counts | Sigma | Mean | Median | Sigma |
| A | 10 | 83 | 462414 | 4226.78 | 537 | 527 | 109.3 |
| A | 12 | 189 | 93476 | 850.59 | 537 | 527 | 109.3 |
| A | 13 | 254 | 7695 | 65.6 | 537 | 527 | 109.3 |
| B | 3 | 112 | 13950 | 128.98 | 534 | 519 | 104.1 |
| B | 12 | 111 | 12957 | 119.44 | 534 | 519 | 104.1 |
| B | 11 | 111 | 11847 | 108.78 | 534 | 519 | 104.1 |
| C | 15 | 214 | 227539 | 1854.17 | 522 | 526 | 122.4 |
| C | 0 | 10 | 124476 | 1012.39 | 522 | 526 | 122.4 |
| C | 12 | 249 | 10157 | 78.66 | 522 | 526 | 122.4 |
| D | 2 | 249 | 397136 | 3147.43 | 515 | 500 | 126.0 |
| D | 13 | 249 | 166166 | 1314.61 | 515 | 500 | 126.0 |
| D | 12 | 16 | 87561 | 690.86 | 515 | 500 | 126.0 |
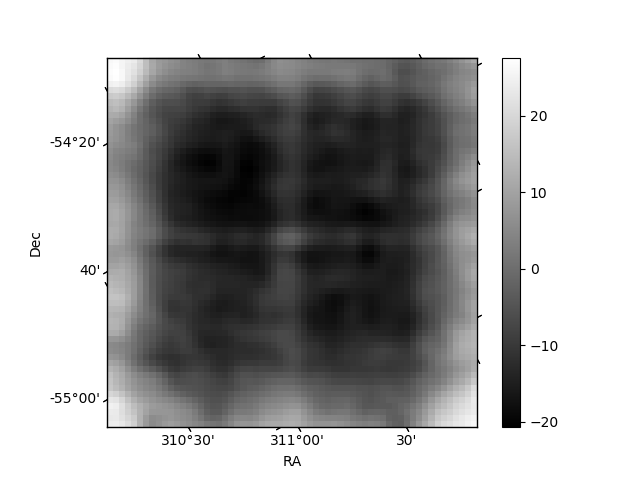
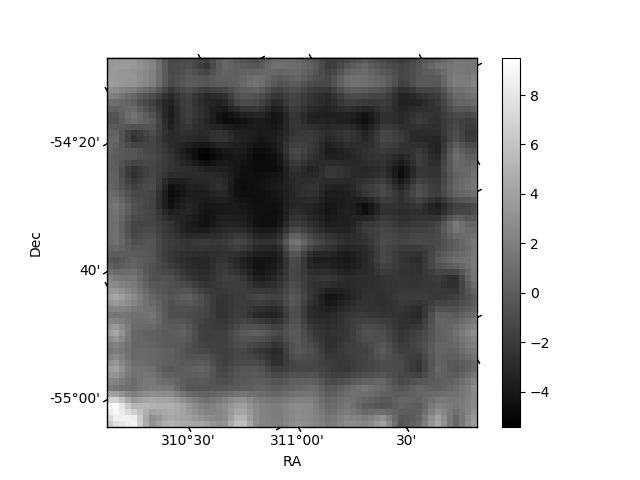
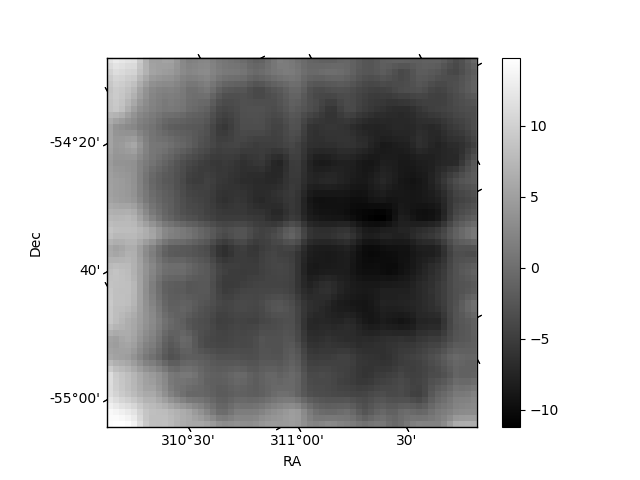
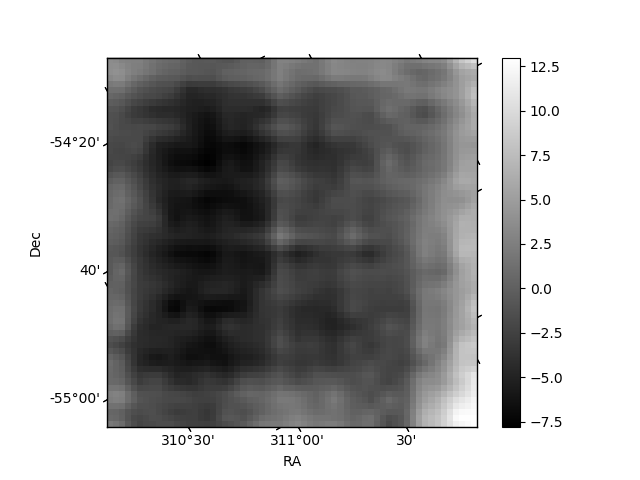
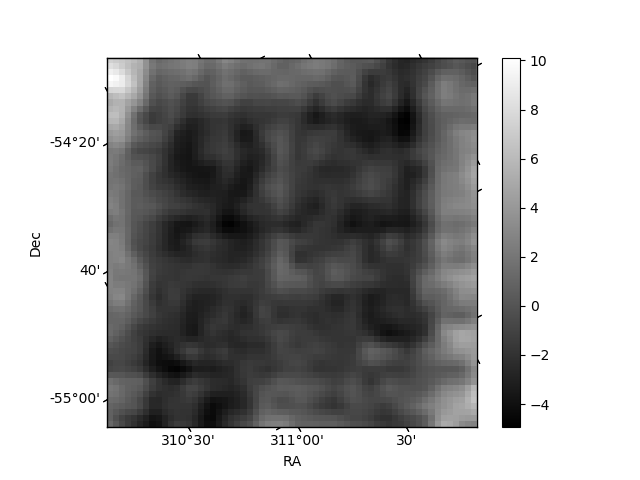
Histogram calculated using DETX and DETY for each event in the final _common_clean file
| Quadrant A | 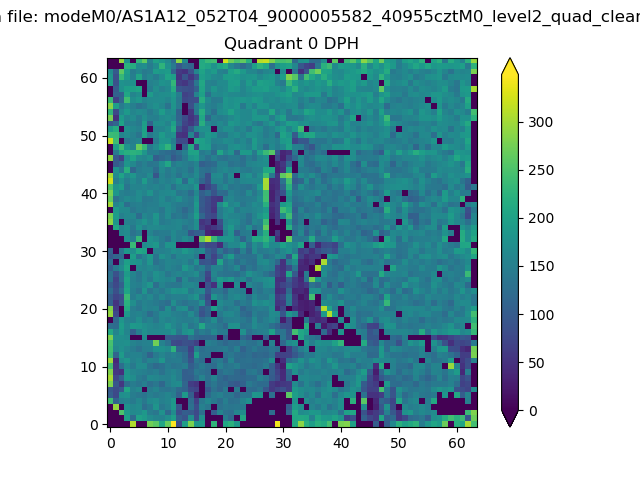 |
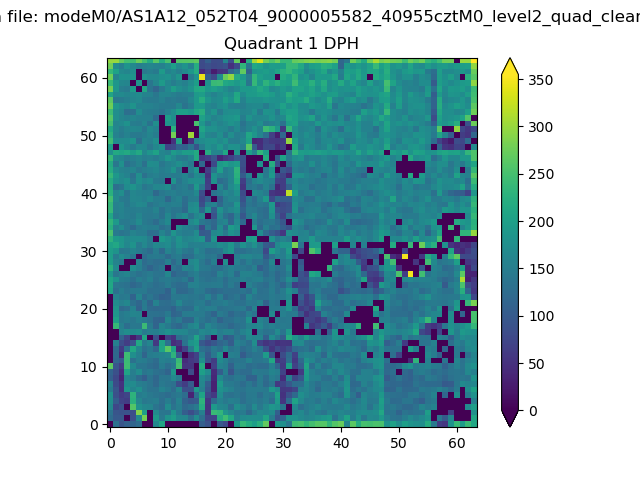 |
Quadrant B |
|---|---|---|---|
| Quadrant D | 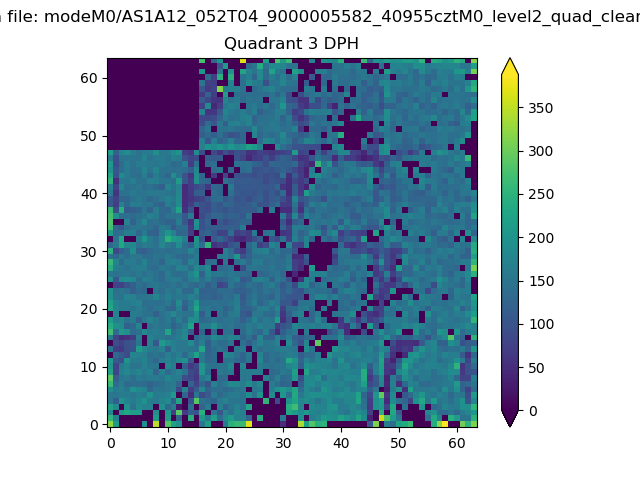 |
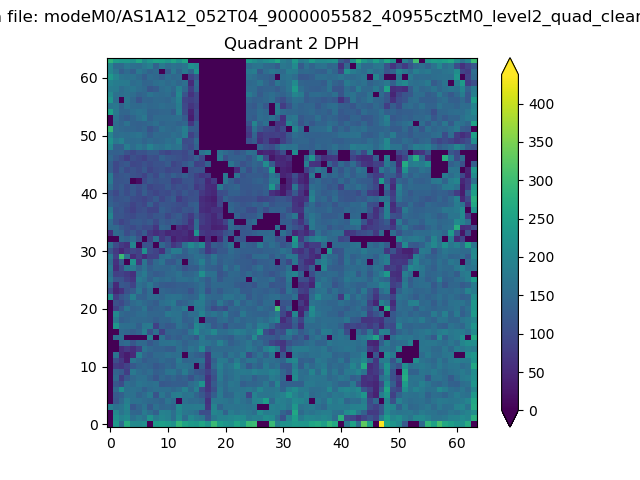 |
Quadrant C |
| Plot type | Count rate plots | Images |
|---|---|---|
| Comparison with Poisson distribution Blue bars denote a histogram of data divided into 1 sec bins. Red curve is a Poisson curve with rate = median count rate of data. |
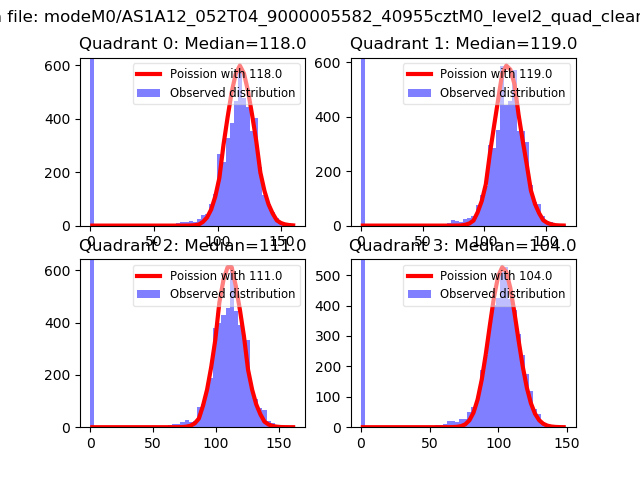 |
 |
| Quadrant-wise count rates Data is divided into 100 sec bins |
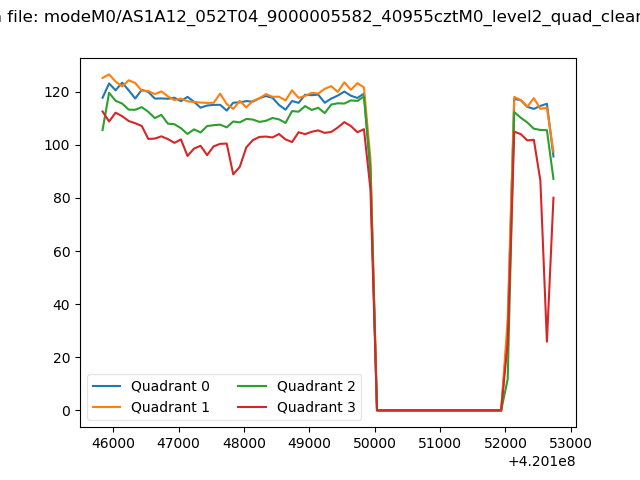 |
|
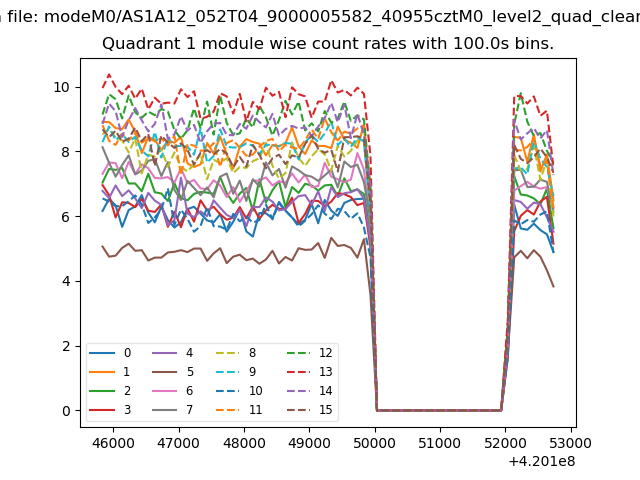
| Module-wise count rates for Quadrant A Data is divided into 100 sec bins |
 |
 |
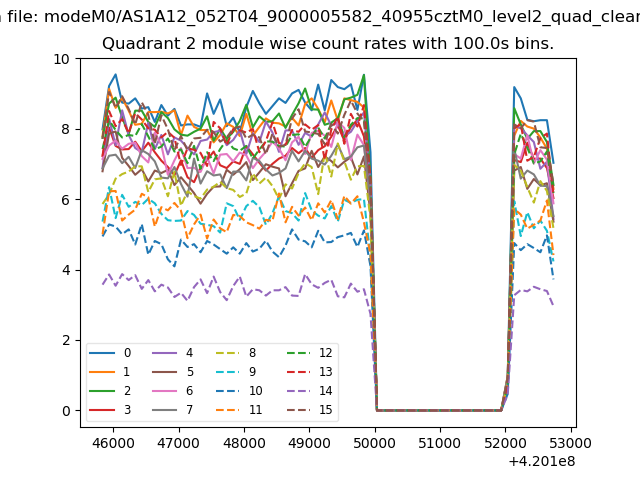
| Module-wise count rates for Quadrant B Data is divided into 100 sec bins |
 |
 |
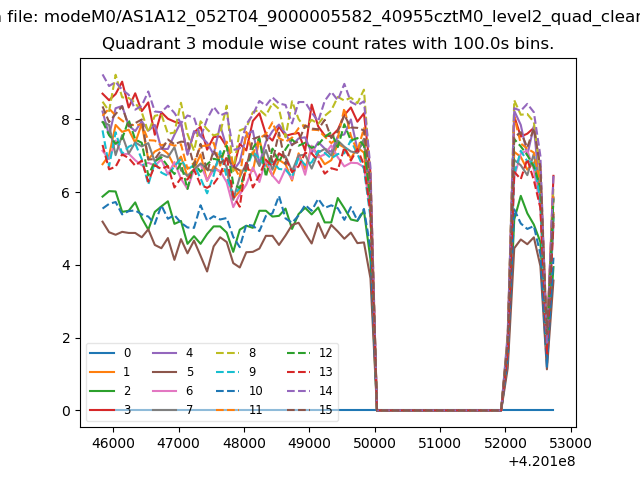
| Module-wise count rates for Quadrant C Data is divided into 100 sec bins |
 |
 |
| Module-wise count rates for Quadrant D Data is divided into 100 sec bins |
 |
 |
| Parameter | Plot |
|---|---|
| CZT HV Monitor | 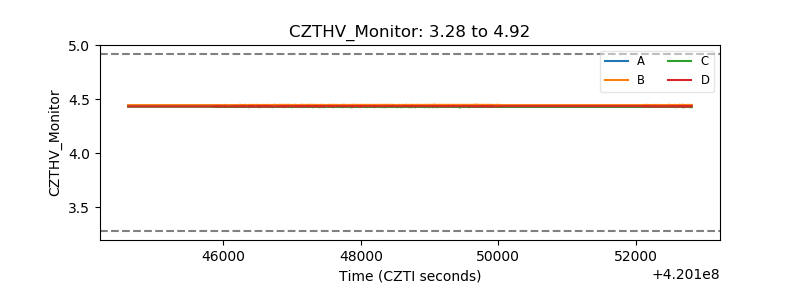 |
| D_VDD | 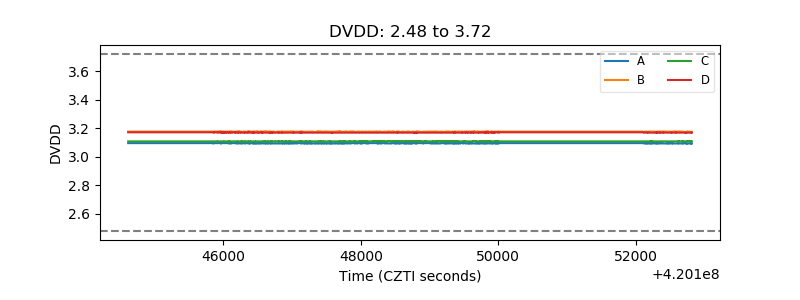 |
| Temperature 1 | 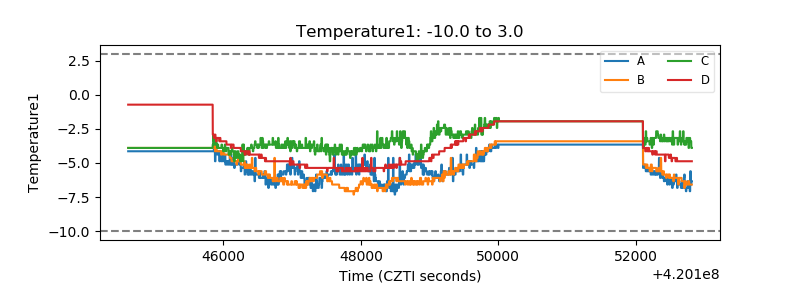 |
| Veto HV Monitor | 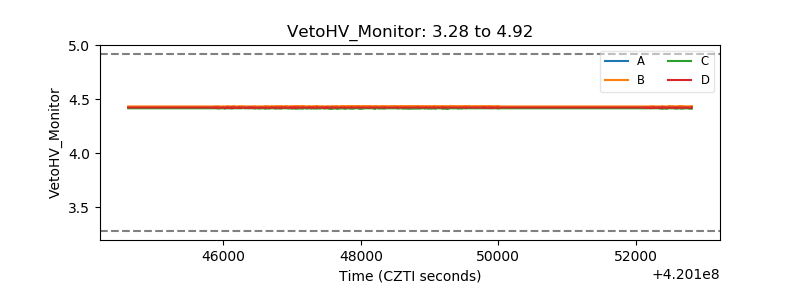 |
| Veto LLD | 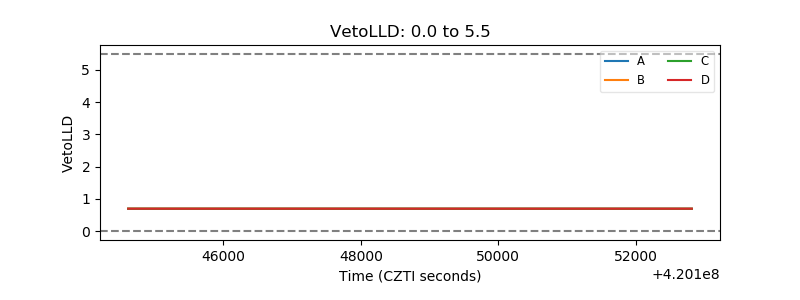 |
| Alpha Counter | 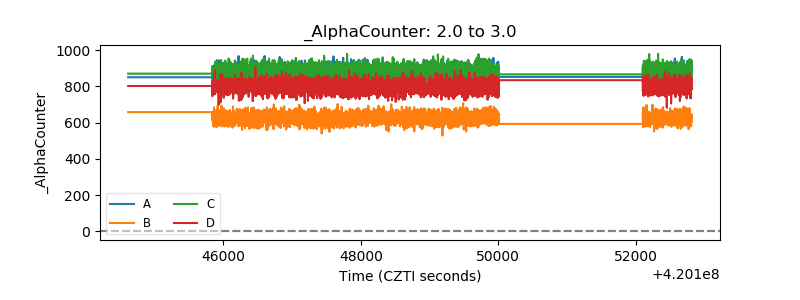 |
| _CPM_Rate | 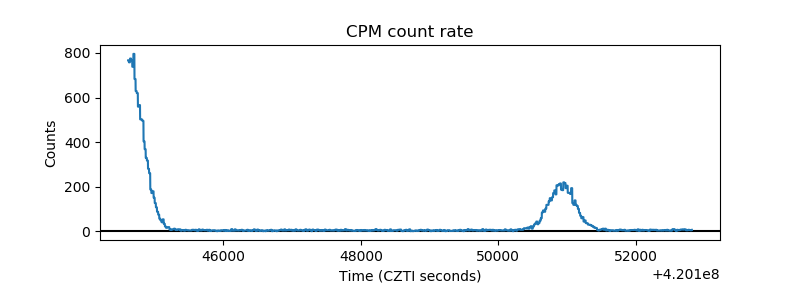 |
| CZT Counter | 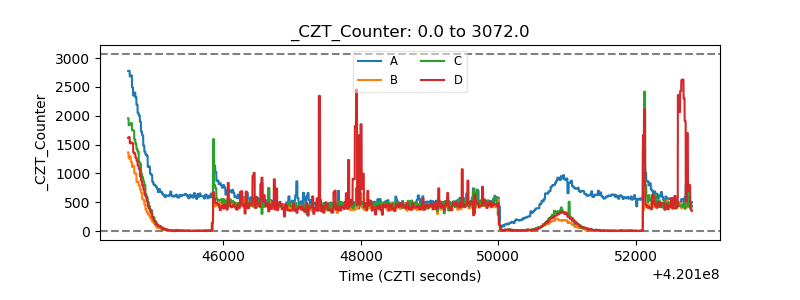 |
| +2.5 Volts monitor | 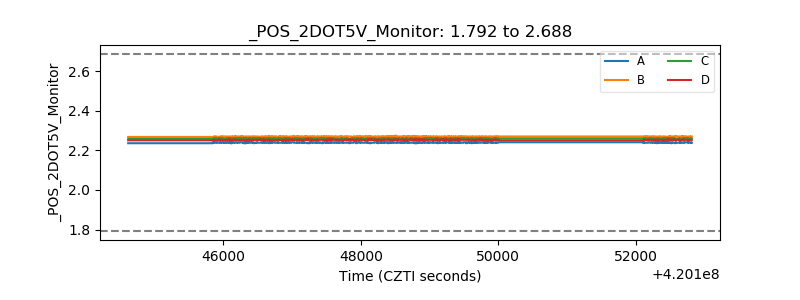 |
| +5 Volts monitor | 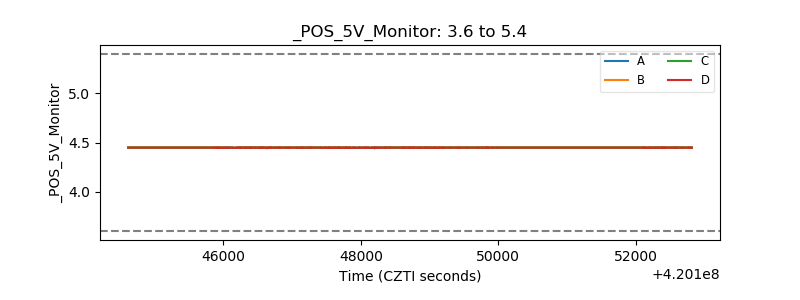 |
| _ROLL_ROT | 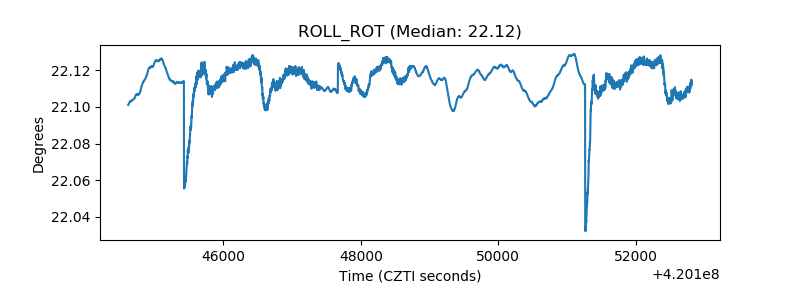 |
| _Roll_DEC | 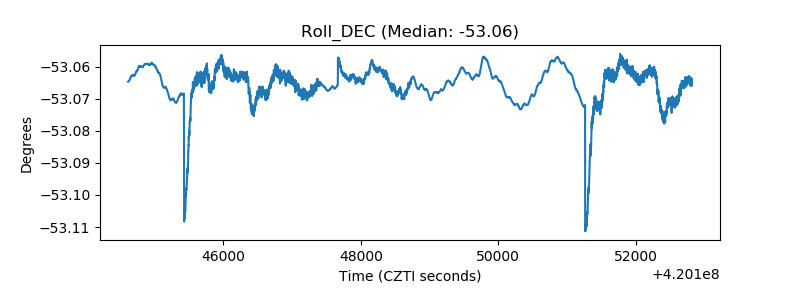 |
| _Roll_RA | 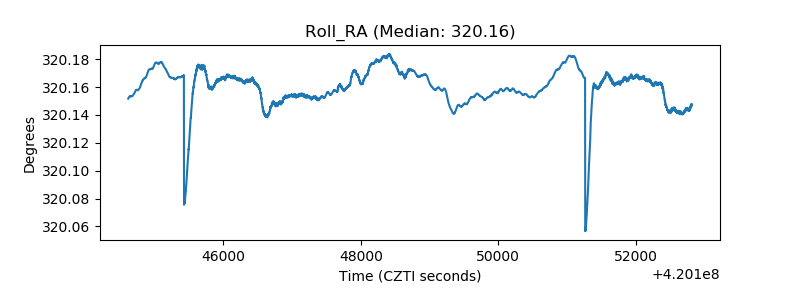 |
| Veto Counter | 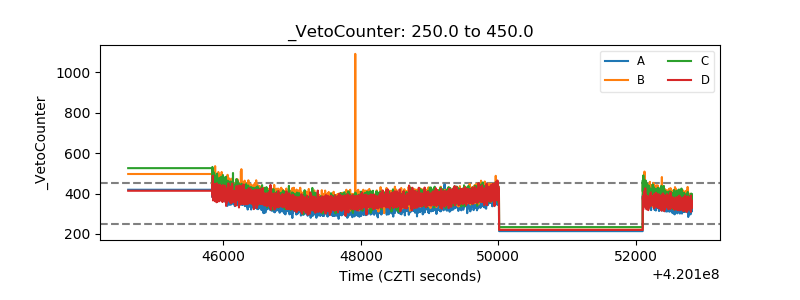 |