| Param | Original file | Final file |
|---|---|---|
| Filename | modeM0/AS1A12_052T04_9000005582_40956cztM0_level2.fits | modeM0/AS1A12_052T04_9000005582_40956cztM0_level2_quad_clean.evt |
| Size (bytes) | 294,393,600 | 84,326,400 |
| Size | 280.8 MB | 80.4 MB |
| Events in quadrant A | 2,656,162 | 574,183 |
| Events in quadrant B | 2,150,504 | 583,297 |
| Events in quadrant C | 2,456,500 | 543,598 |
| Events in quadrant D | 3,236,683 | 495,028 |
| Mode M9 | |||
|---|---|---|---|
| Quadrant | BADHDUFLAG | Total packets | Discarded packets |
| A | 0 | 38 | 0 |
| B | 0 | 38 | 0 |
| C | 0 | 38 | 0 |
| D | 0 | 38 | 0 |
| Mode SS | |||
|---|---|---|---|
| Quadrant | BADHDUFLAG | Total packets | Discarded packets |
| A | 0 | 104 | 0 |
| B | 0 | 104 | 0 |
| C | 0 | 104 | 0 |
| D | 0 | 104 | 0 |
| Mode M0 | |||
|---|---|---|---|
| Quadrant | BADHDUFLAG | Total packets | Discarded packets |
| A | 0 | 11018 | 3 |
| B | 0 | 10202 | 2 |
| C | 0 | 10583 | 2 |
| D | 0 | 13272 | 2 |
| Quadrant | Total seconds | Saturated seconds | Saturation percentage |
|---|---|---|---|
| A | 5098 | 12 | 0.235386% |
| B | 5098 | 6 | 0.117693% |
| C | 5098 | 33 | 0.647313% |
| D | 5098 | 204 | 4.001569% |
Noise dominated data is calculated using 1-second bins in cleaned event files. If a bin has >2000 counts, and if more than 50% of those come from <1% of pixels, then it is considered to be noise-dominated and hence unusable.
| Quadrant | # 1 sec bins | Bins with >0 counts | Bins with >2000 counts | High rate bins dominated by noise | Noise dominated (total time) | Noise dominated (detector-on time) | Marked lightcurve |
|---|---|---|---|---|---|---|---|
| A | 6951 | 5099 | 4 | 4 | 0.06% | 0.08% | 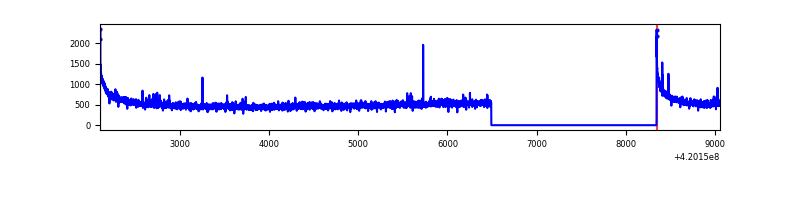 |
| B | 6951 | 5099 | 0 | 0 | 0.00% | 0.00% | 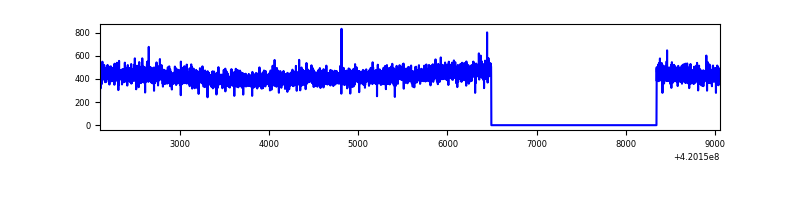 |
| C | 6951 | 5099 | 25 | 25 | 0.36% | 0.49% | 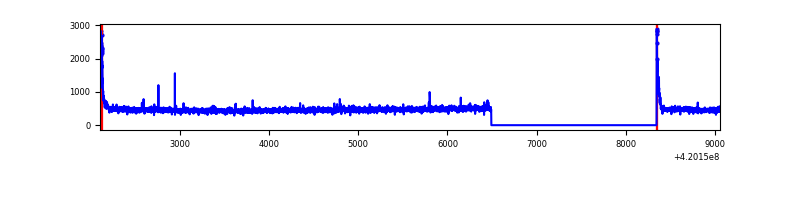 |
| D | 6951 | 5099 | 177 | 177 | 2.55% | 3.47% | 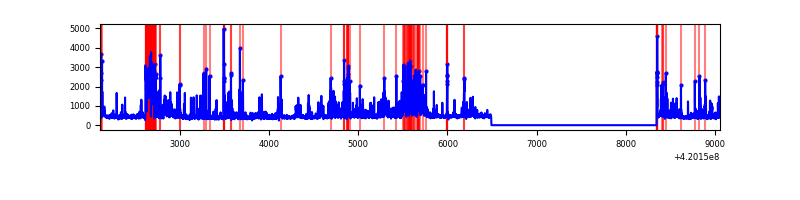 |
Top three noisy pixels from each quadrant. If the there are fewer than three noisy pixels in the level2.evt file, extra rows are filled as -1
| Pixel properties | Quadrant properties | ||||||
|---|---|---|---|---|---|---|---|
| Quadrant | DetID | PixID | Counts | Sigma | Mean | Median | Sigma |
| A | 10 | 83 | 475484 | 4254.06 | 549 | 538 | 111.6 |
| A | 12 | 189 | 41472 | 366.64 | 549 | 538 | 111.6 |
| A | 15 | 191 | 8496 | 71.28 | 549 | 538 | 111.6 |
| B | 12 | 111 | 13388 | 122.49 | 546 | 531 | 105.0 |
| B | 11 | 111 | 12309 | 112.21 | 546 | 531 | 105.0 |
| B | 14 | 111 | 11838 | 107.73 | 546 | 531 | 105.0 |
| C | 15 | 214 | 240208 | 1891.71 | 536 | 539 | 126.7 |
| C | 0 | 10 | 110249 | 865.94 | 536 | 539 | 126.7 |
| C | 12 | 249 | 13088 | 99.05 | 536 | 539 | 126.7 |
| D | 13 | 249 | 647810 | 4996.14 | 529 | 512 | 129.6 |
| D | 2 | 249 | 436055 | 3361.72 | 529 | 512 | 129.6 |
| D | 12 | 6 | 61007 | 466.93 | 529 | 512 | 129.6 |
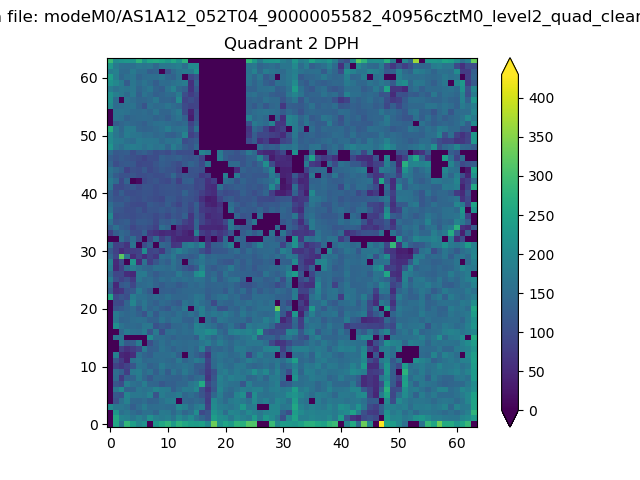
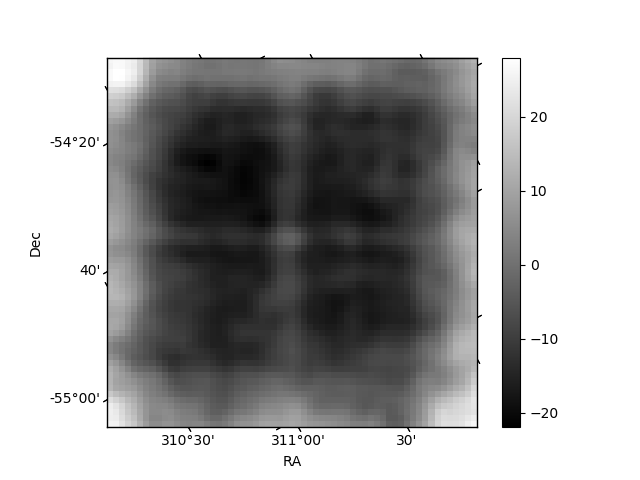
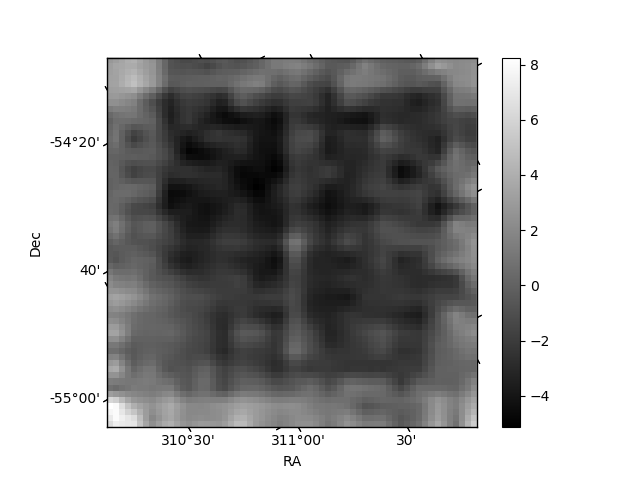
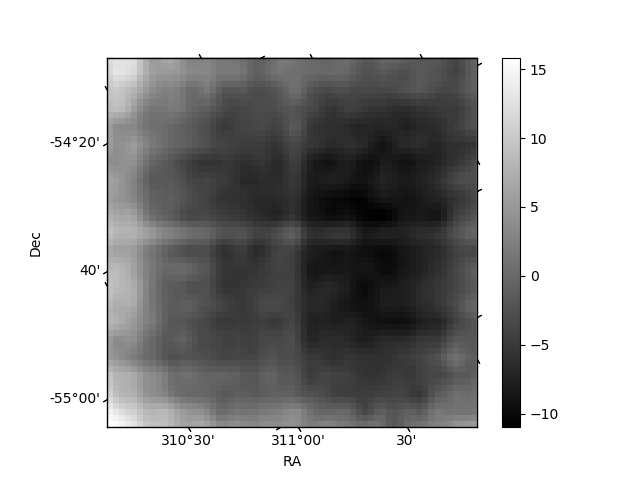
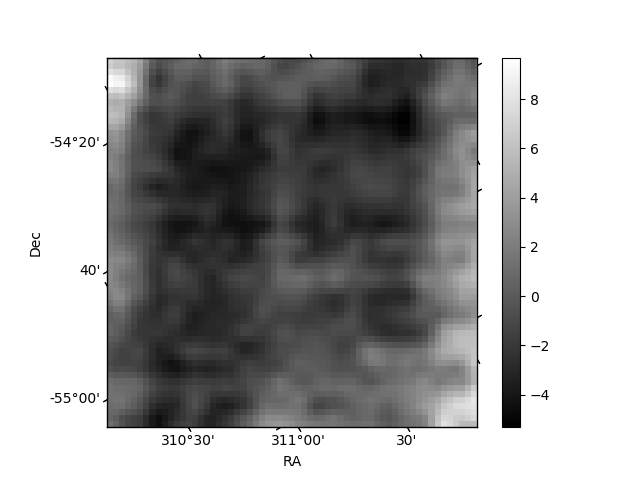
Histogram calculated using DETX and DETY for each event in the final _common_clean file
| Quadrant A | 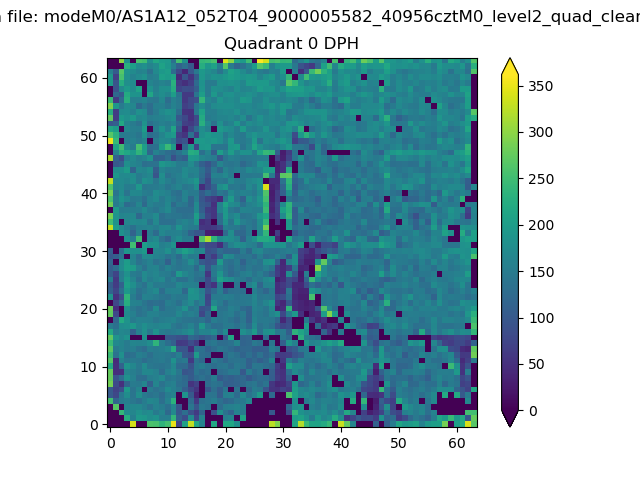 |
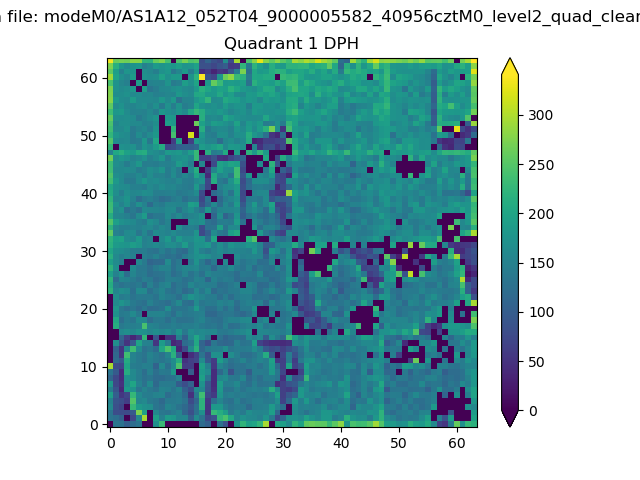 |
Quadrant B |
|---|---|---|---|
| Quadrant D | 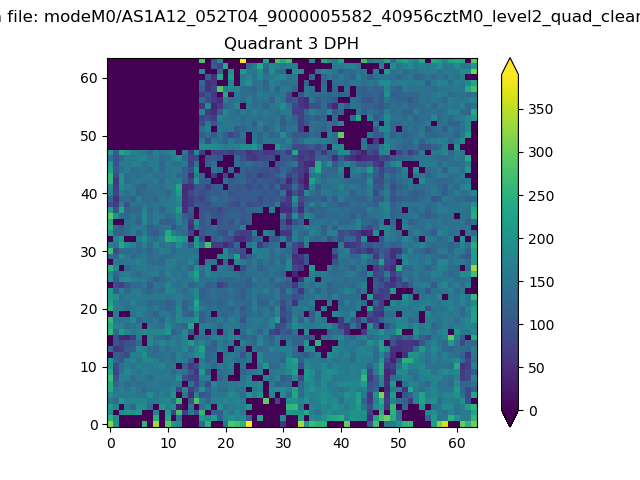 |
 |
Quadrant C |
| Plot type | Count rate plots | Images |
|---|---|---|
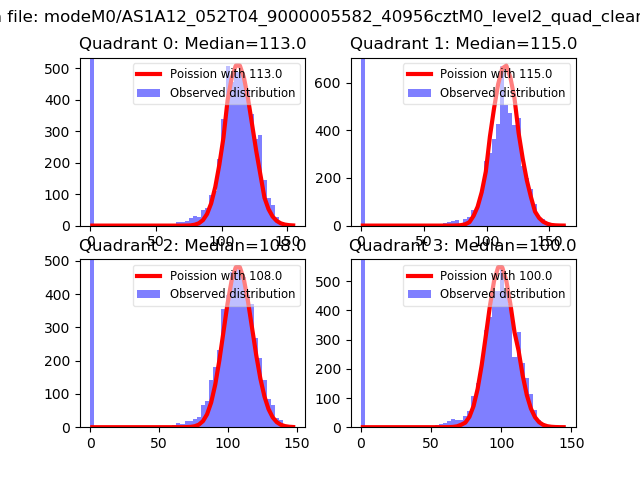
| Comparison with Poisson distribution Blue bars denote a histogram of data divided into 1 sec bins. Red curve is a Poisson curve with rate = median count rate of data. |
 |
 |
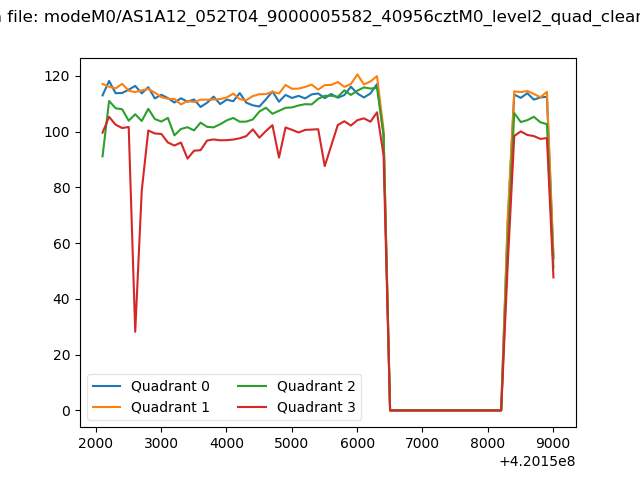
| Quadrant-wise count rates Data is divided into 100 sec bins |
 |
|
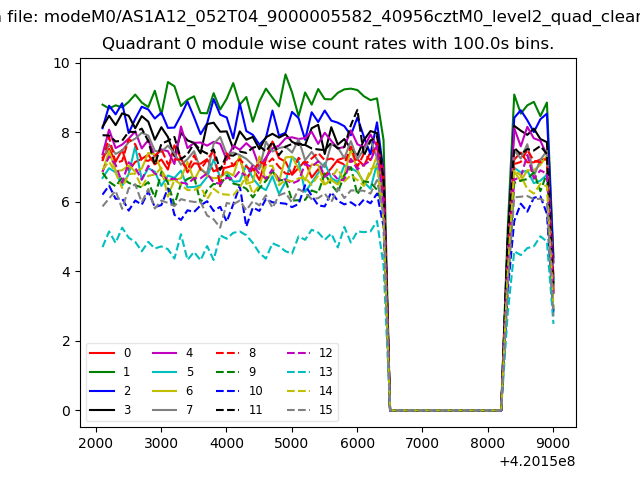
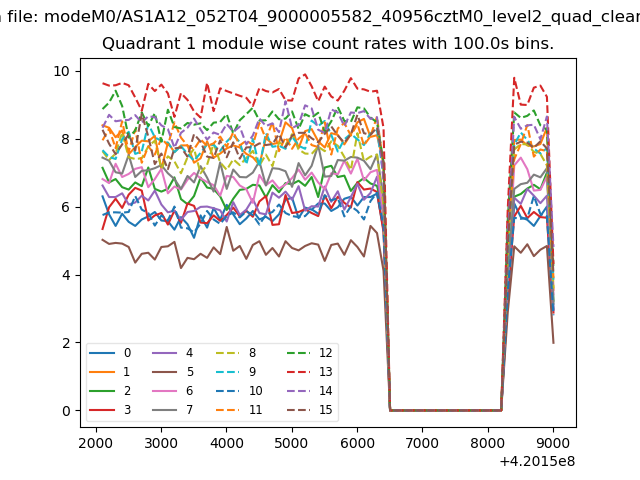
| Module-wise count rates for Quadrant A Data is divided into 100 sec bins |
 |
 |
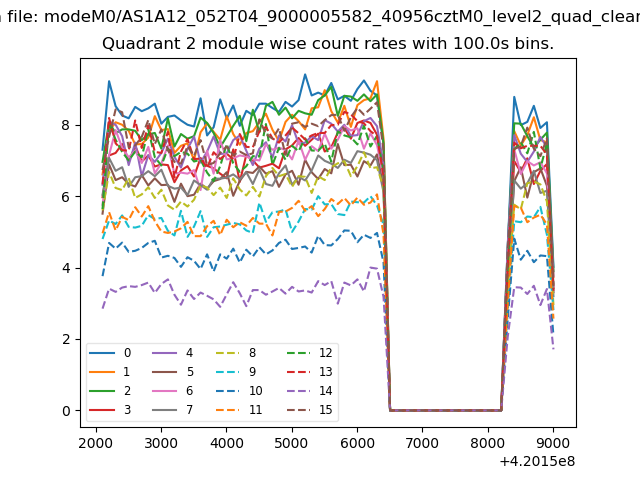
| Module-wise count rates for Quadrant B Data is divided into 100 sec bins |
 |
 |
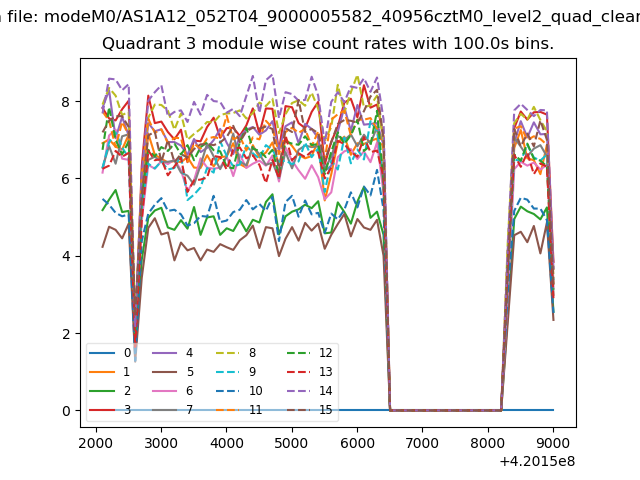
| Module-wise count rates for Quadrant C Data is divided into 100 sec bins |
 |
 |
| Module-wise count rates for Quadrant D Data is divided into 100 sec bins |
 |
 |
| Parameter | Plot |
|---|---|
| CZT HV Monitor | 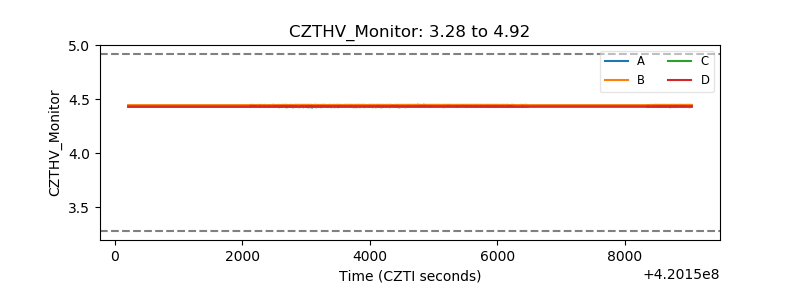 |
| D_VDD | 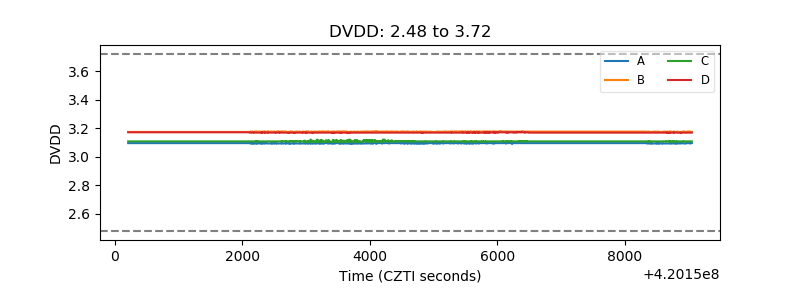 |
| Temperature 1 | 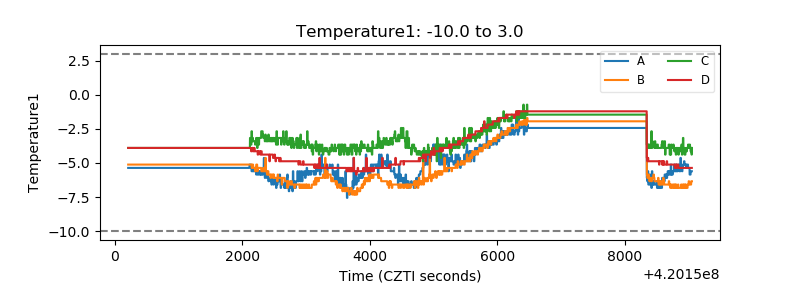 |
| Veto HV Monitor | 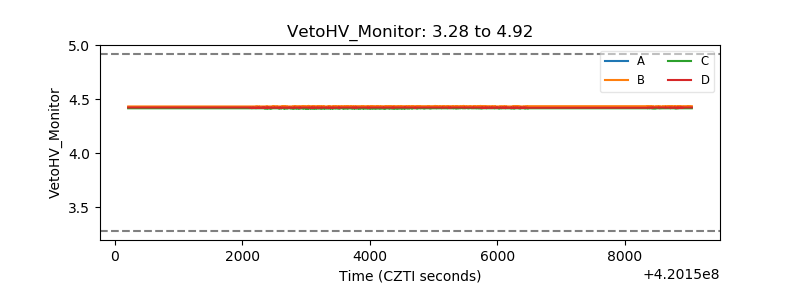 |
| Veto LLD | 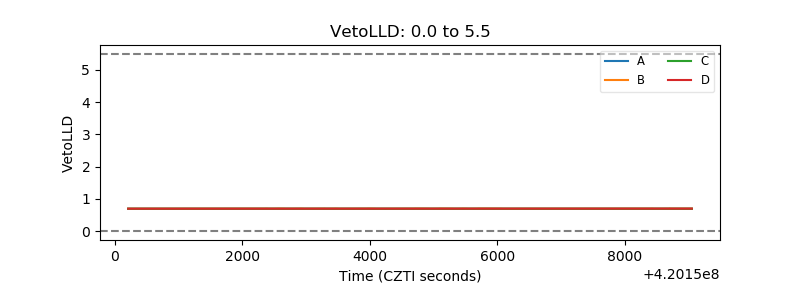 |
| Alpha Counter | 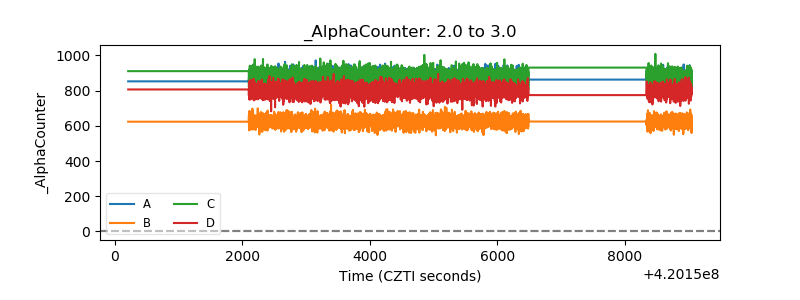 |
| _CPM_Rate |  |
| CZT Counter | 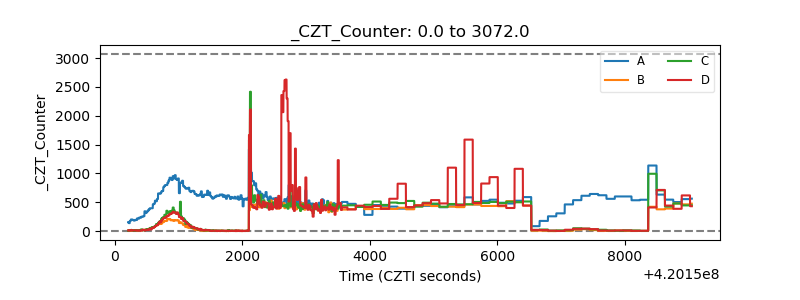 |
| +2.5 Volts monitor | 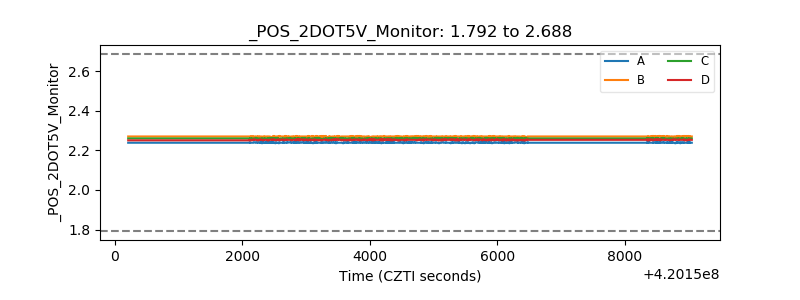 |
| +5 Volts monitor | 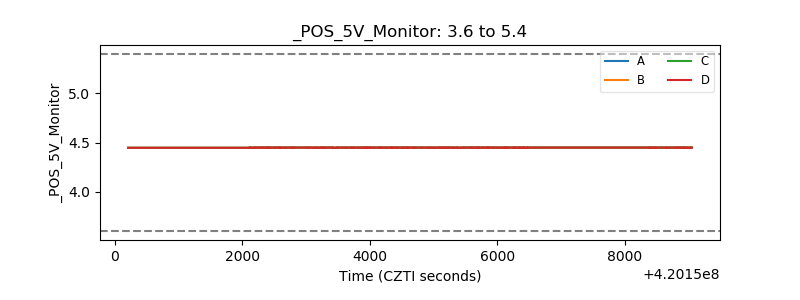 |
| _ROLL_ROT | 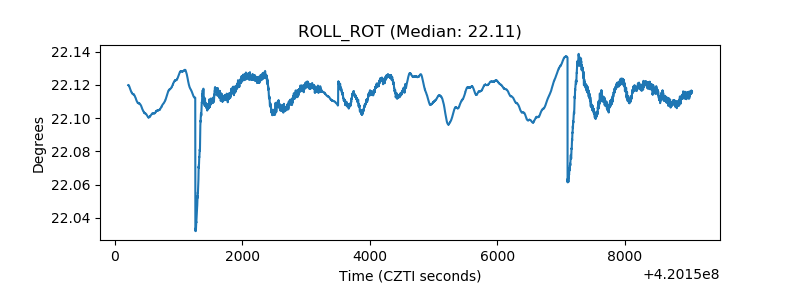 |
| _Roll_DEC | 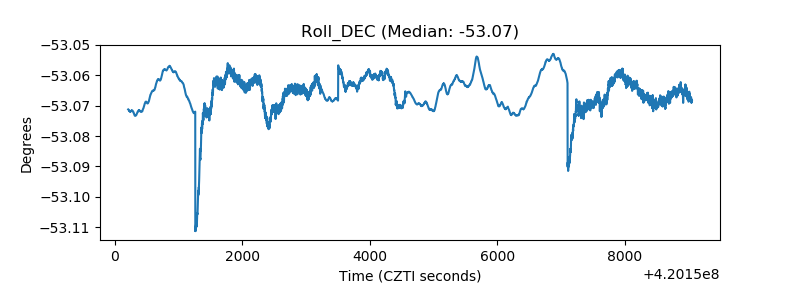 |
| _Roll_RA | 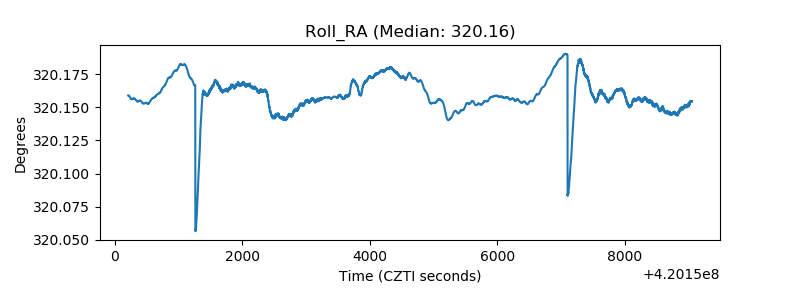 |
| Veto Counter | 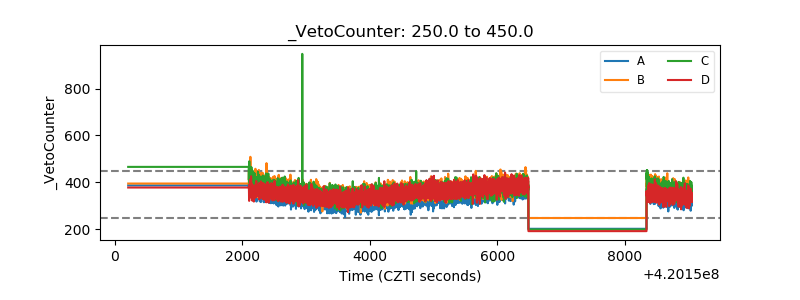 |