| Param | Original file | Final file |
|---|---|---|
| Filename | modeM0/AS1A12_052T04_9000005582_40957cztM0_level2.fits | modeM0/AS1A12_052T04_9000005582_40957cztM0_level2_quad_clean.evt |
| Size (bytes) | 333,213,120 | 90,023,040 |
| Size | 317.8 MB | 85.9 MB |
| Events in quadrant A | 3,033,289 | 611,972 |
| Events in quadrant B | 2,363,917 | 620,892 |
| Events in quadrant C | 2,661,837 | 581,408 |
| Events in quadrant D | 3,844,372 | 524,733 |
| Mode M9 | |||
|---|---|---|---|
| Quadrant | BADHDUFLAG | Total packets | Discarded packets |
| A | 0 | 32 | 0 |
| B | 0 | 32 | 0 |
| C | 0 | 32 | 0 |
| D | 0 | 33 | 0 |
| Mode SS | |||
|---|---|---|---|
| Quadrant | BADHDUFLAG | Total packets | Discarded packets |
| A | 0 | 112 | 0 |
| B | 0 | 112 | 0 |
| C | 0 | 112 | 0 |
| D | 0 | 112 | 0 |
| Mode M0 | |||
|---|---|---|---|
| Quadrant | BADHDUFLAG | Total packets | Discarded packets |
| A | 0 | 12446 | 3 |
| B | 0 | 11139 | 2 |
| C | 0 | 11472 | 2 |
| D | 0 | 15420 | 2 |
| Quadrant | Total seconds | Saturated seconds | Saturation percentage |
|---|---|---|---|
| A | 5531 | 9 | 0.162719% |
| B | 5531 | 4 | 0.072320% |
| C | 5531 | 28 | 0.506238% |
| D | 5531 | 312 | 5.640933% |
Noise dominated data is calculated using 1-second bins in cleaned event files. If a bin has >2000 counts, and if more than 50% of those come from <1% of pixels, then it is considered to be noise-dominated and hence unusable.
| Quadrant | # 1 sec bins | Bins with >0 counts | Bins with >2000 counts | High rate bins dominated by noise | Noise dominated (total time) | Noise dominated (detector-on time) | Marked lightcurve |
|---|---|---|---|---|---|---|---|
| A | 7024 | 5532 | 3 | 3 | 0.04% | 0.05% | 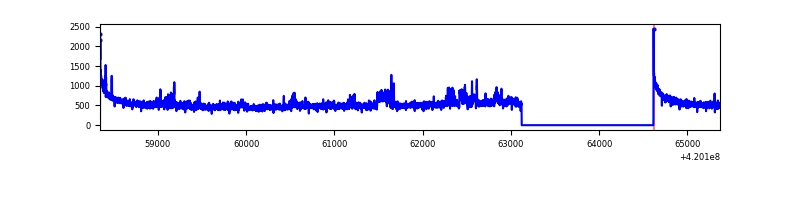 |
| B | 7024 | 5532 | 0 | 0 | 0.00% | 0.00% | 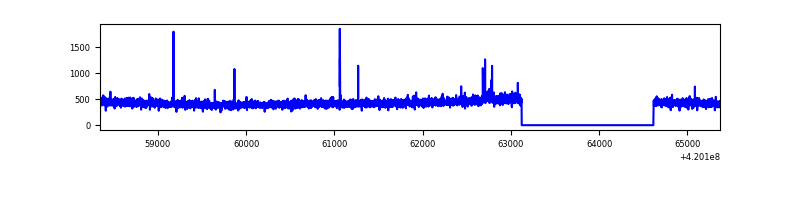 |
| C | 7024 | 5532 | 24 | 24 | 0.34% | 0.43% | 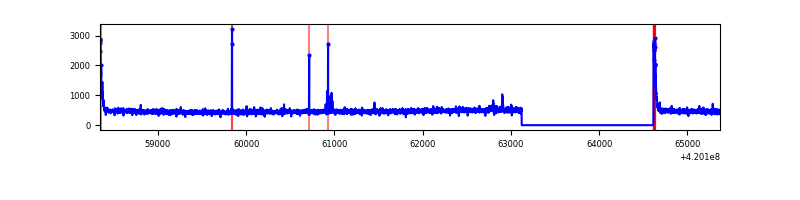 |
| D | 7024 | 5532 | 281 | 281 | 4.00% | 5.08% | 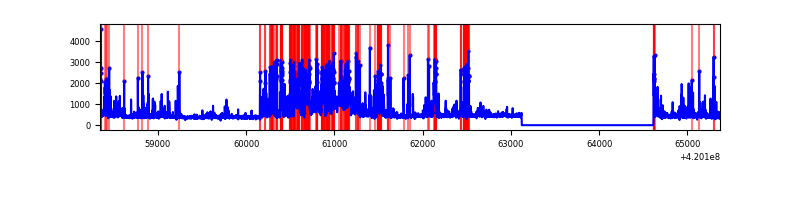 |
Top three noisy pixels from each quadrant. If the there are fewer than three noisy pixels in the level2.evt file, extra rows are filled as -1
| Pixel properties | Quadrant properties | ||||||
|---|---|---|---|---|---|---|---|
| Quadrant | DetID | PixID | Counts | Sigma | Mean | Median | Sigma |
| A | 10 | 83 | 502436 | 4097.0 | 596 | 583 | 122.5 |
| A | 12 | 189 | 200907 | 1635.39 | 596 | 583 | 122.5 |
| A | 15 | 191 | 15376 | 120.76 | 596 | 583 | 122.5 |
| B | 12 | 111 | 14641 | 122.41 | 593 | 576 | 114.9 |
| B | 0 | 186 | 13929 | 116.21 | 593 | 576 | 114.9 |
| B | 11 | 111 | 13576 | 113.14 | 593 | 576 | 114.9 |
| C | 15 | 214 | 255602 | 1864.39 | 583 | 587 | 136.8 |
| C | 0 | 10 | 100035 | 727.05 | 583 | 587 | 136.8 |
| C | 14 | 254 | 13190 | 92.14 | 583 | 587 | 136.8 |
| D | 13 | 249 | 750883 | 5323.47 | 572 | 554 | 140.9 |
| D | 2 | 249 | 749246 | 5311.85 | 572 | 554 | 140.9 |
| D | 12 | 6 | 75435 | 531.27 | 572 | 554 | 140.9 |
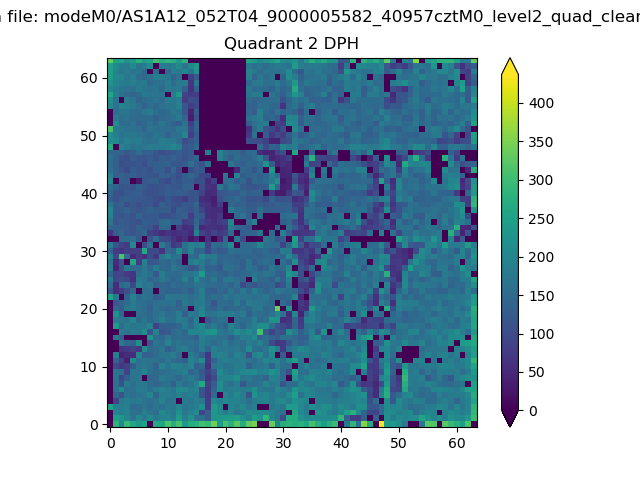
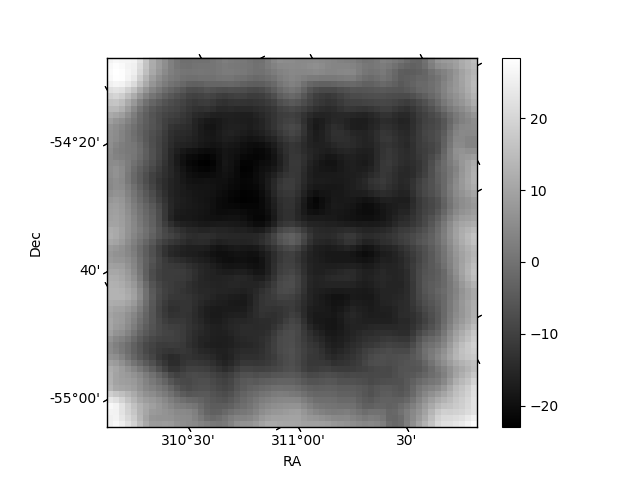
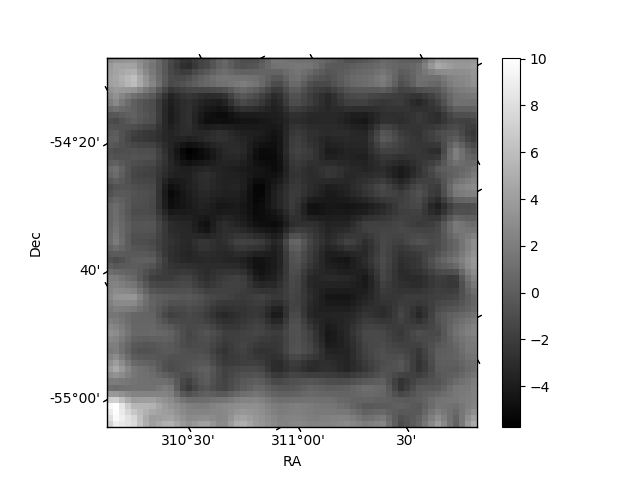
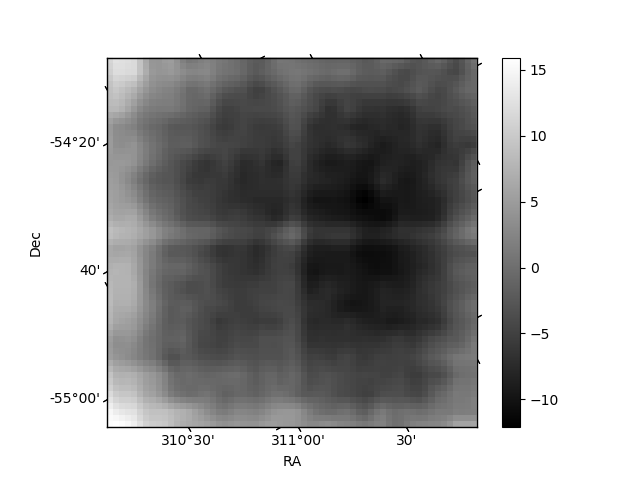
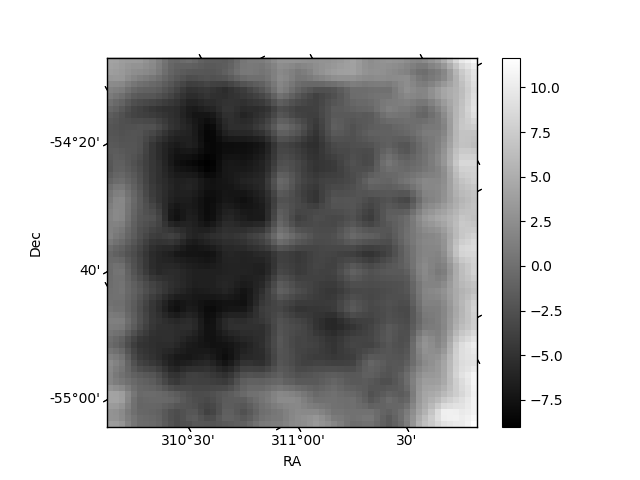
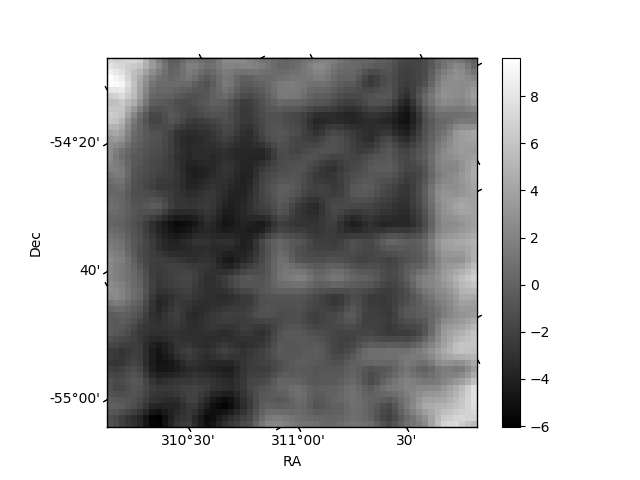
Histogram calculated using DETX and DETY for each event in the final _common_clean file
| Quadrant A | 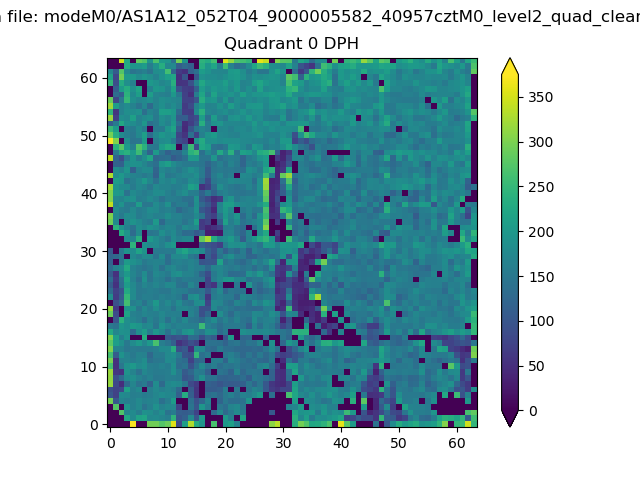 |
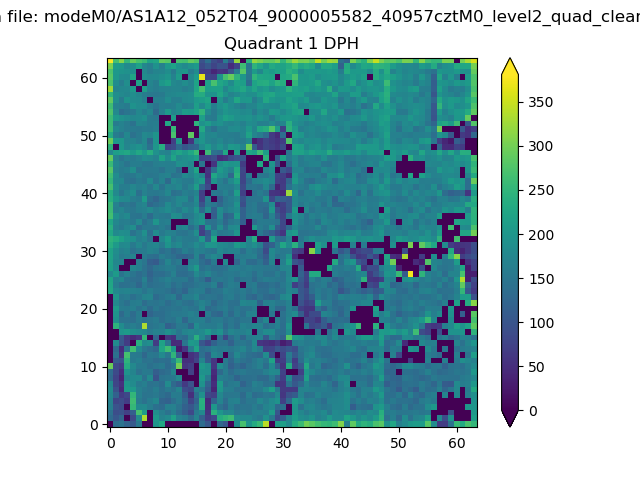 |
Quadrant B |
|---|---|---|---|
| Quadrant D | 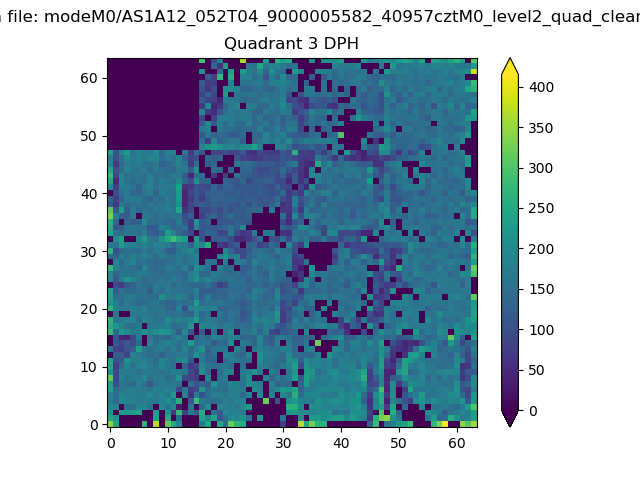 |
 |
Quadrant C |
| Plot type | Count rate plots | Images |
|---|---|---|
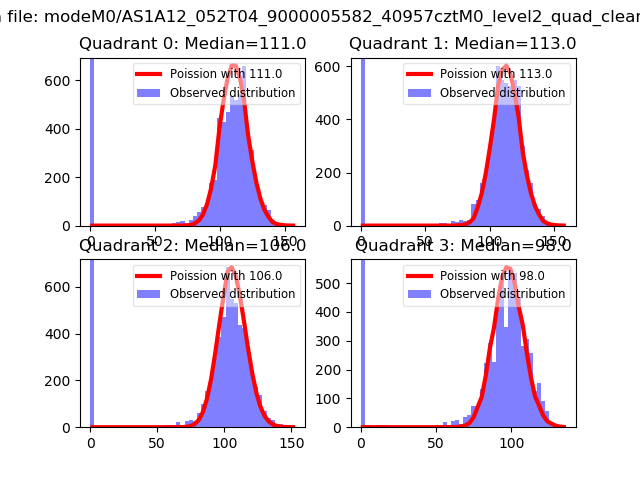
| Comparison with Poisson distribution Blue bars denote a histogram of data divided into 1 sec bins. Red curve is a Poisson curve with rate = median count rate of data. |
 |
 |
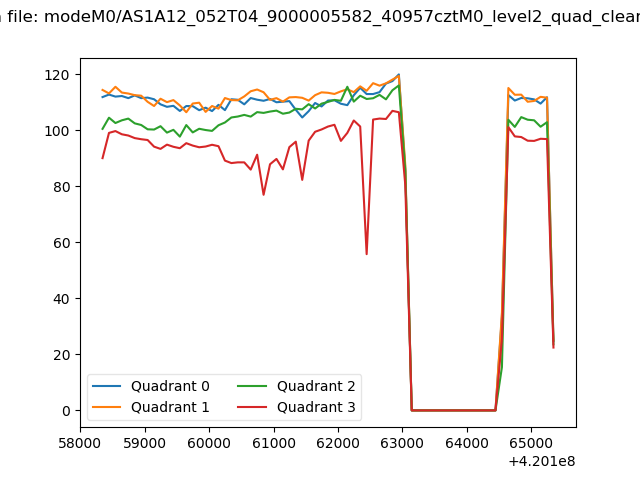
| Quadrant-wise count rates Data is divided into 100 sec bins |
 |
|
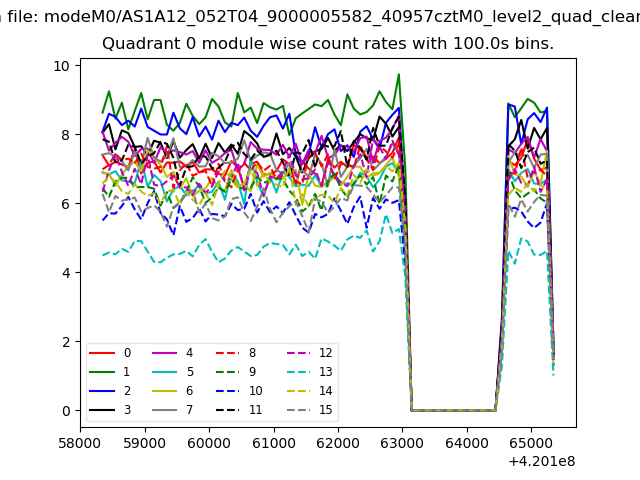
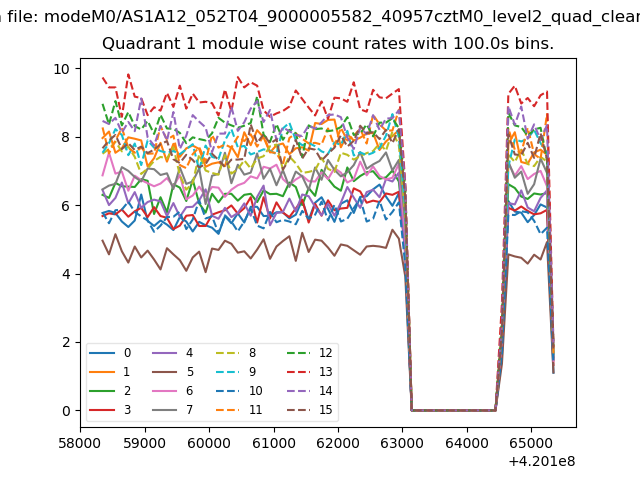
| Module-wise count rates for Quadrant A Data is divided into 100 sec bins |
 |
 |
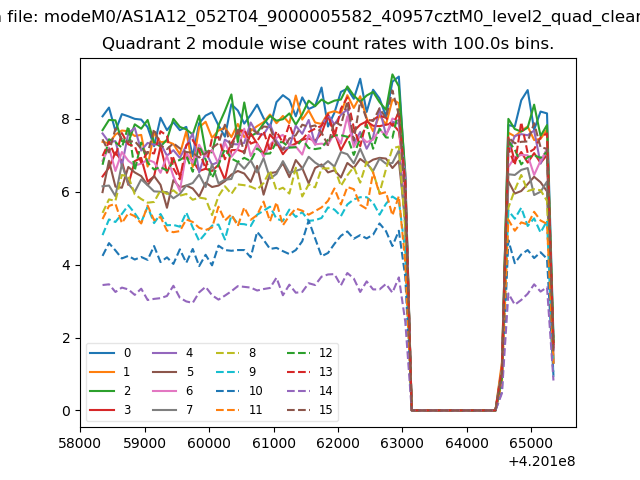
| Module-wise count rates for Quadrant B Data is divided into 100 sec bins |
 |
 |
| Module-wise count rates for Quadrant C Data is divided into 100 sec bins |
 |
 |
| Module-wise count rates for Quadrant D Data is divided into 100 sec bins |
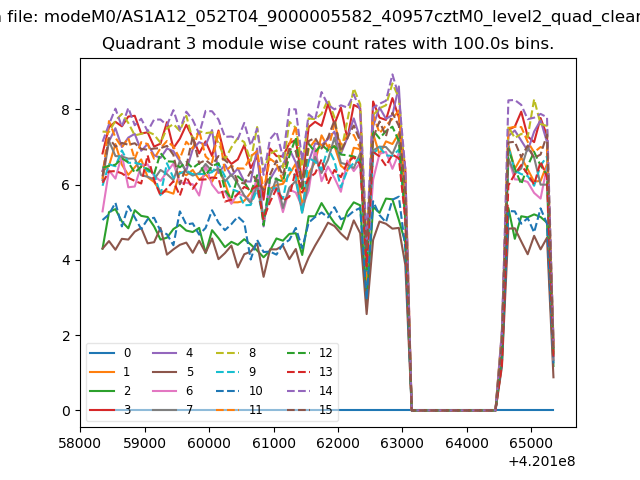 |
 |
| Parameter | Plot |
|---|---|
| CZT HV Monitor | 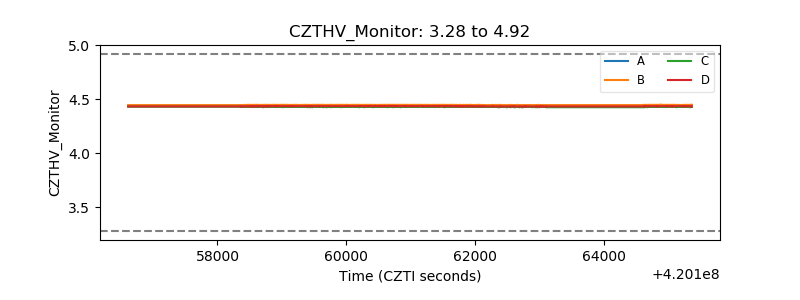 |
| D_VDD |  |
| Temperature 1 | 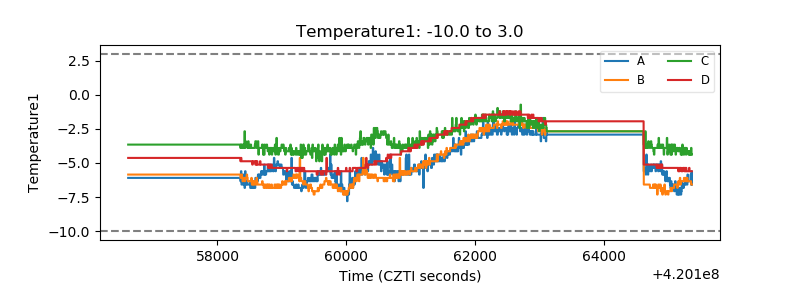 |
| Veto HV Monitor | 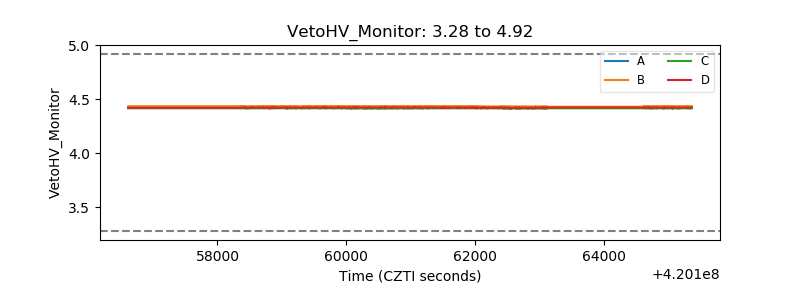 |
| Veto LLD | 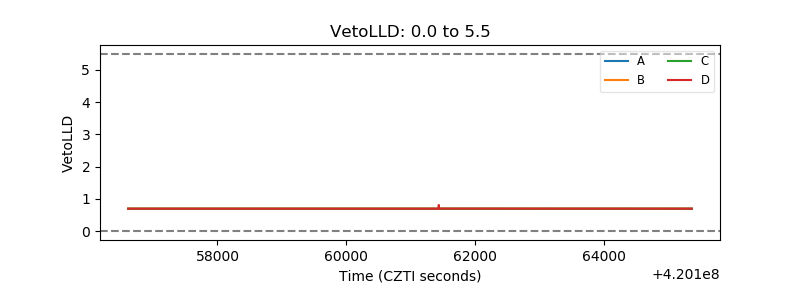 |
| Alpha Counter |  |
| _CPM_Rate | 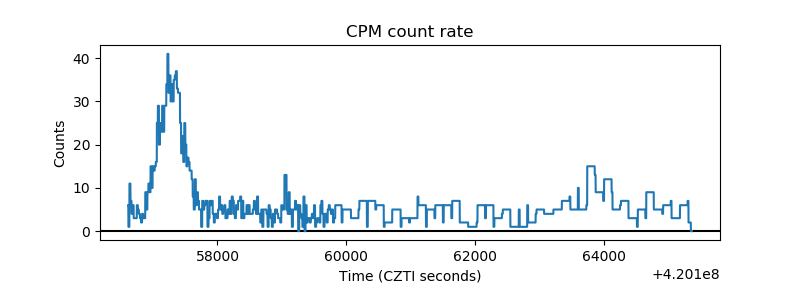 |
| CZT Counter | 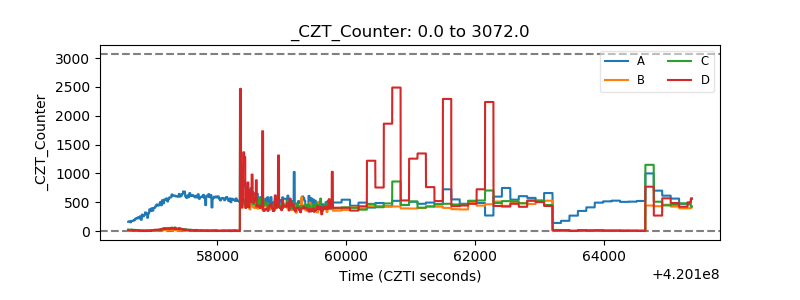 |
| +2.5 Volts monitor | 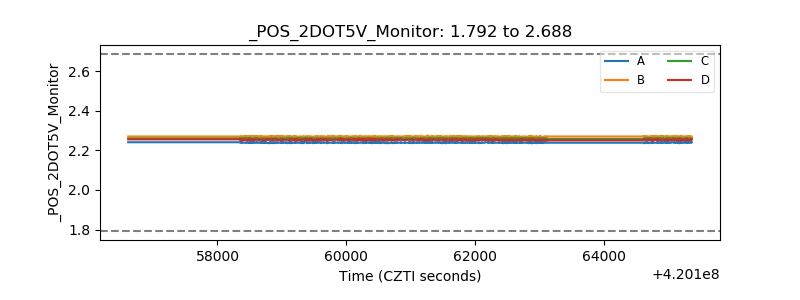 |
| +5 Volts monitor | 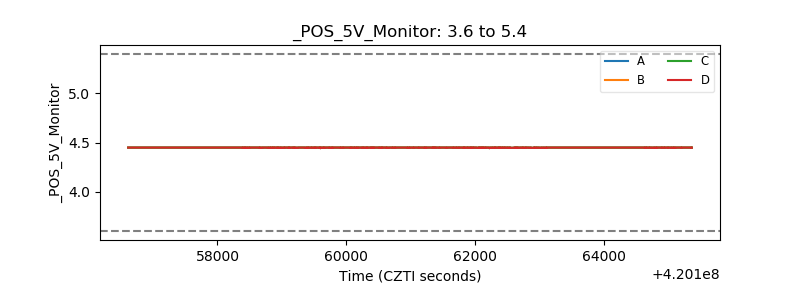 |
| _ROLL_ROT | 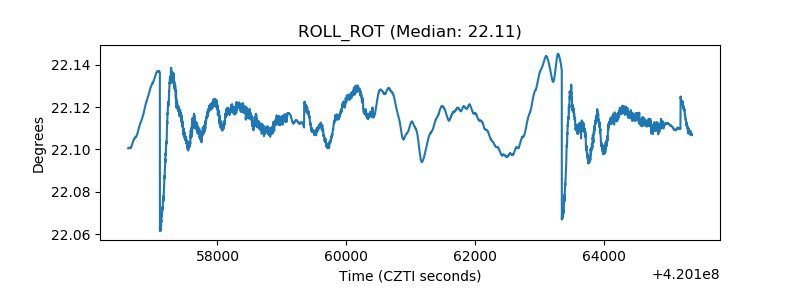 |
| _Roll_DEC | 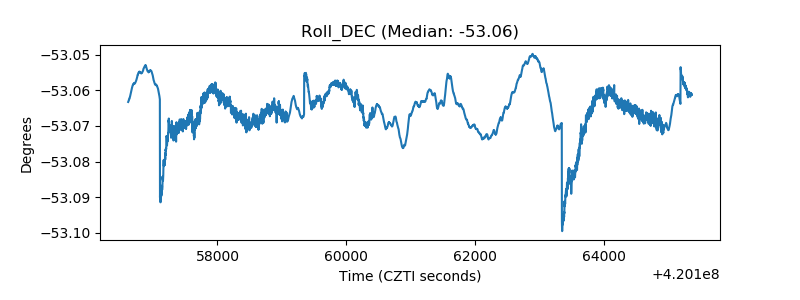 |
| _Roll_RA | 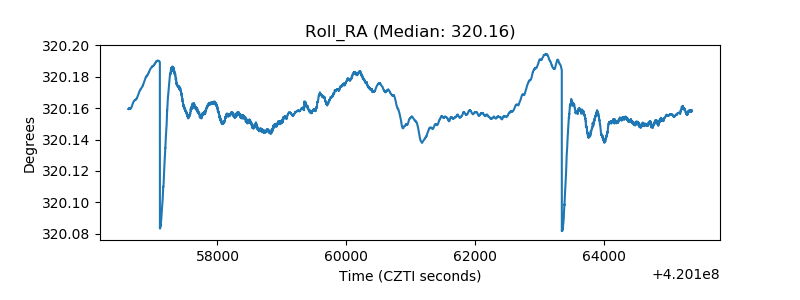 |
| Veto Counter | 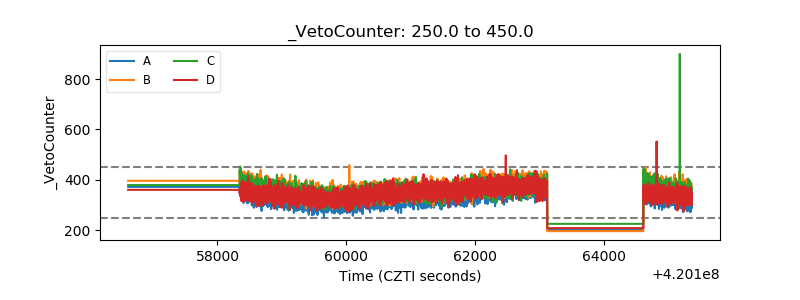 |