| Param | Original file | Final file |
|---|---|---|
| Filename | modeM0/AS1A12_052T04_9000005582_40958cztM0_level2.fits | modeM0/AS1A12_052T04_9000005582_40958cztM0_level2_quad_clean.evt |
| Size (bytes) | 337,484,160 | 94,875,840 |
| Size | 321.8 MB | 90.5 MB |
| Events in quadrant A | 3,165,596 | 642,414 |
| Events in quadrant B | 2,503,000 | 651,563 |
| Events in quadrant C | 2,816,375 | 616,577 |
| Events in quadrant D | 3,548,275 | 550,613 |
| Mode M9 | |||
|---|---|---|---|
| Quadrant | BADHDUFLAG | Total packets | Discarded packets |
| A | 0 | 28 | 0 |
| B | 0 | 28 | 0 |
| C | 0 | 28 | 0 |
| D | 0 | 28 | 0 |
| Mode SS | |||
|---|---|---|---|
| Quadrant | BADHDUFLAG | Total packets | Discarded packets |
| A | 0 | 122 | 0 |
| B | 0 | 122 | 0 |
| C | 0 | 122 | 0 |
| D | 0 | 122 | 0 |
| Mode M0 | |||
|---|---|---|---|
| Quadrant | BADHDUFLAG | Total packets | Discarded packets |
| A | 0 | 12930 | 3 |
| B | 0 | 11811 | 2 |
| C | 0 | 12130 | 2 |
| D | 0 | 14840 | 2 |
| Quadrant | Total seconds | Saturated seconds | Saturation percentage |
|---|---|---|---|
| A | 5892 | 7 | 0.118805% |
| B | 5892 | 5 | 0.084861% |
| C | 5892 | 29 | 0.492193% |
| D | 5892 | 328 | 5.566870% |
Noise dominated data is calculated using 1-second bins in cleaned event files. If a bin has >2000 counts, and if more than 50% of those come from <1% of pixels, then it is considered to be noise-dominated and hence unusable.
| Quadrant | # 1 sec bins | Bins with >0 counts | Bins with >2000 counts | High rate bins dominated by noise | Noise dominated (total time) | Noise dominated (detector-on time) | Marked lightcurve |
|---|---|---|---|---|---|---|---|
| A | 8728 | 5894 | 1 | 1 | 0.01% | 0.02% | 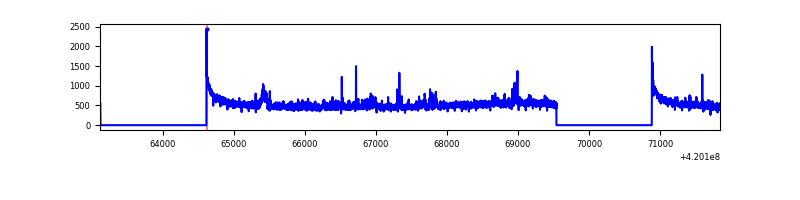 |
| B | 8728 | 5894 | 0 | 0 | 0.00% | 0.00% | 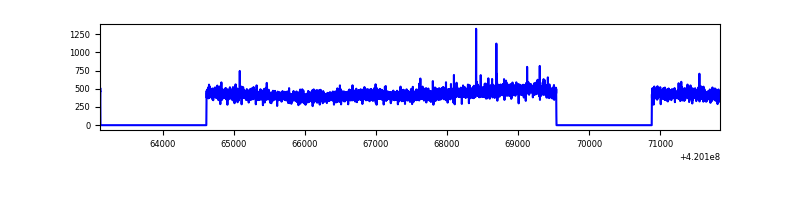 |
| C | 8728 | 5894 | 20 | 20 | 0.23% | 0.34% | 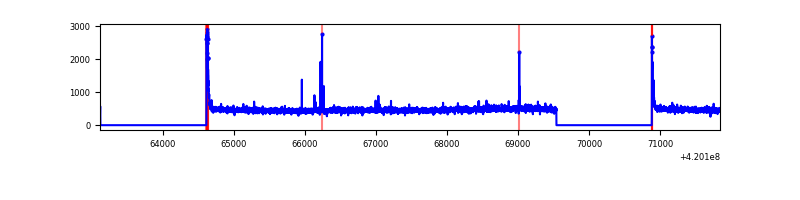 |
| D | 8728 | 5894 | 214 | 214 | 2.45% | 3.63% | 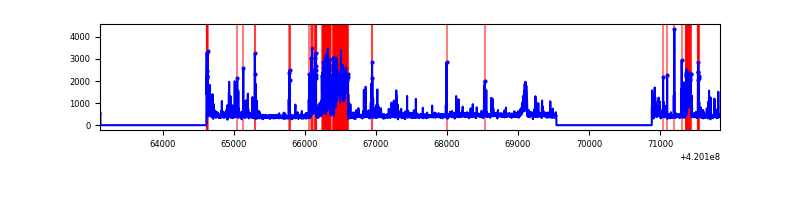 |
Top three noisy pixels from each quadrant. If the there are fewer than three noisy pixels in the level2.evt file, extra rows are filled as -1
| Pixel properties | Quadrant properties | ||||||
|---|---|---|---|---|---|---|---|
| Quadrant | DetID | PixID | Counts | Sigma | Mean | Median | Sigma |
| A | 10 | 83 | 522869 | 4006.91 | 637 | 624 | 130.3 |
| A | 12 | 189 | 159577 | 1219.56 | 637 | 624 | 130.3 |
| A | 10 | 255 | 14159 | 103.85 | 637 | 624 | 130.3 |
| B | 12 | 111 | 15710 | 122.05 | 633 | 615 | 123.7 |
| B | 11 | 111 | 14668 | 113.63 | 633 | 615 | 123.7 |
| B | 14 | 111 | 13934 | 107.69 | 633 | 615 | 123.7 |
| C | 15 | 214 | 272356 | 1858.42 | 624 | 626 | 146.2 |
| C | 0 | 10 | 87109 | 591.48 | 624 | 626 | 146.2 |
| C | 14 | 254 | 20692 | 137.24 | 624 | 626 | 146.2 |
| D | 13 | 249 | 925706 | 6294.86 | 602 | 586 | 147.0 |
| D | 2 | 249 | 166294 | 1127.54 | 602 | 586 | 147.0 |
| D | 13 | 171 | 55499 | 373.65 | 602 | 586 | 147.0 |
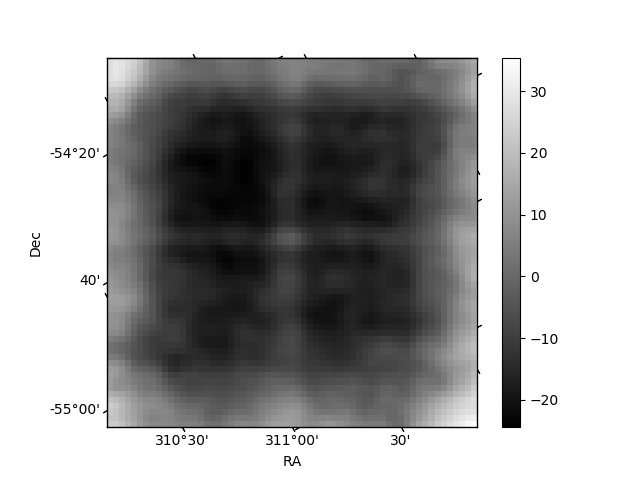
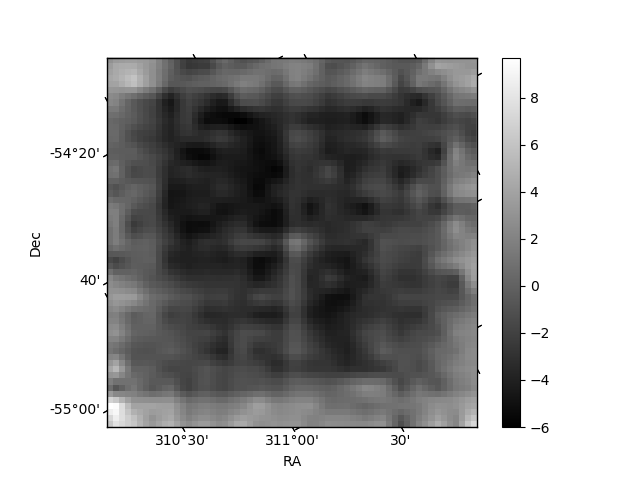
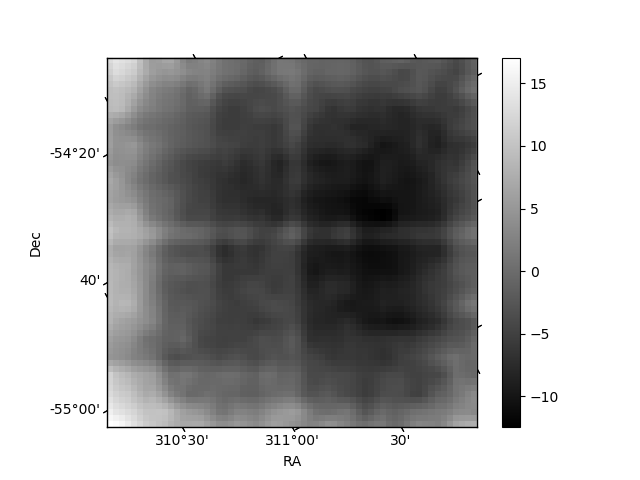
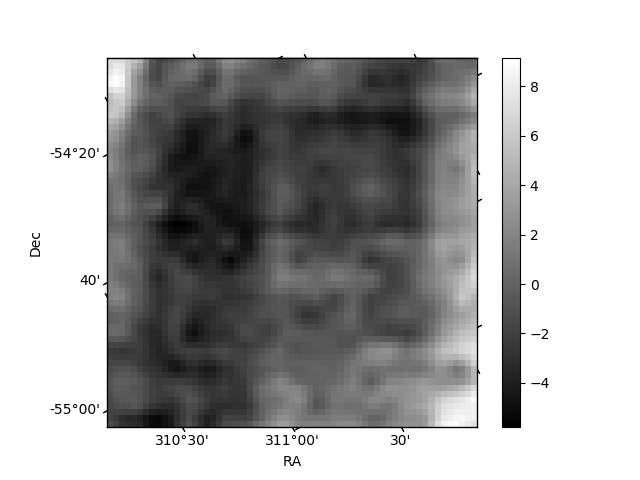
Histogram calculated using DETX and DETY for each event in the final _common_clean file
| Quadrant A | 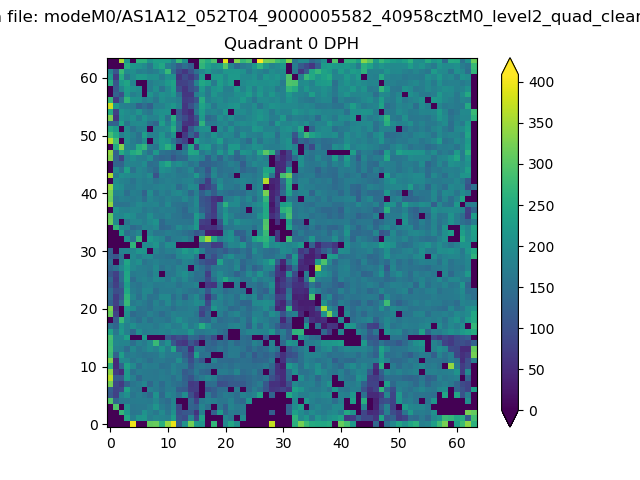 |
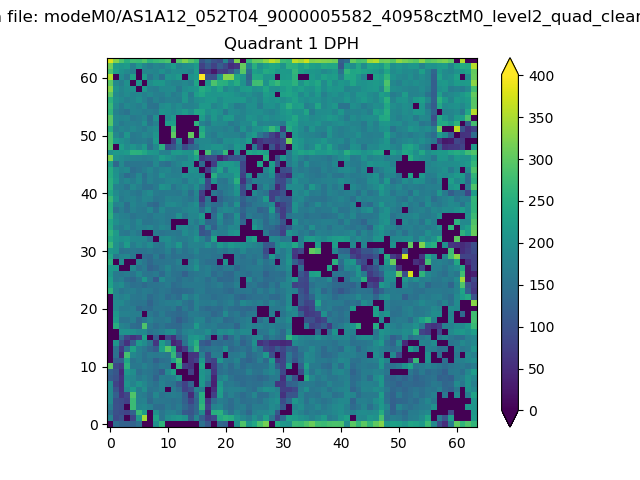 |
Quadrant B |
|---|---|---|---|
| Quadrant D | 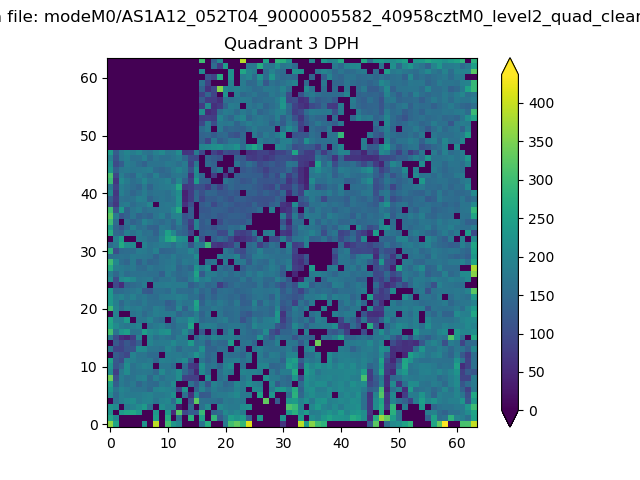 |
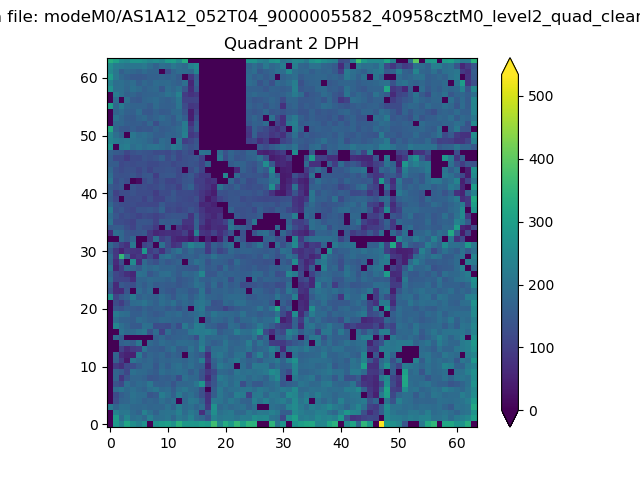 |
Quadrant C |
| Plot type | Count rate plots | Images |
|---|---|---|
| Comparison with Poisson distribution Blue bars denote a histogram of data divided into 1 sec bins. Red curve is a Poisson curve with rate = median count rate of data. |
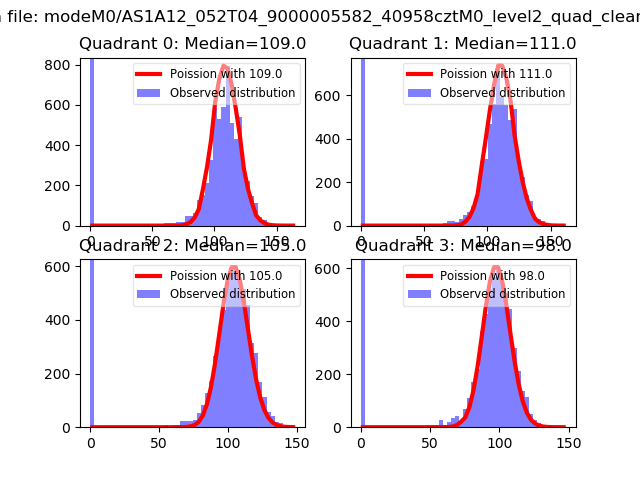 |
 |
| Quadrant-wise count rates Data is divided into 100 sec bins |
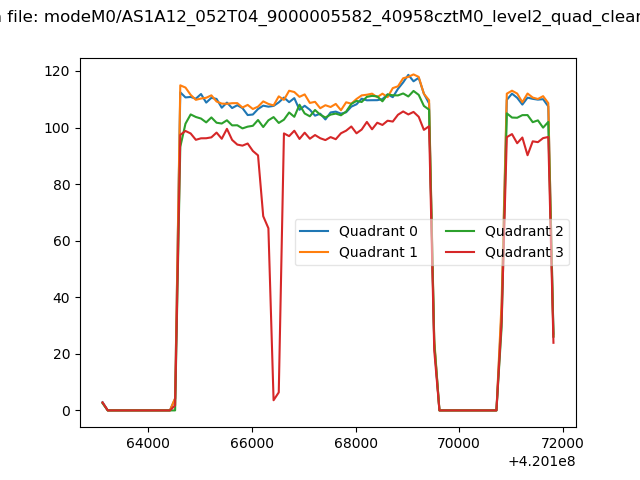 |
|
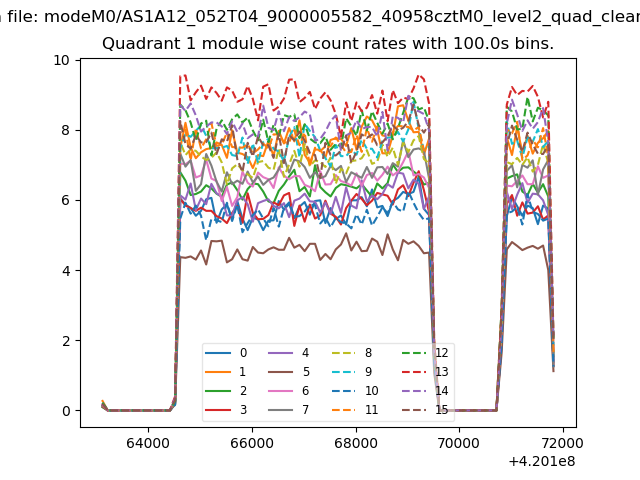
| Module-wise count rates for Quadrant A Data is divided into 100 sec bins |
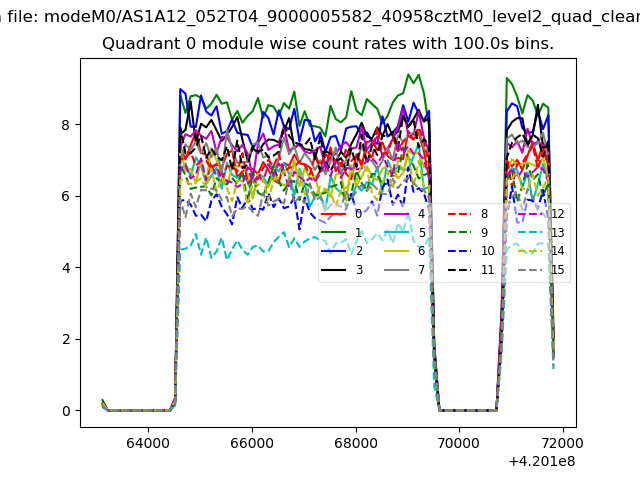 |
 |
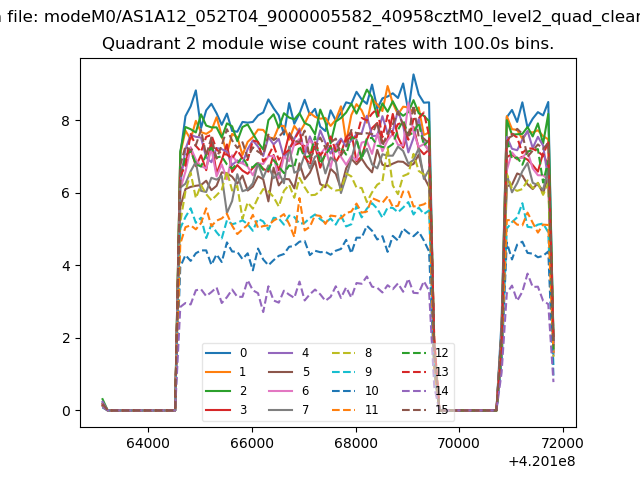
| Module-wise count rates for Quadrant B Data is divided into 100 sec bins |
 |
 |
| Module-wise count rates for Quadrant C Data is divided into 100 sec bins |
 |
 |
| Module-wise count rates for Quadrant D Data is divided into 100 sec bins |
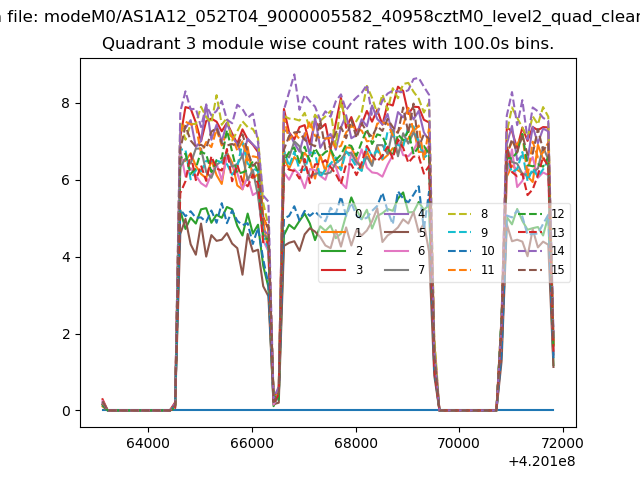 |
 |
| Parameter | Plot |
|---|---|
| CZT HV Monitor | 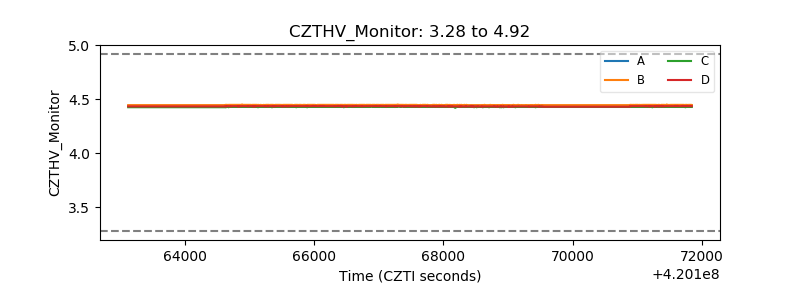 |
| D_VDD | 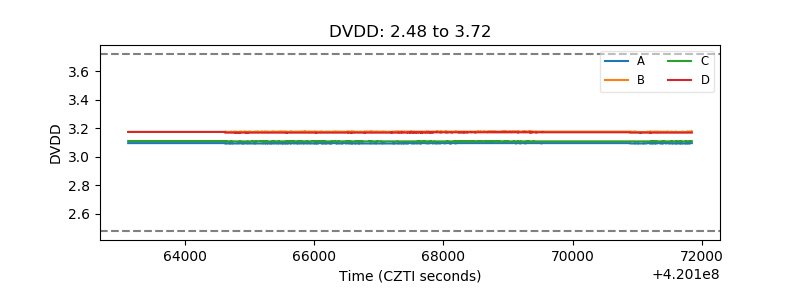 |
| Temperature 1 | 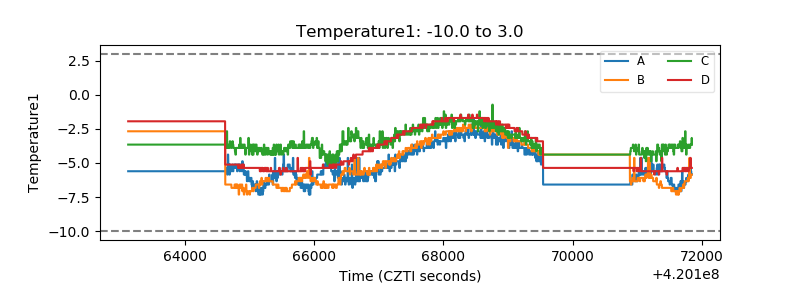 |
| Veto HV Monitor | 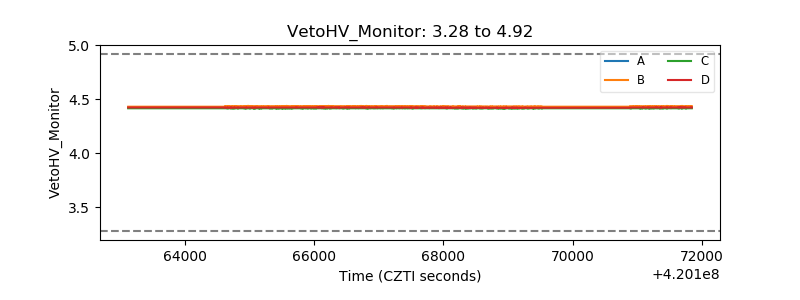 |
| Veto LLD | 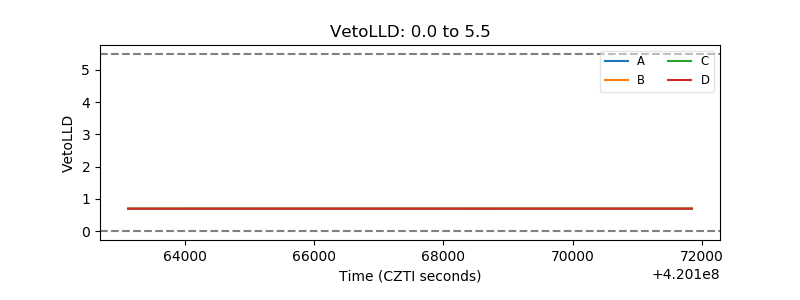 |
| Alpha Counter | 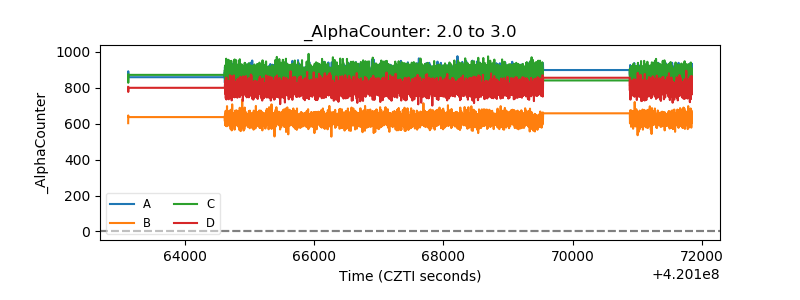 |
| _CPM_Rate | 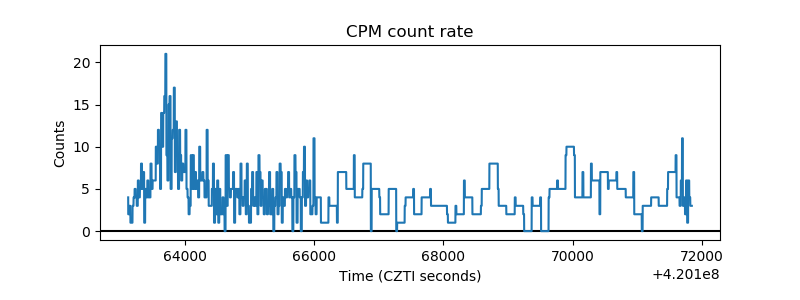 |
| CZT Counter | 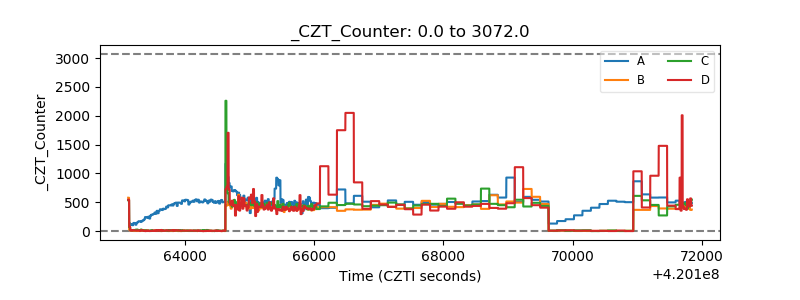 |
| +2.5 Volts monitor | 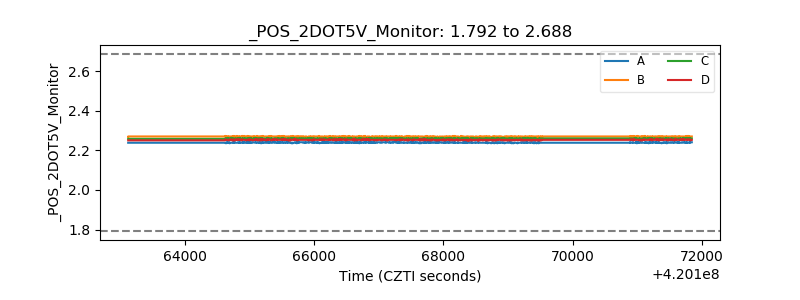 |
| +5 Volts monitor | 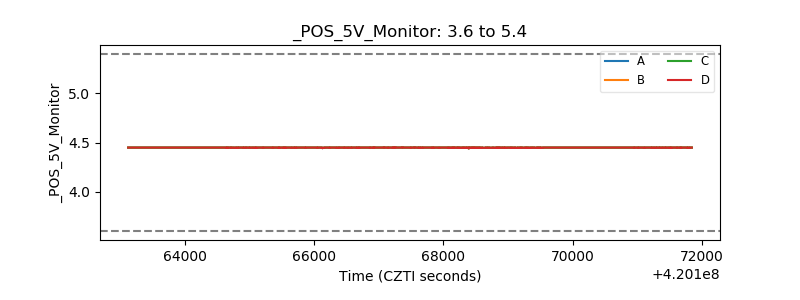 |
| _ROLL_ROT | 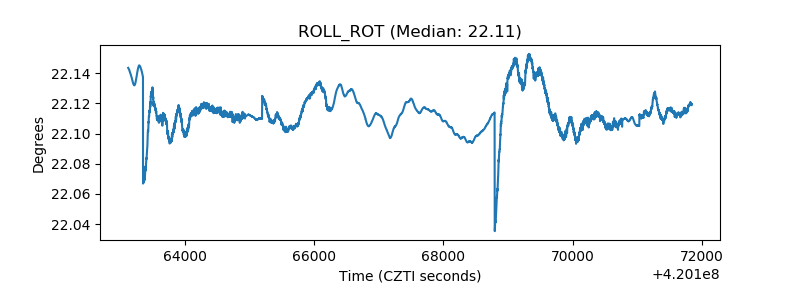 |
| _Roll_DEC | 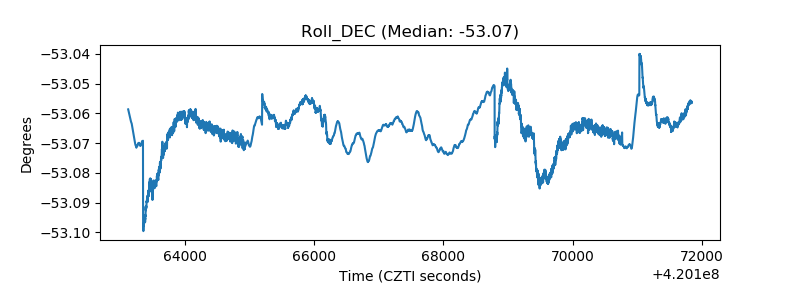 |
| _Roll_RA | 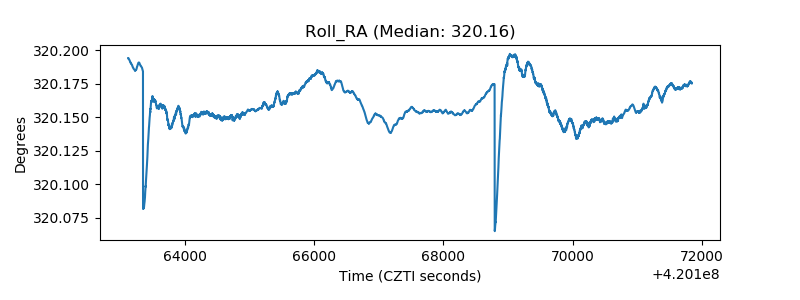 |
| Veto Counter | 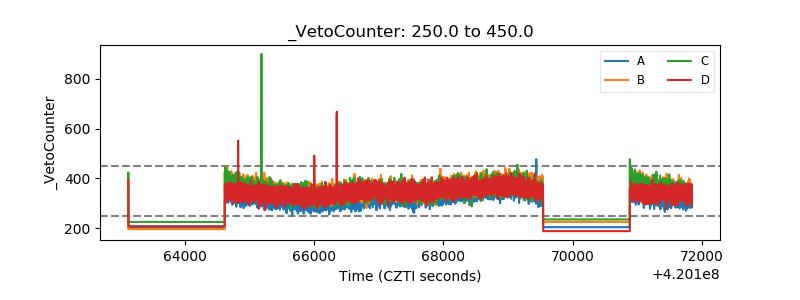 |