| Param | Original file | Final file |
|---|---|---|
| Filename | modeM0/AS1A12_052T04_9000005582_40962cztM0_level2.fits | modeM0/AS1A12_052T04_9000005582_40962cztM0_level2_quad_clean.evt |
| Size (bytes) | 1,118,266,560 | 309,775,680 |
| Size | 1.0 GB | 295.4 MB |
| Events in quadrant A | 10,744,007 | 2,063,968 |
| Events in quadrant B | 8,321,480 | 2,115,886 |
| Events in quadrant C | 9,645,607 | 2,025,119 |
| Events in quadrant D | 11,184,508 | 1,841,112 |
| Mode M9 | |||
|---|---|---|---|
| Quadrant | BADHDUFLAG | Total packets | Discarded packets |
| A | 0 | 64 | 0 |
| B | 0 | 63 | 0 |
| C | 0 | 63 | 0 |
| D | 0 | 64 | 0 |
| Mode SS | |||
|---|---|---|---|
| Quadrant | BADHDUFLAG | Total packets | Discarded packets |
| A | 0 | 396 | 0 |
| B | 0 | 396 | 0 |
| C | 0 | 396 | 0 |
| D | 0 | 396 | 0 |
| Mode M0 | |||
|---|---|---|---|
| Quadrant | BADHDUFLAG | Total packets | Discarded packets |
| A | 0 | 43698 | 4 |
| B | 0 | 38840 | 4 |
| C | 0 | 40993 | 4 |
| D | 0 | 47354 | 4 |
| Quadrant | Total seconds | Saturated seconds | Saturation percentage |
|---|---|---|---|
| A | 19350 | 79 | 0.408269% |
| B | 19350 | 24 | 0.124031% |
| C | 19350 | 106 | 0.547804% |
| D | 19350 | 578 | 2.987080% |
Noise dominated data is calculated using 1-second bins in cleaned event files. If a bin has >2000 counts, and if more than 50% of those come from <1% of pixels, then it is considered to be noise-dominated and hence unusable.
| Quadrant | # 1 sec bins | Bins with >0 counts | Bins with >2000 counts | High rate bins dominated by noise | Noise dominated (total time) | Noise dominated (detector-on time) | Marked lightcurve |
|---|---|---|---|---|---|---|---|
| A | 23498 | 19353 | 42 | 42 | 0.18% | 0.22% | 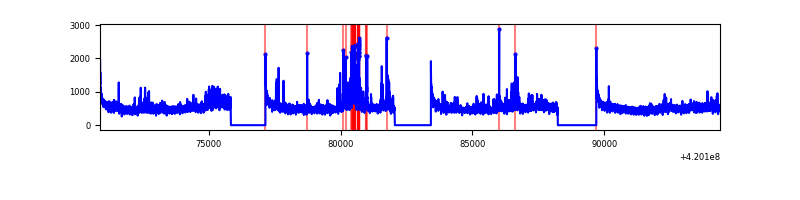 |
| B | 23498 | 19353 | 0 | 0 | 0.00% | 0.00% | 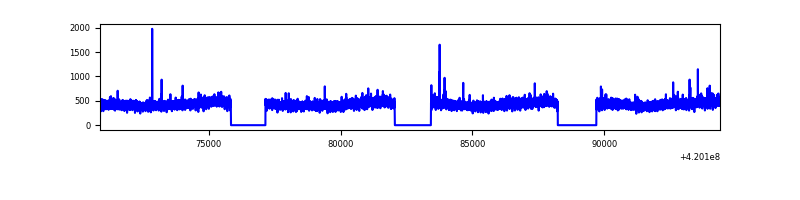 |
| C | 23498 | 19353 | 91 | 91 | 0.39% | 0.47% | 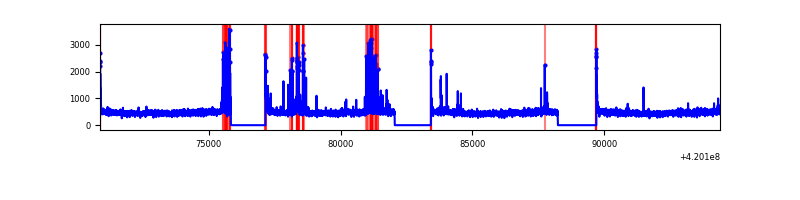 |
| D | 23498 | 19353 | 531 | 531 | 2.26% | 2.74% | 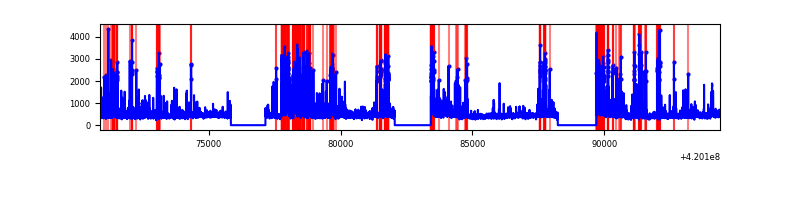 |
Top three noisy pixels from each quadrant. If the there are fewer than three noisy pixels in the level2.evt file, extra rows are filled as -1
| Pixel properties | Quadrant properties | ||||||
|---|---|---|---|---|---|---|---|
| Quadrant | DetID | PixID | Counts | Sigma | Mean | Median | Sigma |
| A | 10 | 83 | 1515308 | 3515.91 | 2118 | 2073 | 430.4 |
| A | 12 | 189 | 1017409 | 2359.07 | 2118 | 2073 | 430.4 |
| A | 13 | 254 | 24659 | 52.48 | 2118 | 2073 | 430.4 |
| B | 12 | 111 | 52445 | 124.64 | 2090 | 2026 | 404.5 |
| B | 0 | 190 | 51249 | 121.68 | 2090 | 2026 | 404.5 |
| B | 11 | 111 | 49148 | 116.49 | 2090 | 2026 | 404.5 |
| C | 15 | 214 | 880833 | 1842.25 | 2056 | 2066 | 477.0 |
| C | 14 | 254 | 587785 | 1227.9 | 2056 | 2066 | 477.0 |
| C | 0 | 10 | 113346 | 233.29 | 2056 | 2066 | 477.0 |
| D | 2 | 249 | 1388005 | 2820.21 | 2043 | 1985 | 491.5 |
| D | 13 | 249 | 1179743 | 2396.45 | 2043 | 1985 | 491.5 |
| D | 12 | 233 | 468892 | 950.04 | 2043 | 1985 | 491.5 |
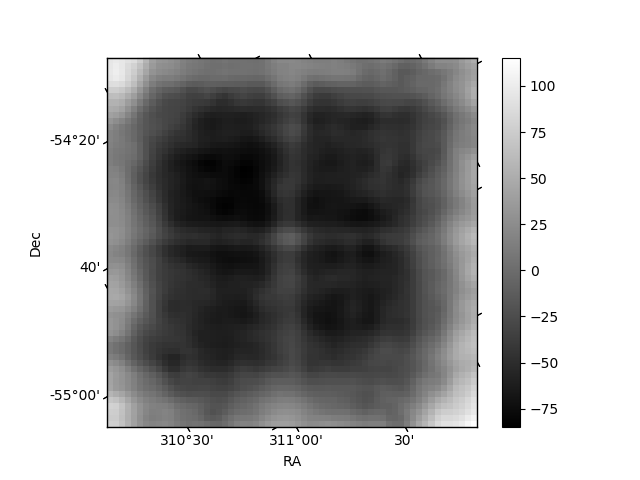
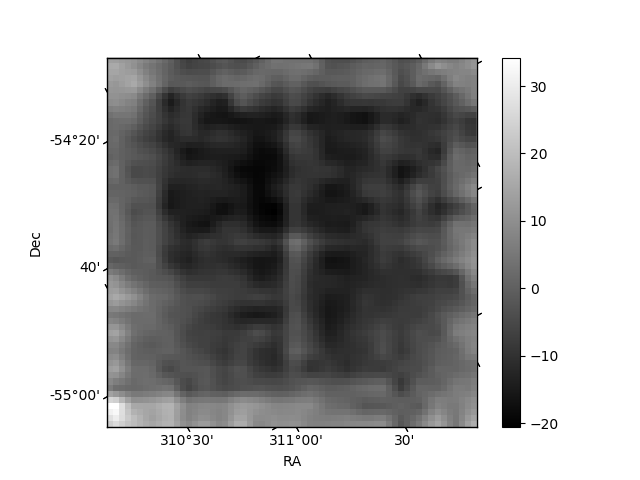
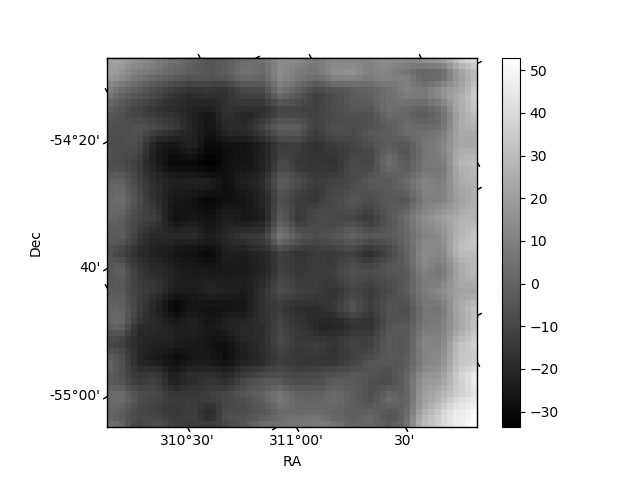
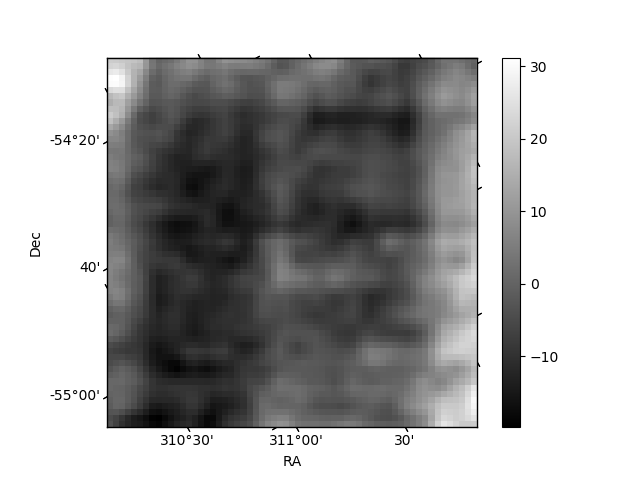
Histogram calculated using DETX and DETY for each event in the final _common_clean file
| Quadrant A | 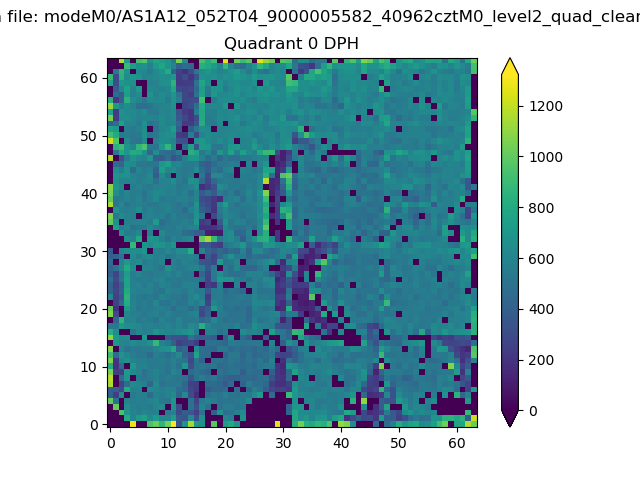 |
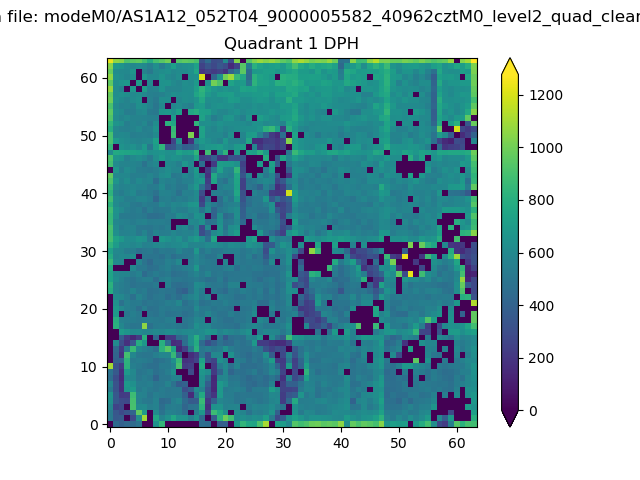 |
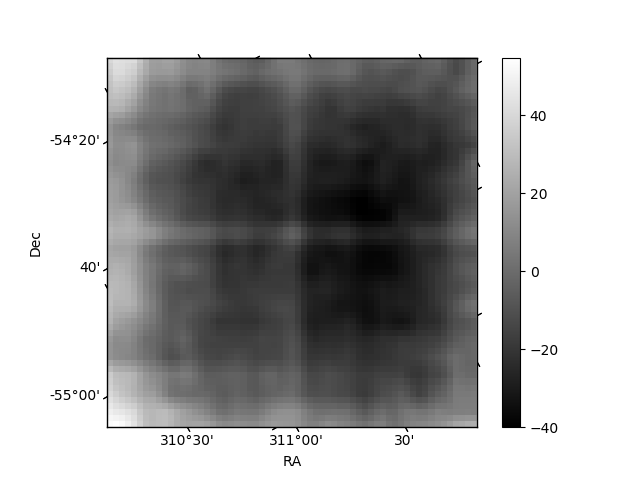
Quadrant B |
|---|---|---|---|
| Quadrant D | 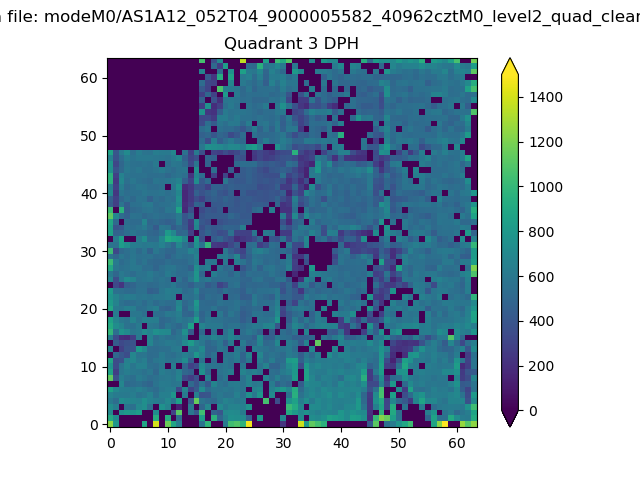 |
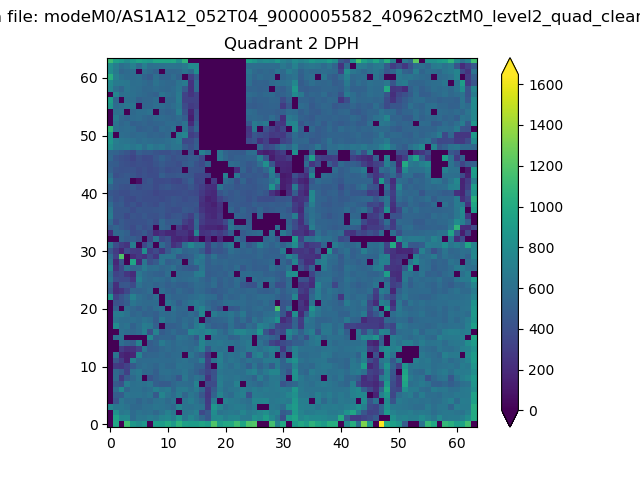 |
Quadrant C |
| Plot type | Count rate plots | Images |
|---|---|---|
| Comparison with Poisson distribution Blue bars denote a histogram of data divided into 1 sec bins. Red curve is a Poisson curve with rate = median count rate of data. |
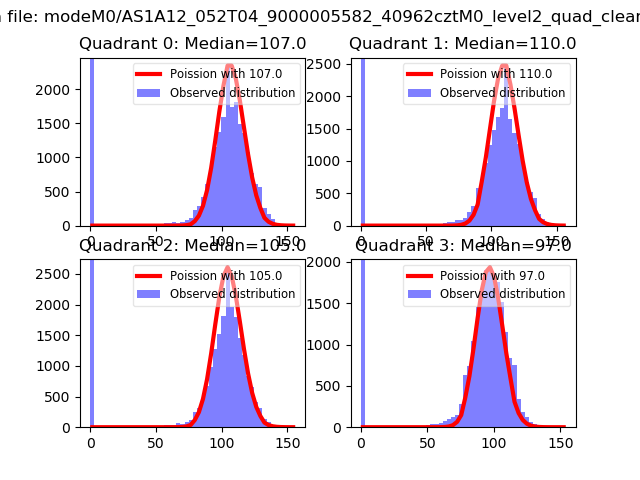 |
 |
| Quadrant-wise count rates Data is divided into 100 sec bins |
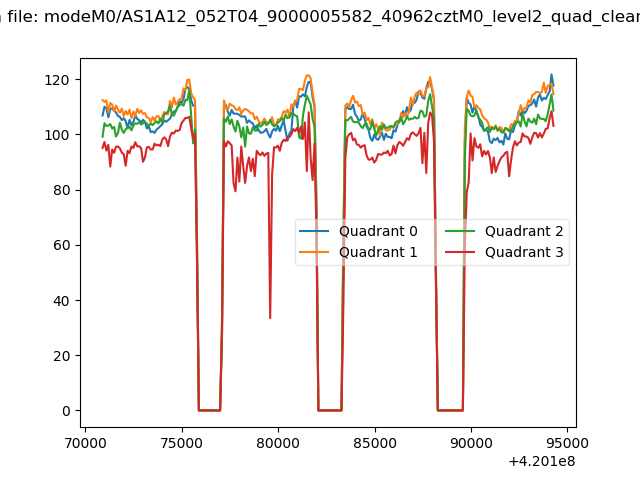 |
|
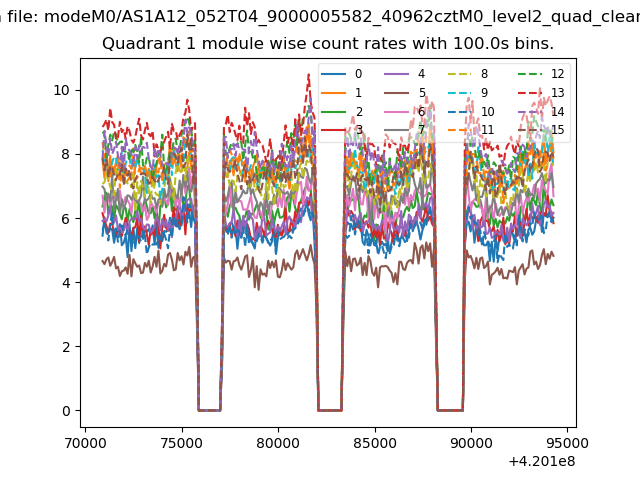
| Module-wise count rates for Quadrant A Data is divided into 100 sec bins |
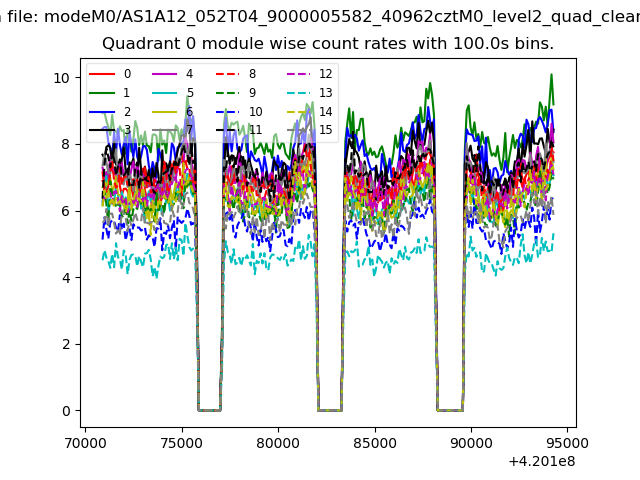 |
 |
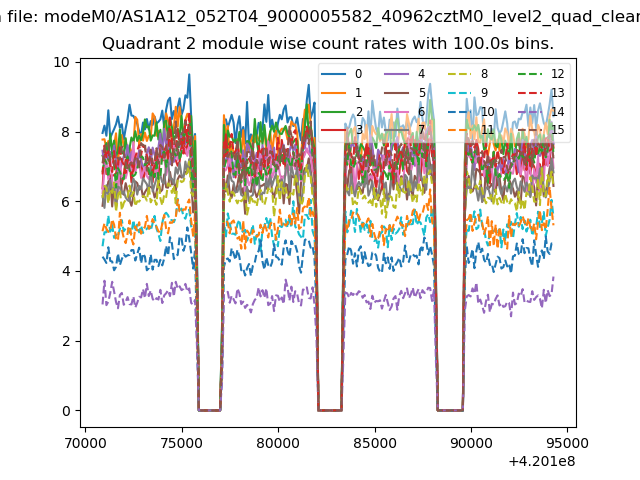
| Module-wise count rates for Quadrant B Data is divided into 100 sec bins |
 |
 |
| Module-wise count rates for Quadrant C Data is divided into 100 sec bins |
 |
 |
| Module-wise count rates for Quadrant D Data is divided into 100 sec bins |
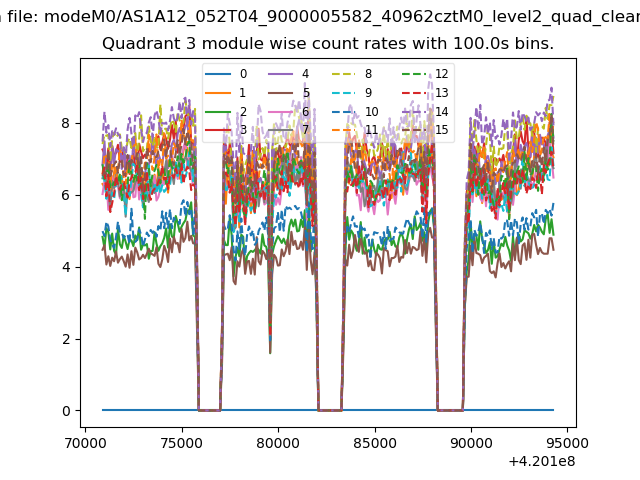 |
 |
| Parameter | Plot |
|---|---|
| CZT HV Monitor | 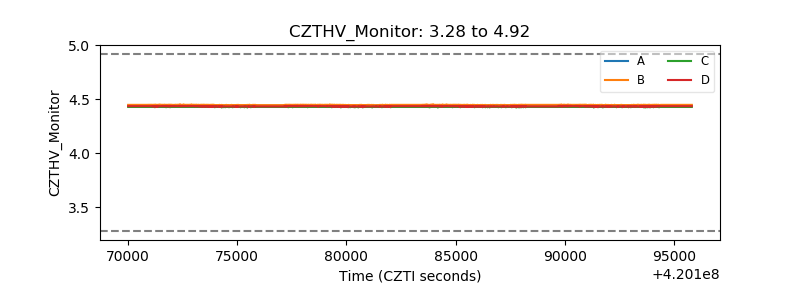 |
| D_VDD | 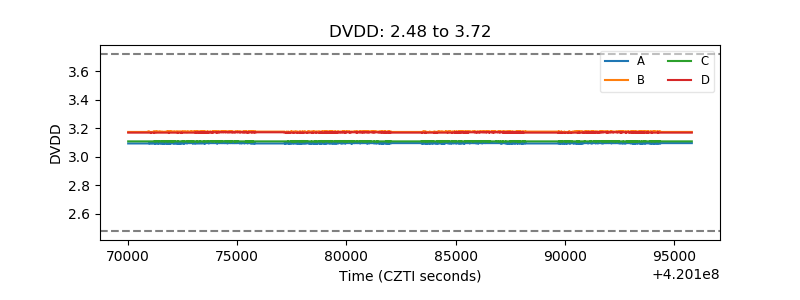 |
| Temperature 1 | 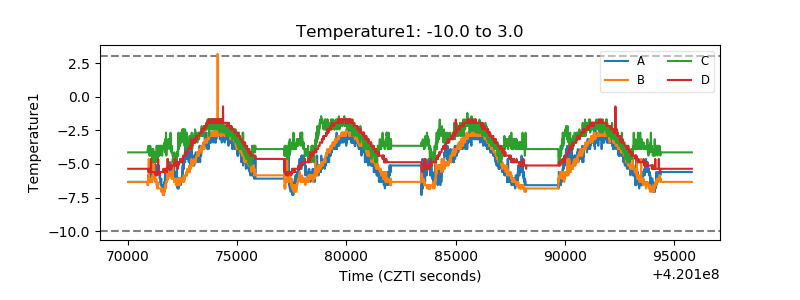 |
| Veto HV Monitor | 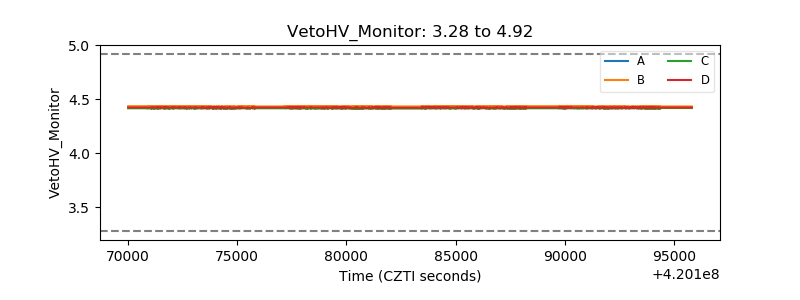 |
| Veto LLD | 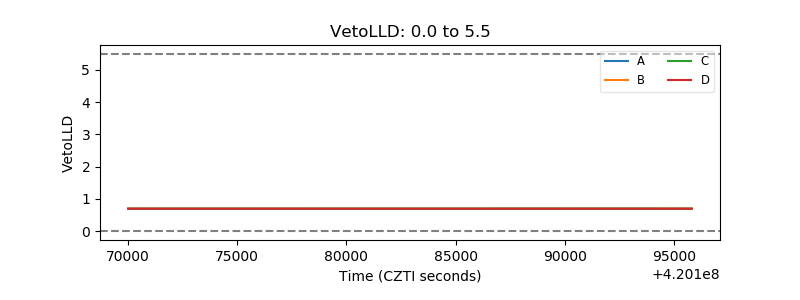 |
| Alpha Counter | 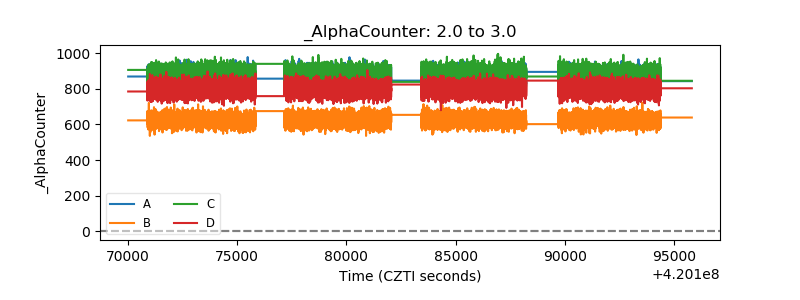 |
| _CPM_Rate | 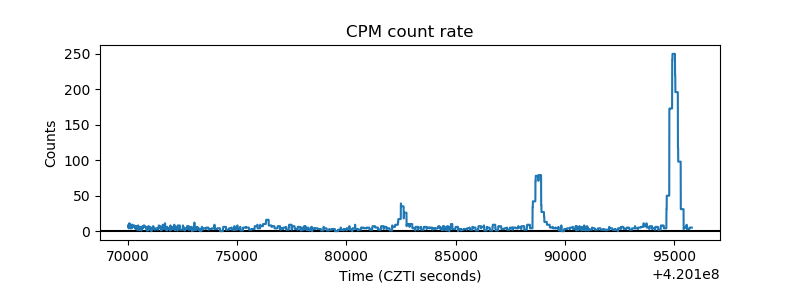 |
| CZT Counter | 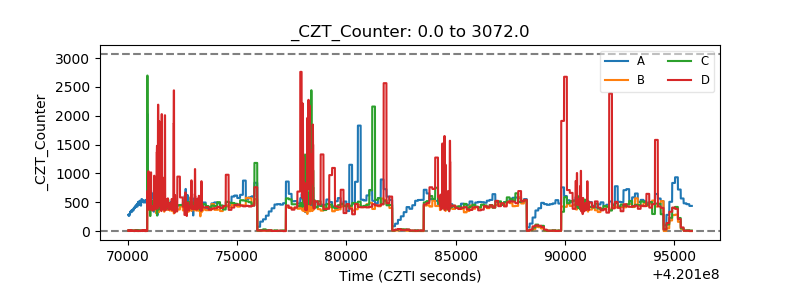 |
| +2.5 Volts monitor | 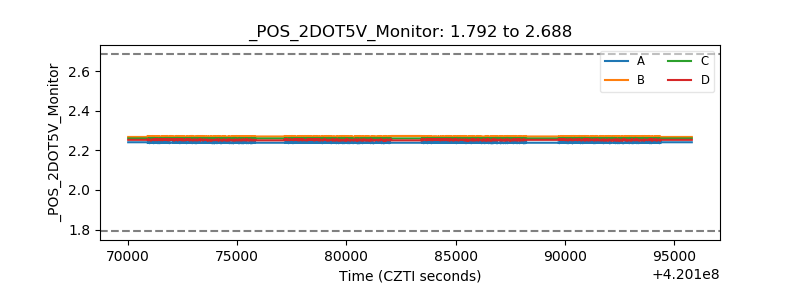 |
| +5 Volts monitor | 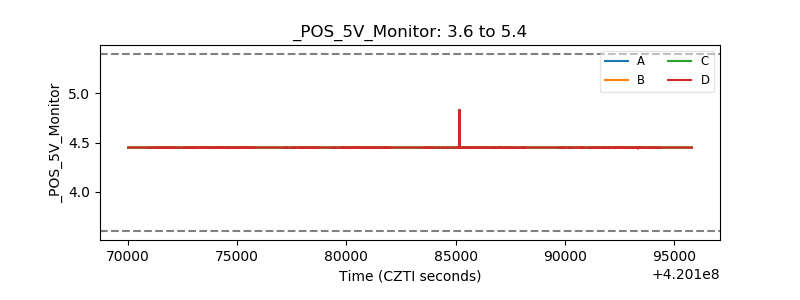 |
| _ROLL_ROT | 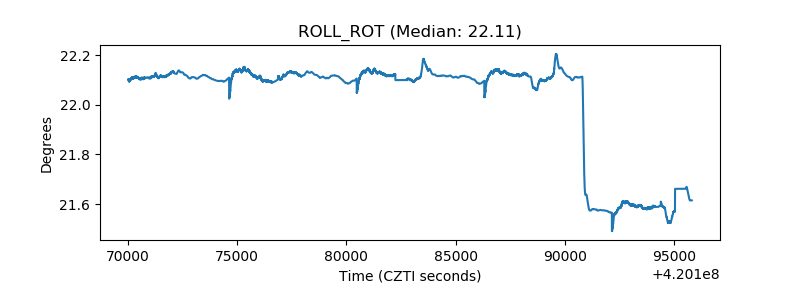 |
| _Roll_DEC | 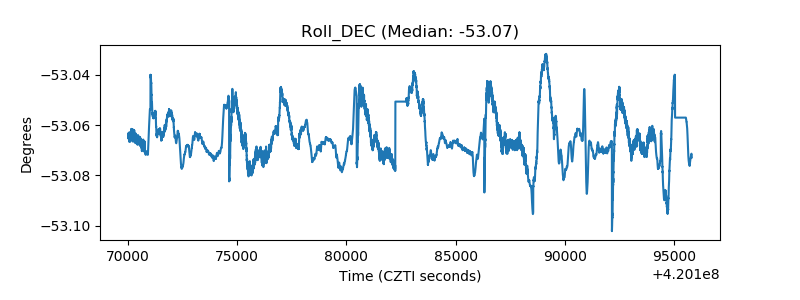 |
| _Roll_RA | 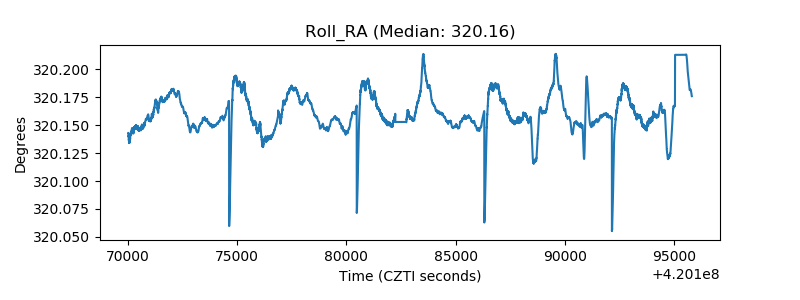 |
| Veto Counter | 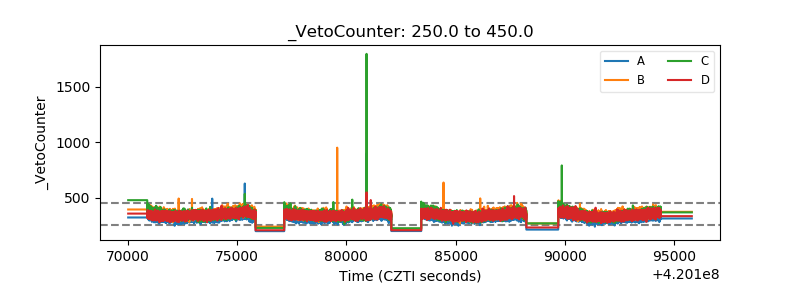 |