| Param | Original file | Final file |
|---|---|---|
| Filename | modeM0/AS1A12_052T04_9000005582_40963cztM0_level2.fits | modeM0/AS1A12_052T04_9000005582_40963cztM0_level2_quad_clean.evt |
| Size (bytes) | 317,992,320 | 93,553,920 |
| Size | 303.3 MB | 89.2 MB |
| Events in quadrant A | 3,029,177 | 625,089 |
| Events in quadrant B | 2,448,044 | 636,978 |
| Events in quadrant C | 2,724,670 | 612,593 |
| Events in quadrant D | 3,126,669 | 561,029 |
| Mode M9 | |||
|---|---|---|---|
| Quadrant | BADHDUFLAG | Total packets | Discarded packets |
| A | 0 | 24 | 0 |
| B | 0 | 24 | 0 |
| C | 0 | 24 | 0 |
| D | 0 | 25 | 0 |
| Mode SS | |||
|---|---|---|---|
| Quadrant | BADHDUFLAG | Total packets | Discarded packets |
| A | 0 | 116 | 0 |
| B | 0 | 116 | 0 |
| C | 0 | 116 | 0 |
| D | 0 | 116 | 0 |
| Mode M0 | |||
|---|---|---|---|
| Quadrant | BADHDUFLAG | Total packets | Discarded packets |
| A | 0 | 12397 | 3 |
| B | 0 | 11379 | 2 |
| C | 0 | 11764 | 2 |
| D | 0 | 13374 | 2 |
| Quadrant | Total seconds | Saturated seconds | Saturation percentage |
|---|---|---|---|
| A | 5676 | 12 | 0.211416% |
| B | 5676 | 3 | 0.052854% |
| C | 5676 | 18 | 0.317125% |
| D | 5676 | 119 | 2.096547% |
Noise dominated data is calculated using 1-second bins in cleaned event files. If a bin has >2000 counts, and if more than 50% of those come from <1% of pixels, then it is considered to be noise-dominated and hence unusable.
| Quadrant | # 1 sec bins | Bins with >0 counts | Bins with >2000 counts | High rate bins dominated by noise | Noise dominated (total time) | Noise dominated (detector-on time) | Marked lightcurve |
|---|---|---|---|---|---|---|---|
| A | 7380 | 5677 | 2 | 2 | 0.03% | 0.04% | 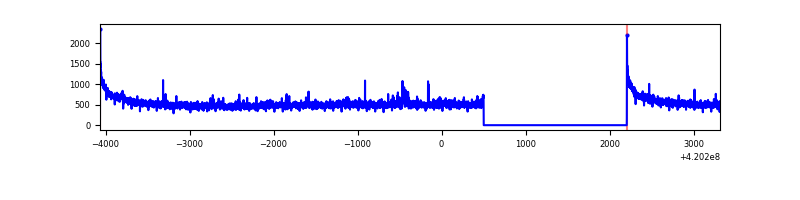 |
| B | 7380 | 5677 | 0 | 0 | 0.00% | 0.00% | 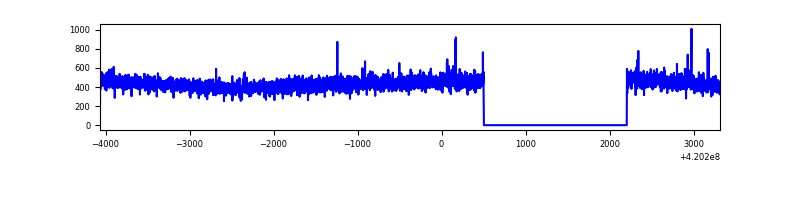 |
| C | 7380 | 5677 | 18 | 18 | 0.24% | 0.32% | 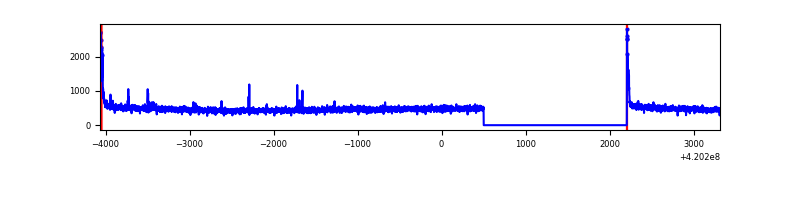 |
| D | 7380 | 5677 | 99 | 99 | 1.34% | 1.74% | 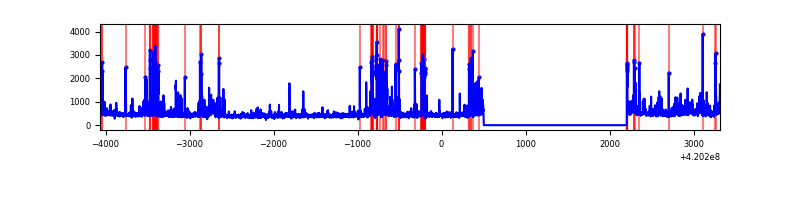 |
Top three noisy pixels from each quadrant. If the there are fewer than three noisy pixels in the level2.evt file, extra rows are filled as -1
| Pixel properties | Quadrant properties | ||||||
|---|---|---|---|---|---|---|---|
| Quadrant | DetID | PixID | Counts | Sigma | Mean | Median | Sigma |
| A | 10 | 83 | 518157 | 4024.3 | 626 | 611 | 128.6 |
| A | 12 | 189 | 71140 | 548.41 | 626 | 611 | 128.6 |
| A | 2 | 79 | 15669 | 117.09 | 626 | 611 | 128.6 |
| B | 12 | 111 | 15188 | 122.56 | 617 | 599 | 119.0 |
| B | 11 | 111 | 14268 | 114.83 | 617 | 599 | 119.0 |
| B | 14 | 111 | 13792 | 110.83 | 617 | 599 | 119.0 |
| C | 15 | 214 | 248102 | 1731.88 | 606 | 609 | 142.9 |
| C | 0 | 10 | 94890 | 659.75 | 606 | 609 | 142.9 |
| C | 12 | 249 | 15861 | 106.73 | 606 | 609 | 142.9 |
| D | 13 | 249 | 327483 | 2229.15 | 606 | 588 | 146.6 |
| D | 2 | 249 | 209900 | 1427.33 | 606 | 588 | 146.6 |
| D | 12 | 217 | 92440 | 626.35 | 606 | 588 | 146.6 |
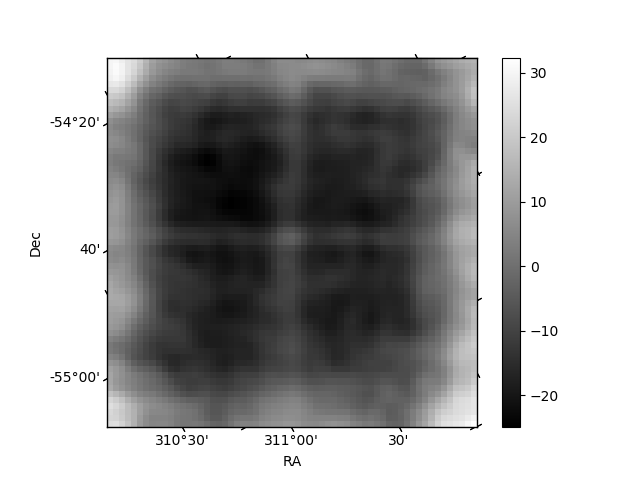
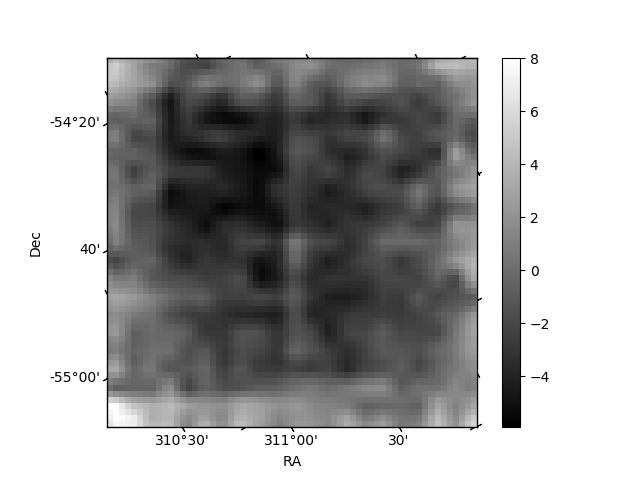
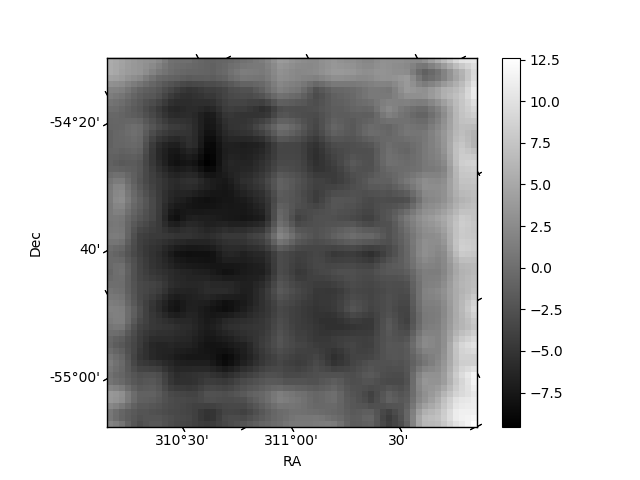
Histogram calculated using DETX and DETY for each event in the final _common_clean file
| Quadrant A | 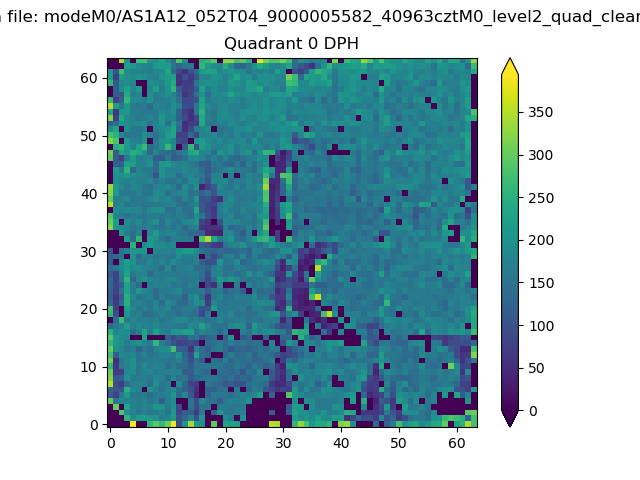 |
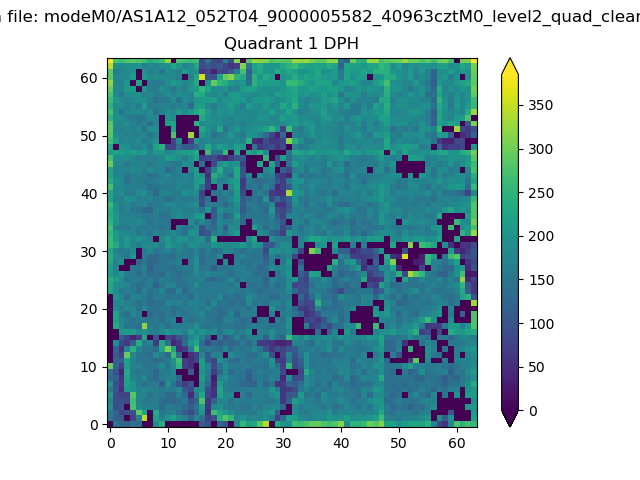 |
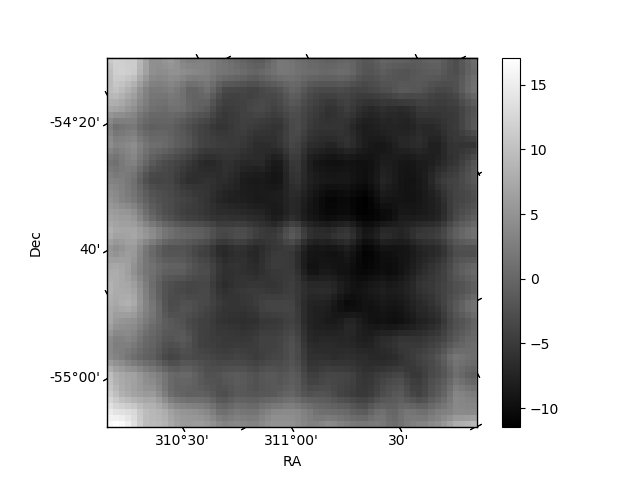
Quadrant B |
|---|---|---|---|
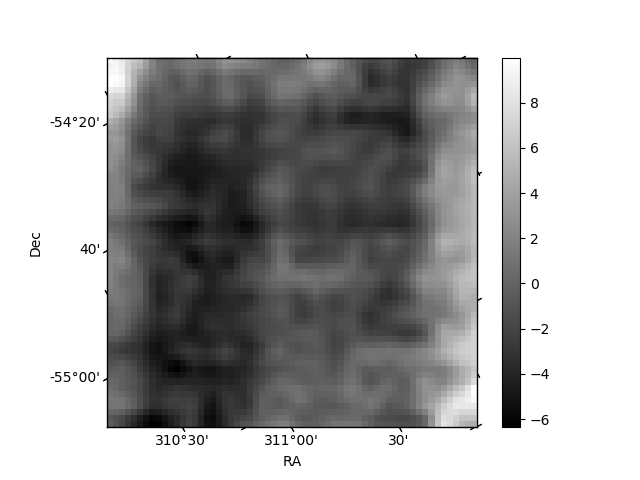
| Quadrant D | 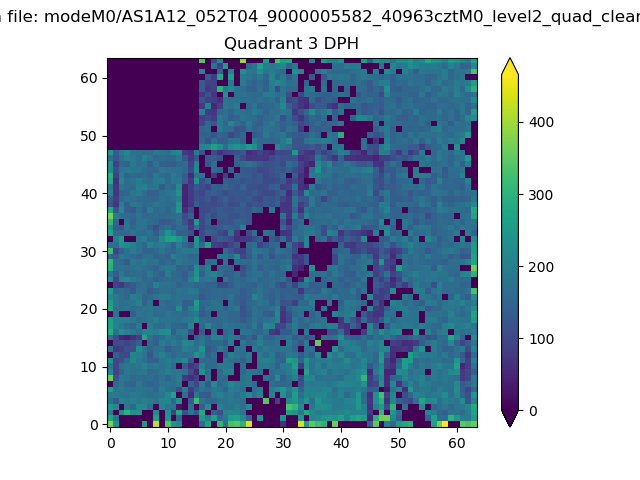 |
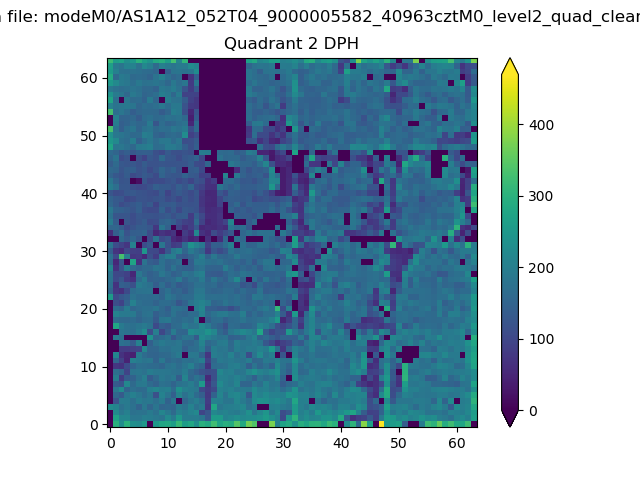 |
Quadrant C |
| Plot type | Count rate plots | Images |
|---|---|---|
| Comparison with Poisson distribution Blue bars denote a histogram of data divided into 1 sec bins. Red curve is a Poisson curve with rate = median count rate of data. |
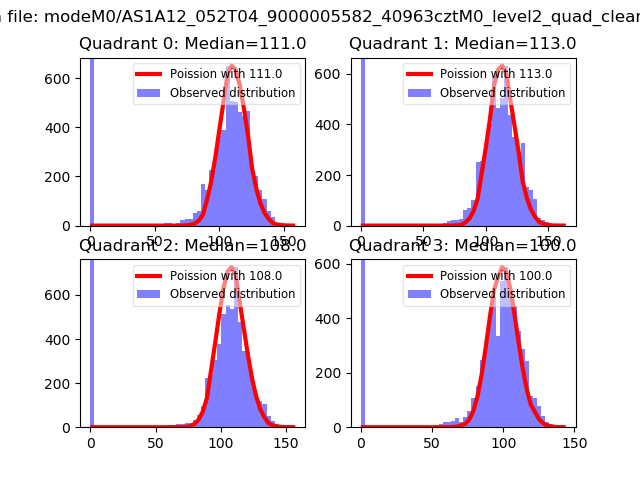 |
 |
| Quadrant-wise count rates Data is divided into 100 sec bins |
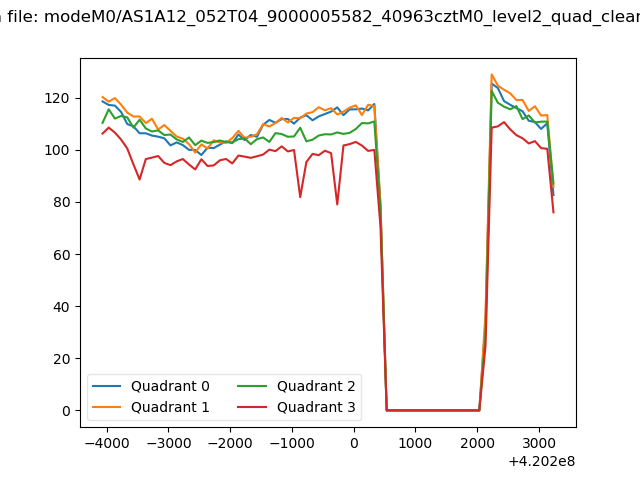 |
|
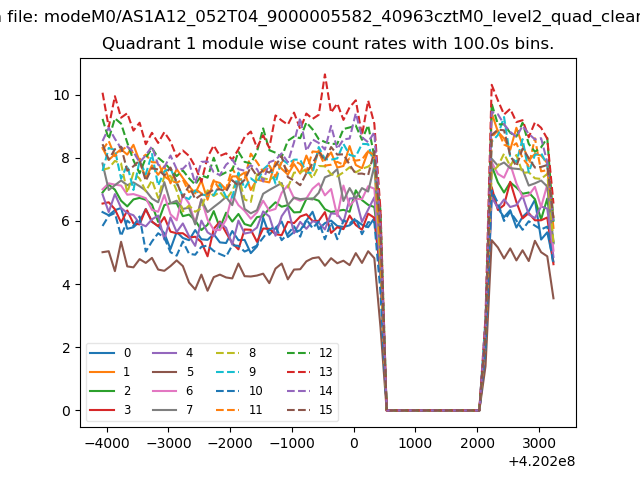
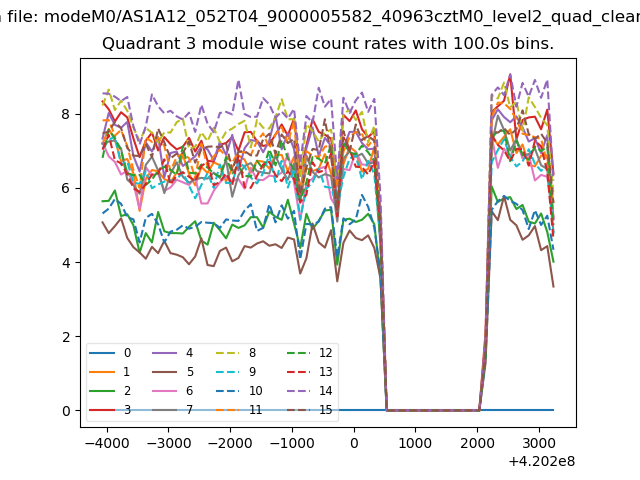
| Module-wise count rates for Quadrant A Data is divided into 100 sec bins |
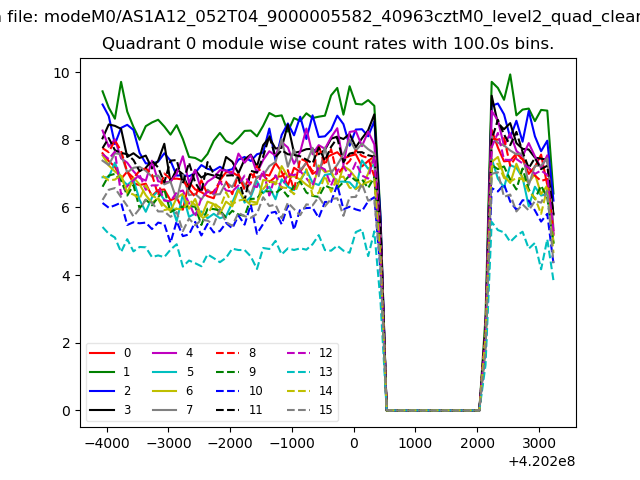 |
 |
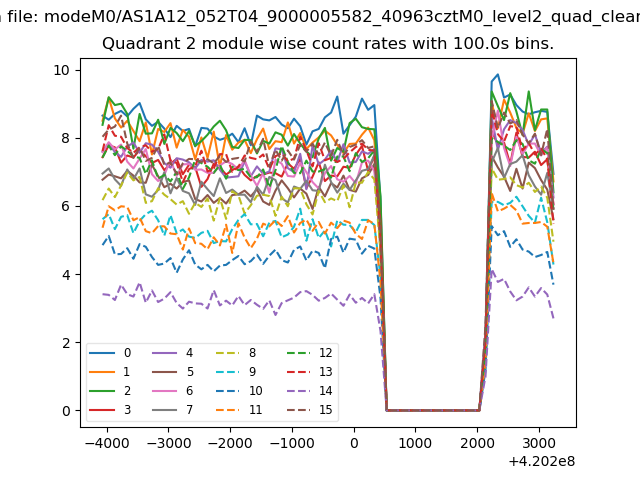
| Module-wise count rates for Quadrant B Data is divided into 100 sec bins |
 |
 |
| Module-wise count rates for Quadrant C Data is divided into 100 sec bins |
 |
 |
| Module-wise count rates for Quadrant D Data is divided into 100 sec bins |
 |
 |
| Parameter | Plot |
|---|---|
| CZT HV Monitor | 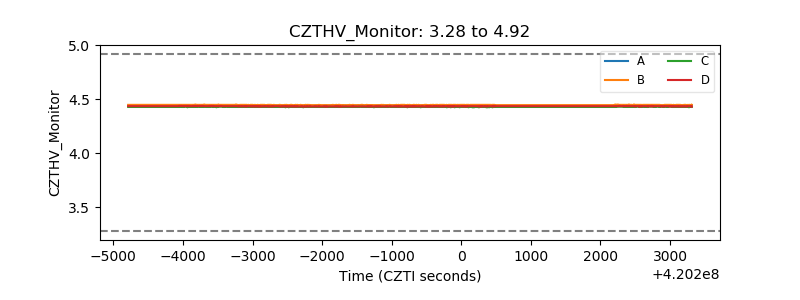 |
| D_VDD | 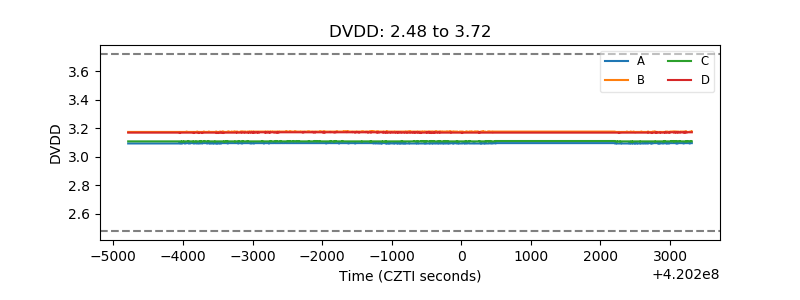 |
| Temperature 1 | 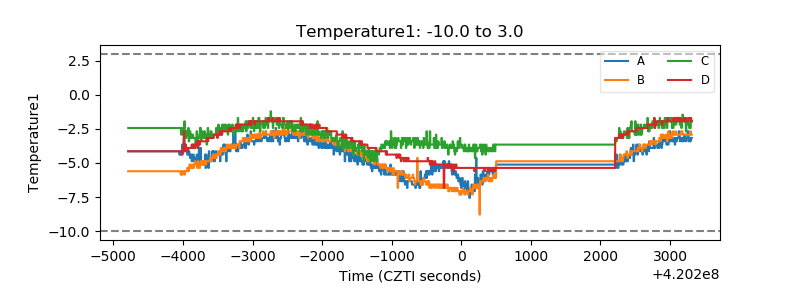 |
| Veto HV Monitor | 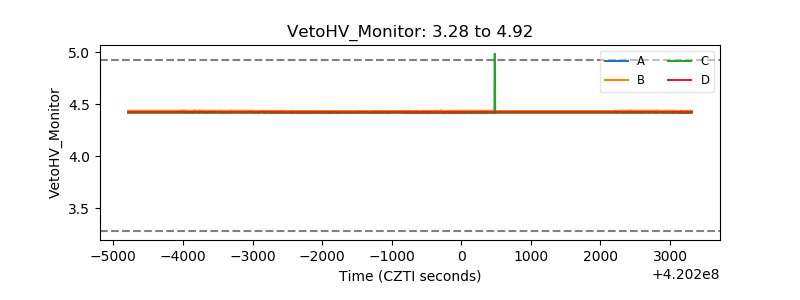 |
| Veto LLD | 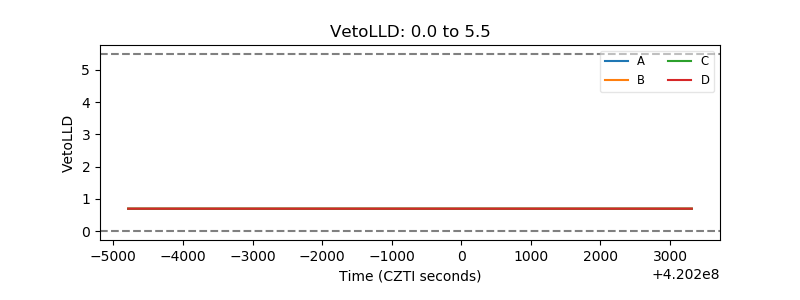 |
| Alpha Counter | 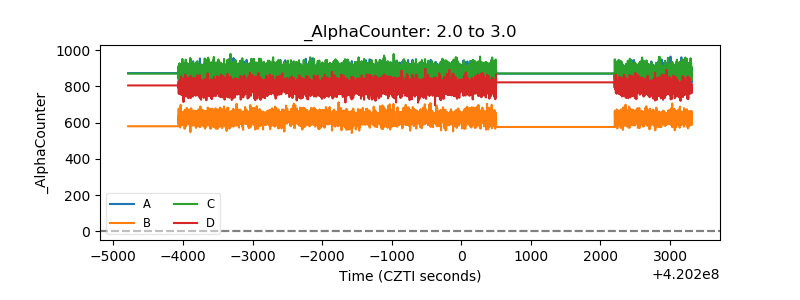 |
| _CPM_Rate | 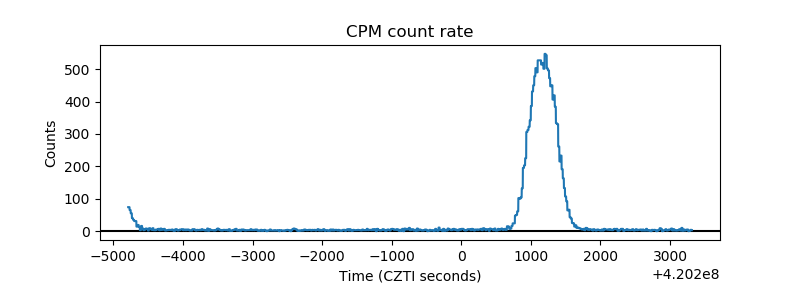 |
| CZT Counter | 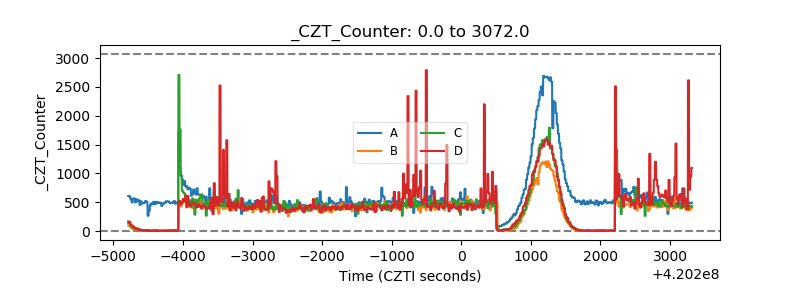 |
| +2.5 Volts monitor | 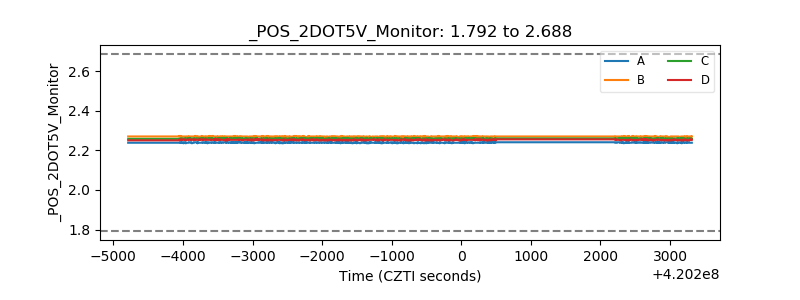 |
| +5 Volts monitor | 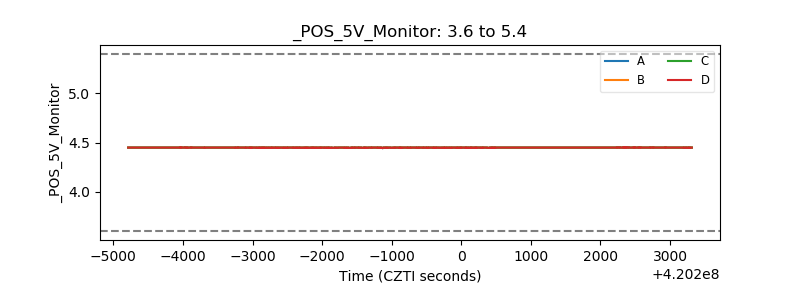 |
| _ROLL_ROT | 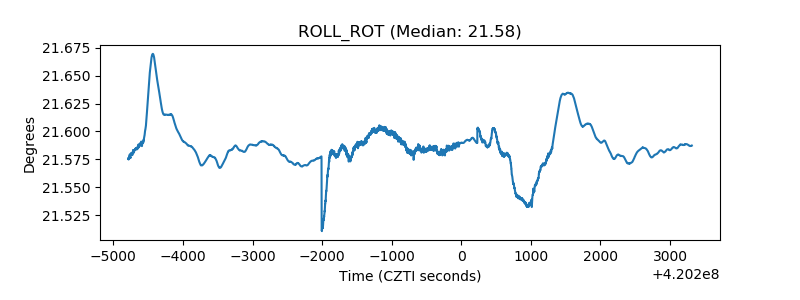 |
| _Roll_DEC | 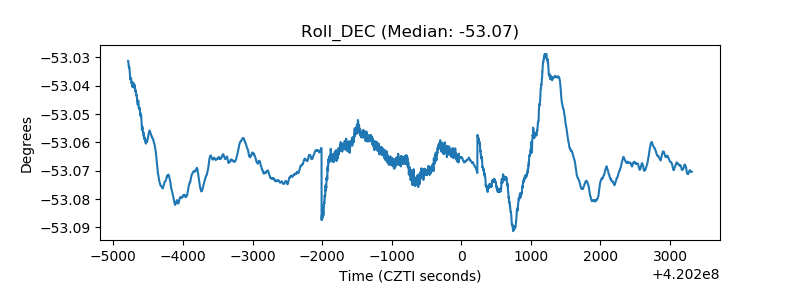 |
| _Roll_RA | 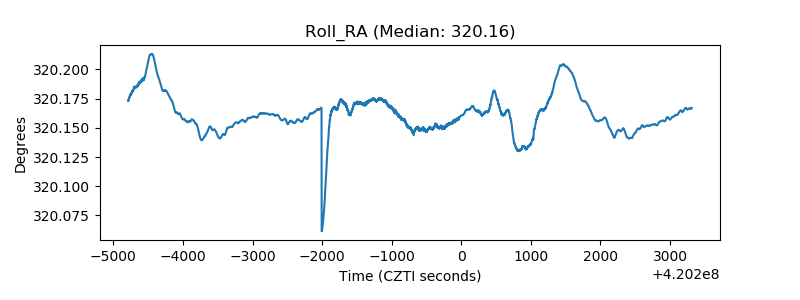 |
| Veto Counter | 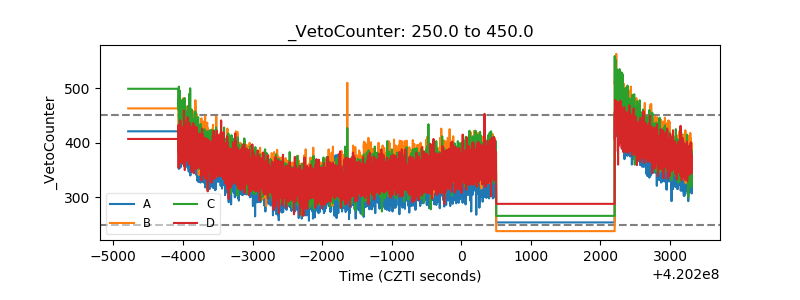 |