| Param | Original file | Final file |
|---|---|---|
| Filename | modeM0/AS1A12_052T04_9000005582_40965cztM0_level2.fits | modeM0/AS1A12_052T04_9000005582_40965cztM0_level2_quad_clean.evt |
| Size (bytes) | 276,166,080 | 87,024,960 |
| Size | 263.4 MB | 83.0 MB |
| Events in quadrant A | 2,660,592 | 583,976 |
| Events in quadrant B | 2,233,426 | 595,090 |
| Events in quadrant C | 2,411,665 | 567,533 |
| Events in quadrant D | 2,518,073 | 530,094 |
| Mode M9 | |||
|---|---|---|---|
| Quadrant | BADHDUFLAG | Total packets | Discarded packets |
| A | 0 | 18 | 0 |
| B | 0 | 18 | 0 |
| C | 0 | 18 | 0 |
| D | 0 | 18 | 0 |
| Mode SS | |||
|---|---|---|---|
| Quadrant | BADHDUFLAG | Total packets | Discarded packets |
| A | 0 | 106 | 0 |
| B | 0 | 106 | 0 |
| C | 0 | 106 | 0 |
| D | 0 | 106 | 0 |
| Mode M0 | |||
|---|---|---|---|
| Quadrant | BADHDUFLAG | Total packets | Discarded packets |
| A | 0 | 10927 | 2 |
| B | 0 | 10272 | 1 |
| C | 0 | 10418 | 1 |
| D | 0 | 11153 | 1 |
| Quadrant | Total seconds | Saturated seconds | Saturation percentage |
|---|---|---|---|
| A | 5111 | 6 | 0.117394% |
| B | 5111 | 5 | 0.097828% |
| C | 5111 | 12 | 0.234788% |
| D | 5111 | 34 | 0.665232% |
Noise dominated data is calculated using 1-second bins in cleaned event files. If a bin has >2000 counts, and if more than 50% of those come from <1% of pixels, then it is considered to be noise-dominated and hence unusable.
| Quadrant | # 1 sec bins | Bins with >0 counts | Bins with >2000 counts | High rate bins dominated by noise | Noise dominated (total time) | Noise dominated (detector-on time) | Marked lightcurve |
|---|---|---|---|---|---|---|---|
| A | 6933 | 5112 | 2 | 2 | 0.03% | 0.04% | 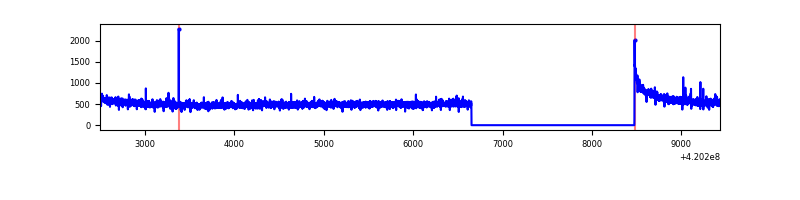 |
| B | 6933 | 5112 | 0 | 0 | 0.00% | 0.00% | 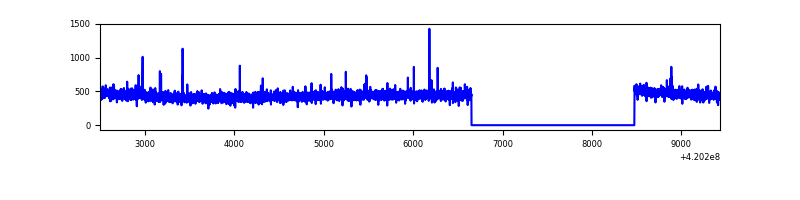 |
| C | 6933 | 5112 | 7 | 7 | 0.10% | 0.14% | 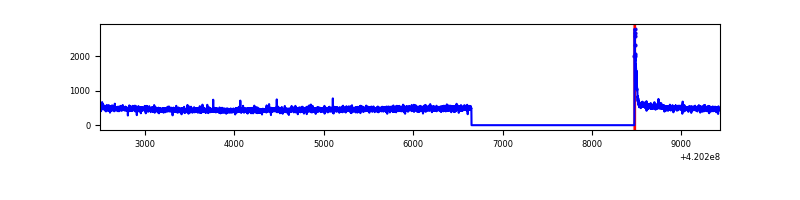 |
| D | 6933 | 5112 | 25 | 25 | 0.36% | 0.49% | 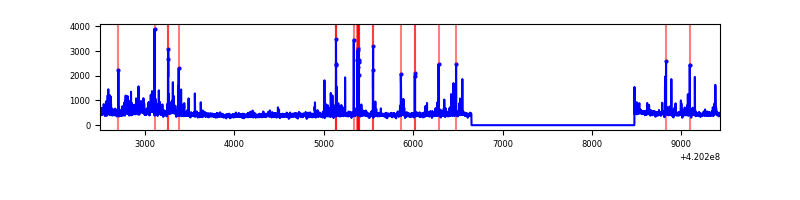 |
Top three noisy pixels from each quadrant. If the there are fewer than three noisy pixels in the level2.evt file, extra rows are filled as -1
| Pixel properties | Quadrant properties | ||||||
|---|---|---|---|---|---|---|---|
| Quadrant | DetID | PixID | Counts | Sigma | Mean | Median | Sigma |
| A | 10 | 83 | 406675 | 3451.17 | 572 | 560 | 117.7 |
| A | 2 | 79 | 29854 | 248.94 | 572 | 560 | 117.7 |
| A | 12 | 189 | 10991 | 88.64 | 572 | 560 | 117.7 |
| B | 12 | 111 | 13691 | 120.2 | 564 | 548 | 109.3 |
| B | 11 | 111 | 12667 | 110.84 | 564 | 548 | 109.3 |
| B | 14 | 111 | 12139 | 106.01 | 564 | 548 | 109.3 |
| C | 15 | 214 | 218041 | 1704.64 | 550 | 552 | 127.6 |
| C | 0 | 10 | 44195 | 342.06 | 550 | 552 | 127.6 |
| C | 14 | 254 | 4724 | 32.7 | 550 | 552 | 127.6 |
| D | 2 | 249 | 99954 | 731.03 | 555 | 539 | 136.0 |
| D | 12 | 217 | 99671 | 728.95 | 555 | 539 | 136.0 |
| D | 13 | 171 | 76800 | 560.77 | 555 | 539 | 136.0 |
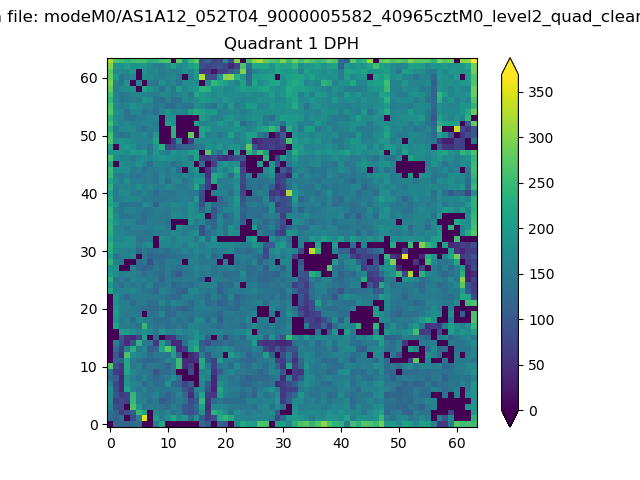
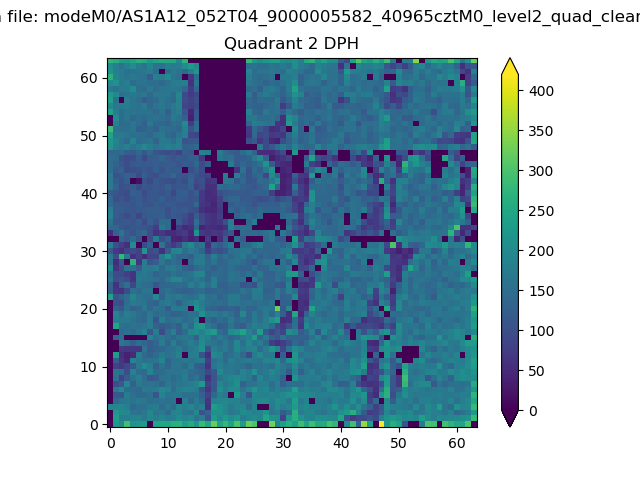
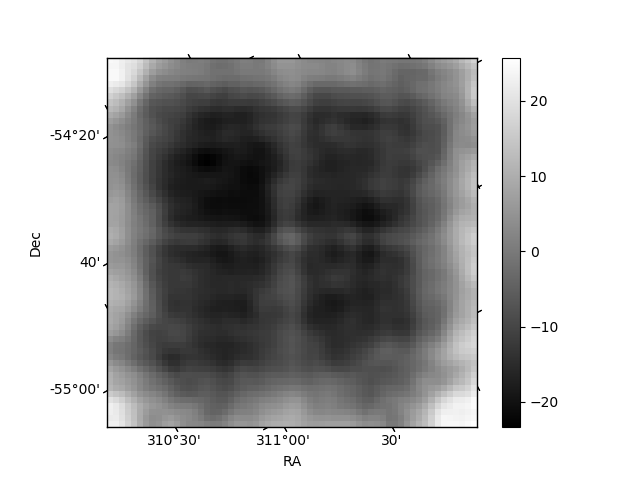
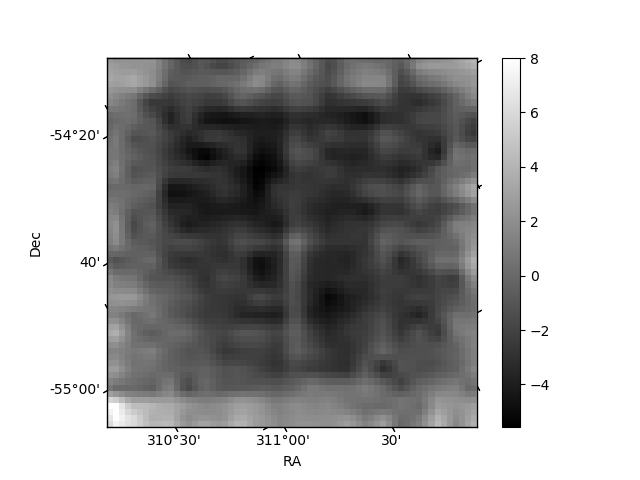
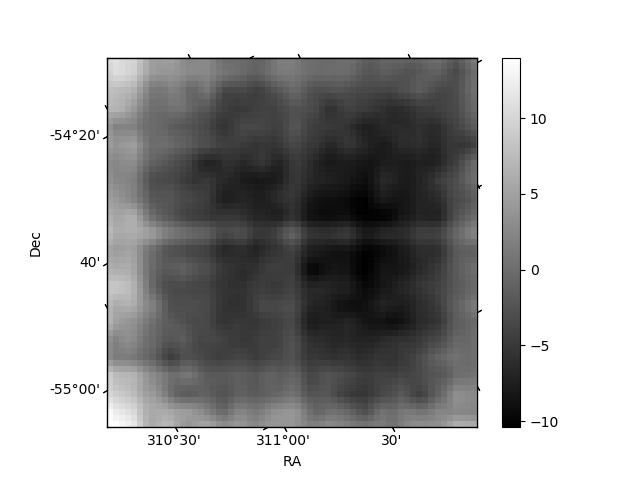
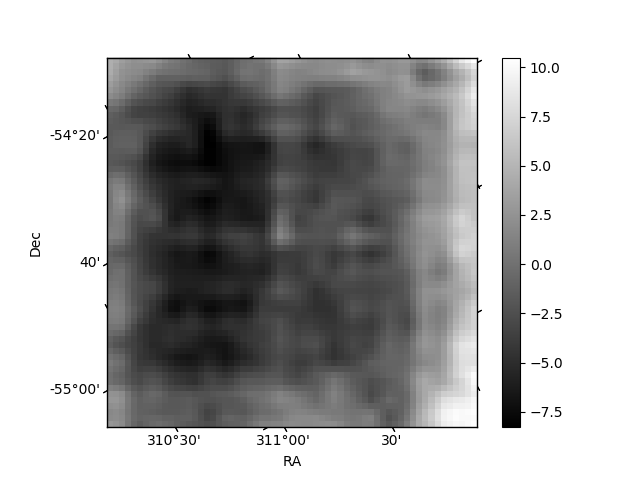
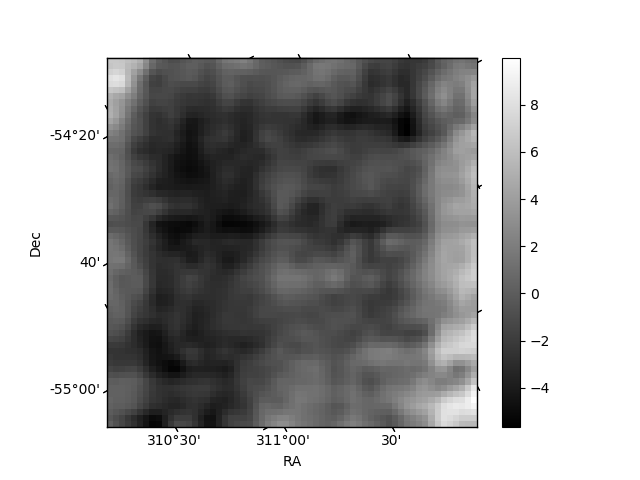
Histogram calculated using DETX and DETY for each event in the final _common_clean file
| Quadrant A | 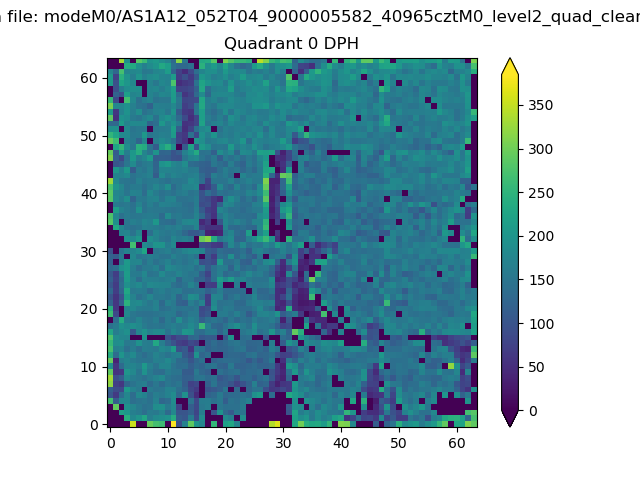 |
 |
Quadrant B |
|---|---|---|---|
| Quadrant D | 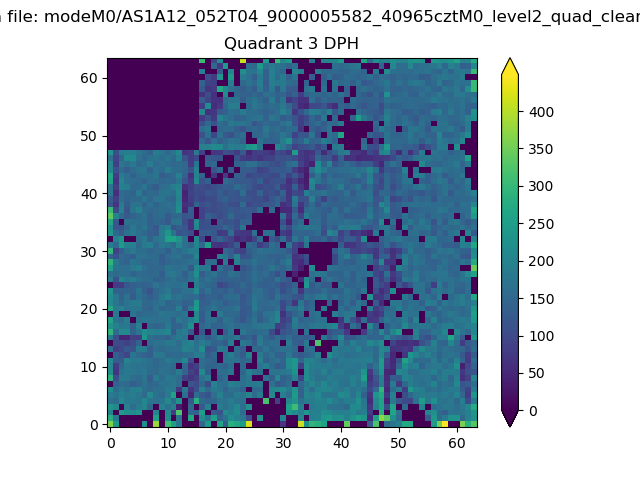 |
 |
Quadrant C |
| Plot type | Count rate plots | Images |
|---|---|---|
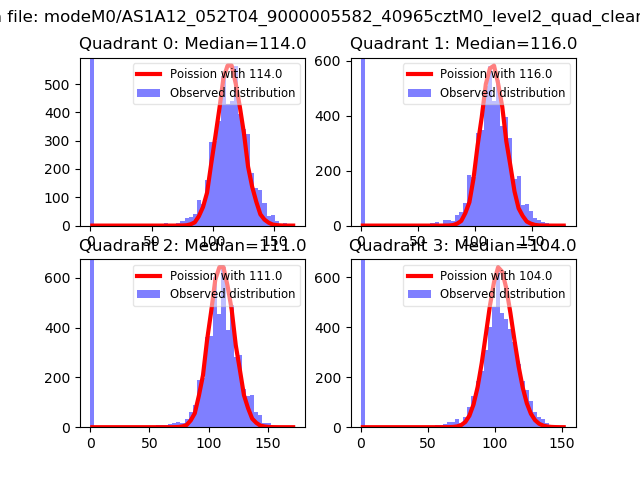
| Comparison with Poisson distribution Blue bars denote a histogram of data divided into 1 sec bins. Red curve is a Poisson curve with rate = median count rate of data. |
 |
 |
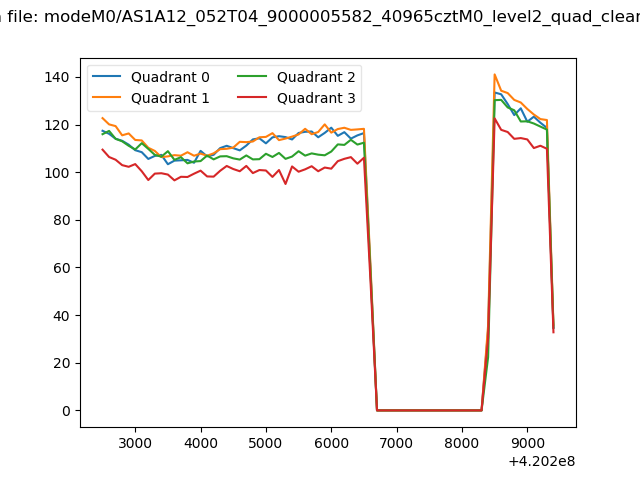
| Quadrant-wise count rates Data is divided into 100 sec bins |
 |
|
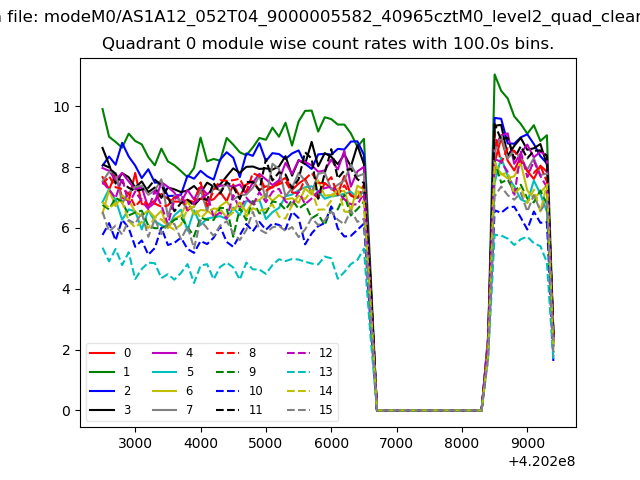
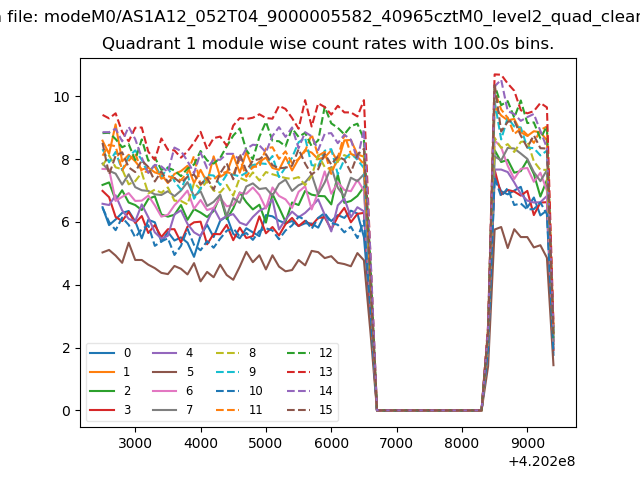
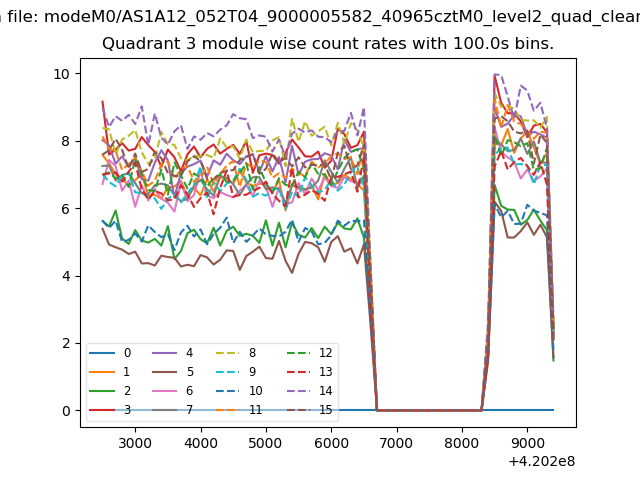
| Module-wise count rates for Quadrant A Data is divided into 100 sec bins |
 |
 |
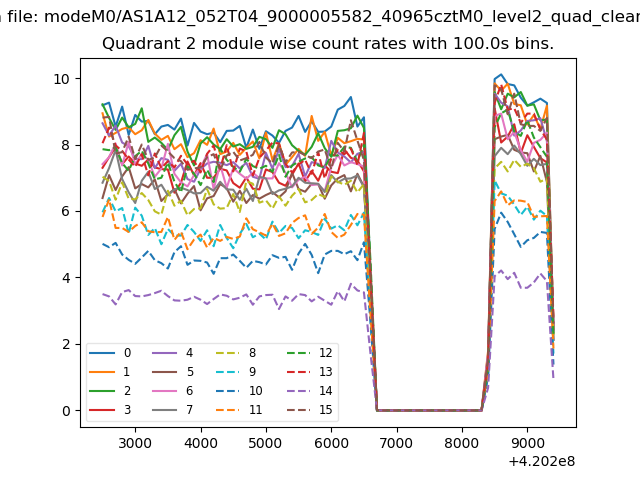
| Module-wise count rates for Quadrant B Data is divided into 100 sec bins |
 |
 |
| Module-wise count rates for Quadrant C Data is divided into 100 sec bins |
 |
 |
| Module-wise count rates for Quadrant D Data is divided into 100 sec bins |
 |
 |
| Parameter | Plot |
|---|---|
| CZT HV Monitor | 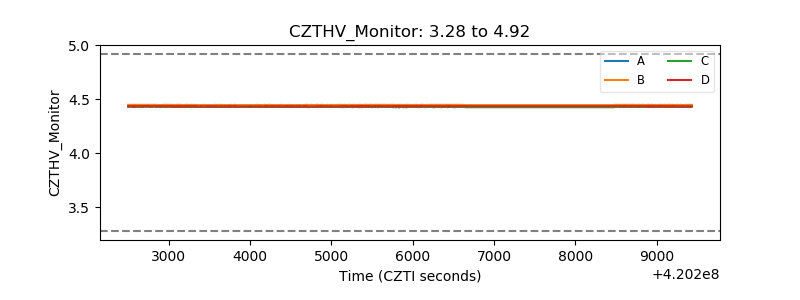 |
| D_VDD | 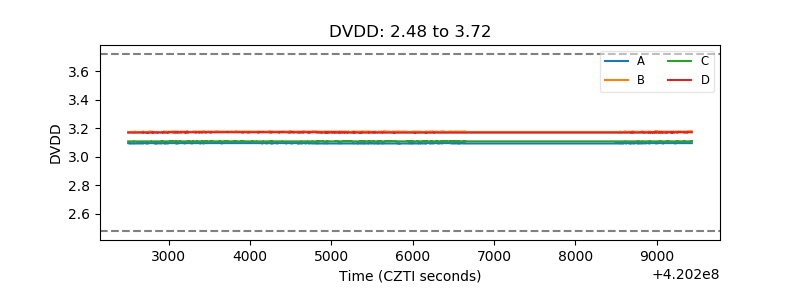 |
| Temperature 1 | 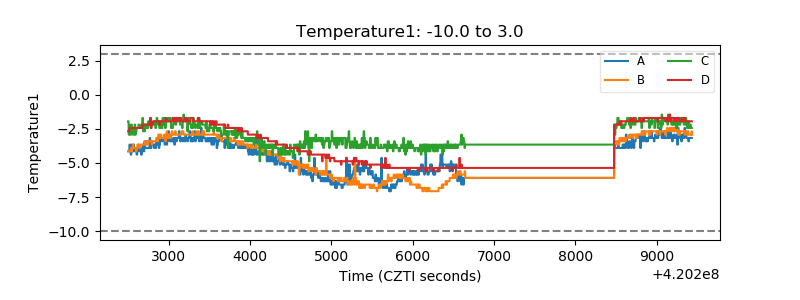 |
| Veto HV Monitor | 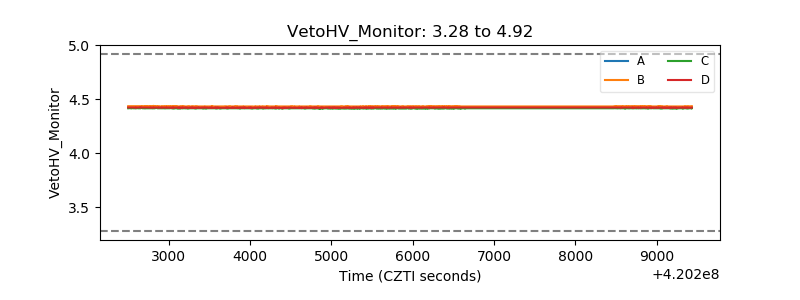 |
| Veto LLD | 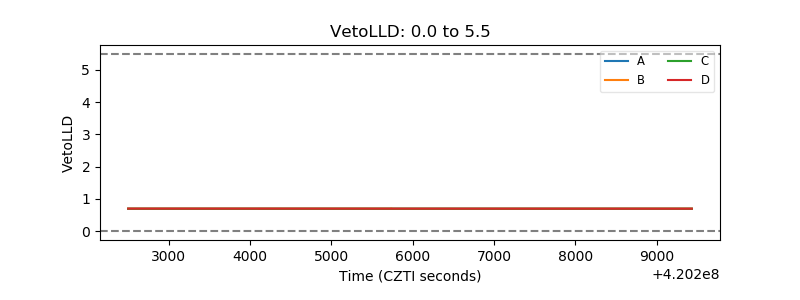 |
| Alpha Counter | 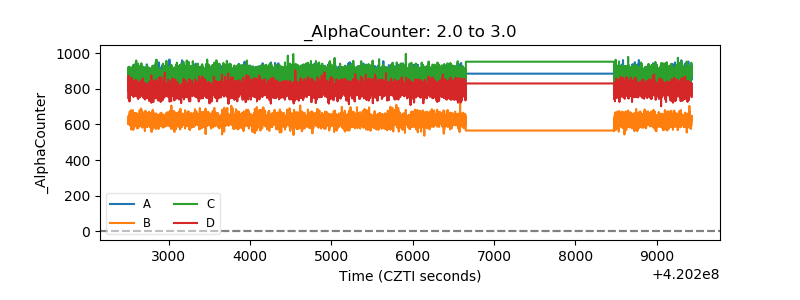 |
| _CPM_Rate | 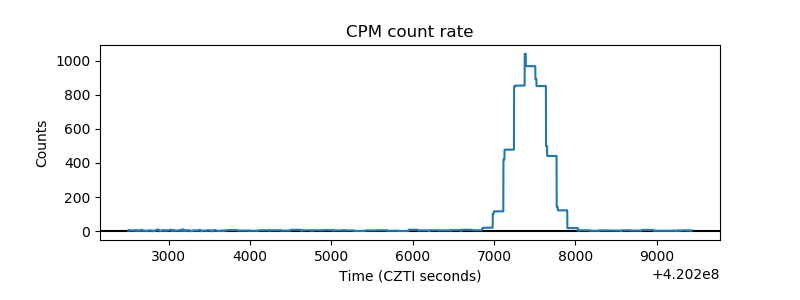 |
| CZT Counter | 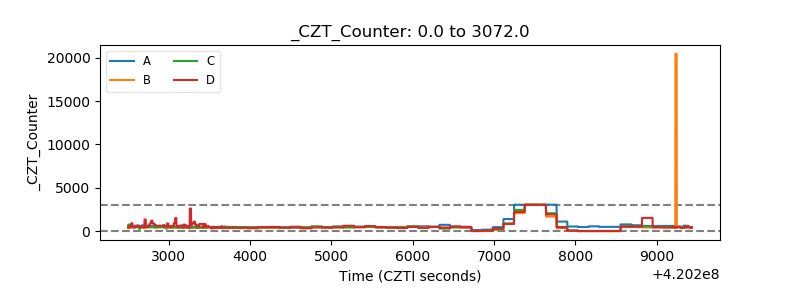 |
| +2.5 Volts monitor |  |
| +5 Volts monitor | 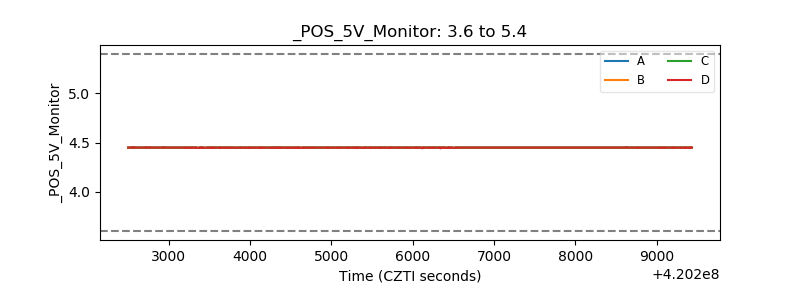 |
| _ROLL_ROT | 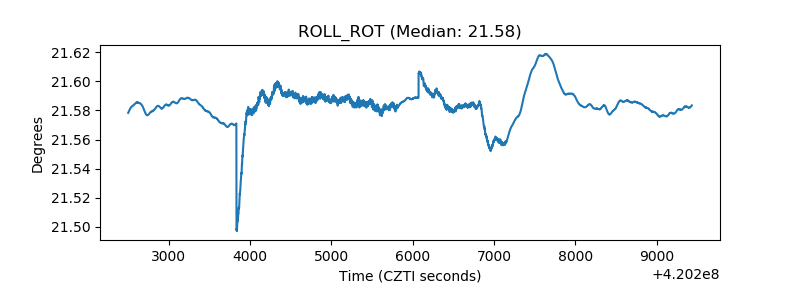 |
| _Roll_DEC | 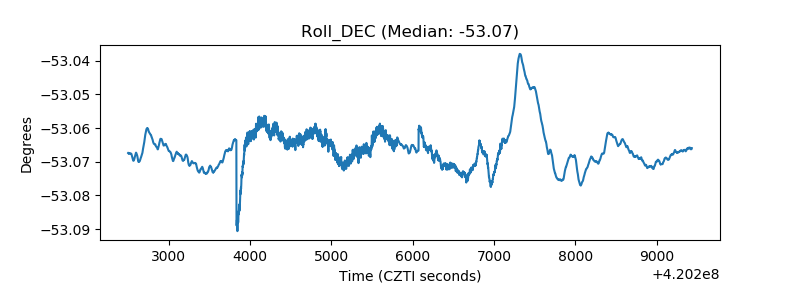 |
| _Roll_RA | 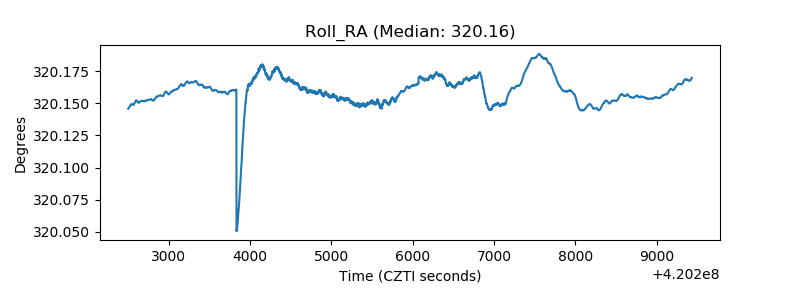 |
| Veto Counter | 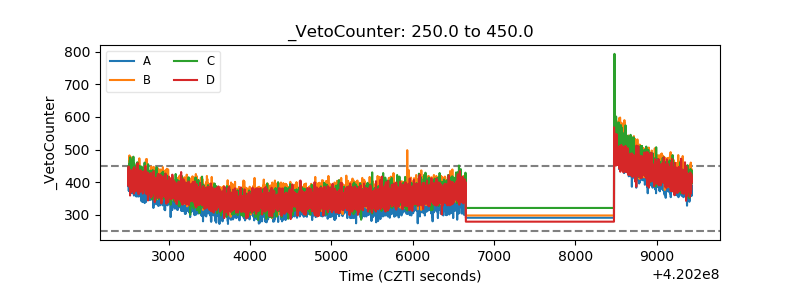 |