| Param | Original file | Final file |
|---|---|---|
| Filename | modeM0/AS1A12_052T04_9000005582_40968cztM0_level2.fits | modeM0/AS1A12_052T04_9000005582_40968cztM0_level2_quad_clean.evt |
| Size (bytes) | 301,458,240 | 89,179,200 |
| Size | 287.5 MB | 85.0 MB |
| Events in quadrant A | 2,875,780 | 618,571 |
| Events in quadrant B | 2,269,710 | 626,685 |
| Events in quadrant C | 2,910,538 | 568,951 |
| Events in quadrant D | 2,717,577 | 539,576 |
| Mode M9 | |||
|---|---|---|---|
| Quadrant | BADHDUFLAG | Total packets | Discarded packets |
| A | 0 | 30 | 0 |
| B | 0 | 30 | 0 |
| C | 0 | 30 | 0 |
| D | 0 | 31 | 0 |
| Mode SS | |||
|---|---|---|---|
| Quadrant | BADHDUFLAG | Total packets | Discarded packets |
| A | 0 | 102 | 0 |
| B | 0 | 102 | 0 |
| C | 0 | 102 | 0 |
| D | 0 | 102 | 0 |
| Mode M0 | |||
|---|---|---|---|
| Quadrant | BADHDUFLAG | Total packets | Discarded packets |
| A | 0 | 11476 | 3 |
| B | 0 | 9978 | 2 |
| C | 0 | 11605 | 2 |
| D | 0 | 11455 | 2 |
| Quadrant | Total seconds | Saturated seconds | Saturation percentage |
|---|---|---|---|
| A | 4941 | 38 | 0.769075% |
| B | 4941 | 8 | 0.161911% |
| C | 4941 | 142 | 2.873912% |
| D | 4941 | 100 | 2.023882% |
Noise dominated data is calculated using 1-second bins in cleaned event files. If a bin has >2000 counts, and if more than 50% of those come from <1% of pixels, then it is considered to be noise-dominated and hence unusable.
| Quadrant | # 1 sec bins | Bins with >0 counts | Bins with >2000 counts | High rate bins dominated by noise | Noise dominated (total time) | Noise dominated (detector-on time) | Marked lightcurve |
|---|---|---|---|---|---|---|---|
| A | 7064 | 4942 | 35 | 35 | 0.50% | 0.71% | 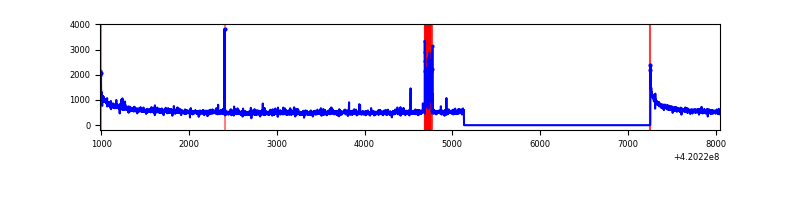 |
| B | 7064 | 4942 | 0 | 0 | 0.00% | 0.00% | 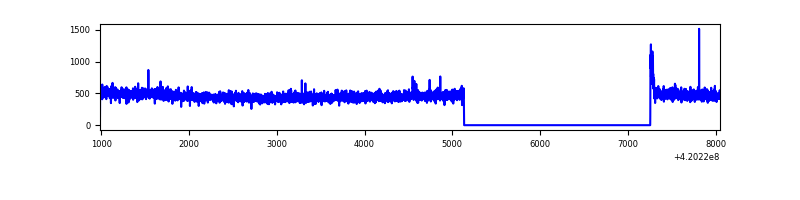 |
| C | 7064 | 4942 | 120 | 120 | 1.70% | 2.43% | 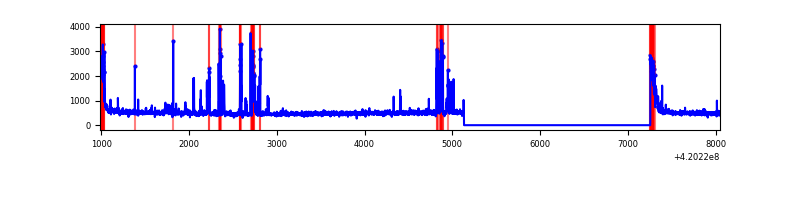 |
| D | 7064 | 4942 | 85 | 85 | 1.20% | 1.72% | 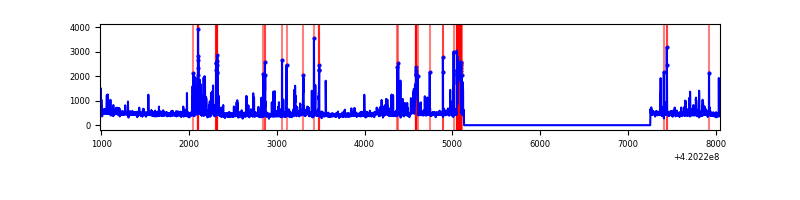 |
Top three noisy pixels from each quadrant. If the there are fewer than three noisy pixels in the level2.evt file, extra rows are filled as -1
| Pixel properties | Quadrant properties | ||||||
|---|---|---|---|---|---|---|---|
| Quadrant | DetID | PixID | Counts | Sigma | Mean | Median | Sigma |
| A | 10 | 83 | 483927 | 4165.73 | 574 | 563 | 116.0 |
| A | 12 | 189 | 158505 | 1361.18 | 574 | 563 | 116.0 |
| A | 13 | 254 | 7660 | 61.16 | 574 | 563 | 116.0 |
| B | 0 | 186 | 13813 | 122.39 | 571 | 556 | 108.3 |
| B | 12 | 111 | 13396 | 118.54 | 571 | 556 | 108.3 |
| B | 11 | 111 | 12391 | 109.26 | 571 | 556 | 108.3 |
| C | 14 | 254 | 351569 | 2761.09 | 547 | 551 | 127.1 |
| C | 15 | 214 | 214917 | 1686.19 | 547 | 551 | 127.1 |
| C | 0 | 10 | 206235 | 1617.9 | 547 | 551 | 127.1 |
| D | 13 | 249 | 321677 | 2408.28 | 548 | 533 | 133.3 |
| D | 2 | 249 | 202669 | 1515.83 | 548 | 533 | 133.3 |
| D | 2 | 234 | 24260 | 177.93 | 548 | 533 | 133.3 |
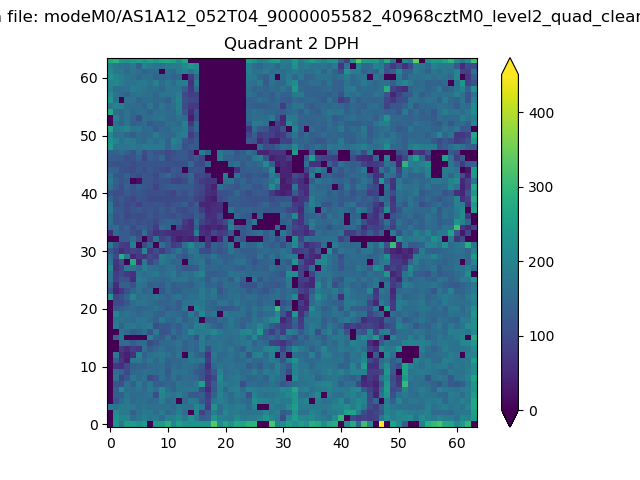
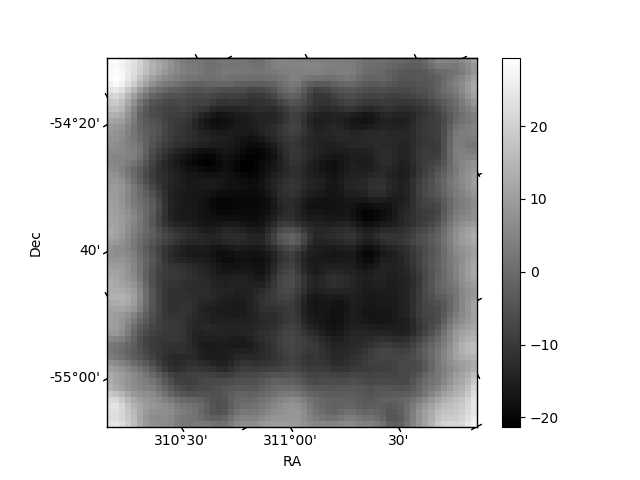
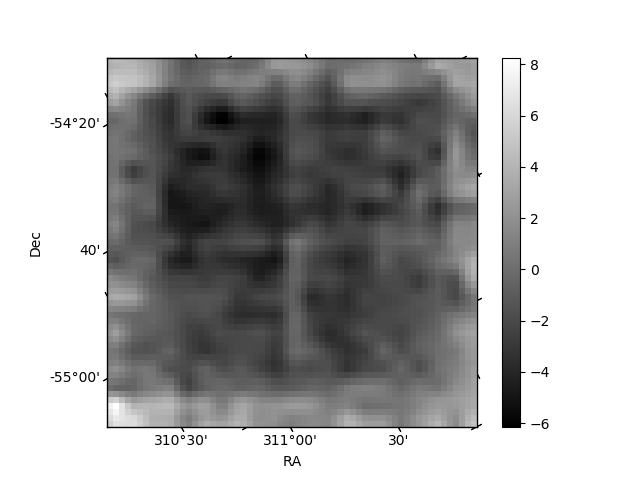
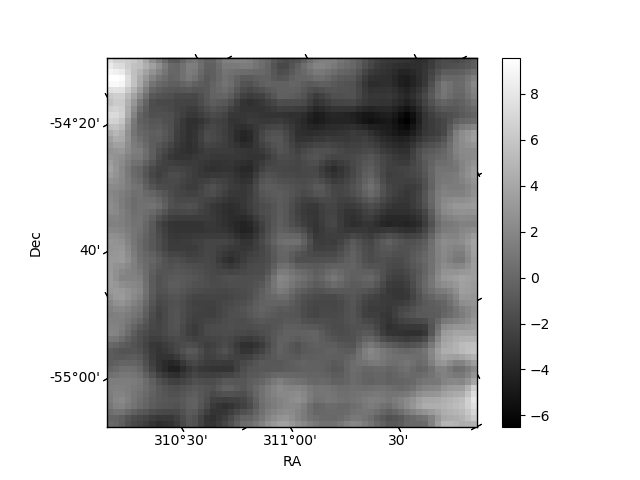
Histogram calculated using DETX and DETY for each event in the final _common_clean file
| Quadrant A | 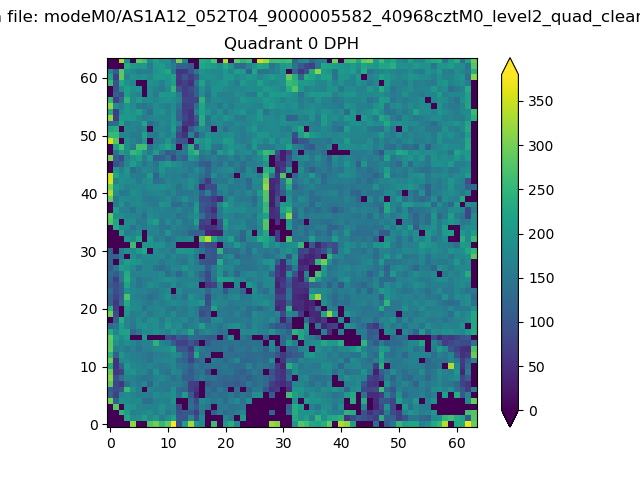 |
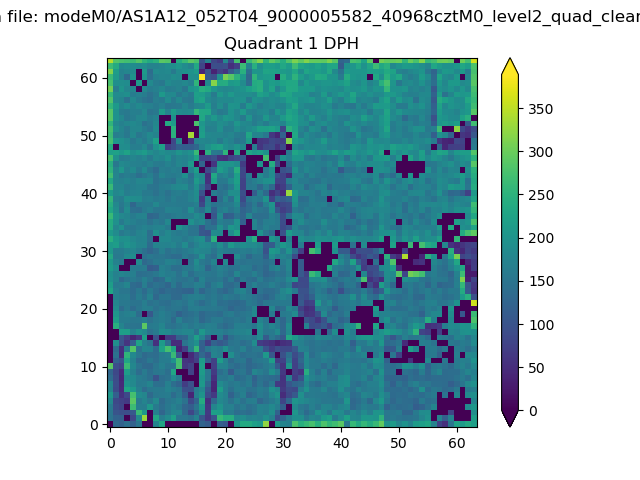 |
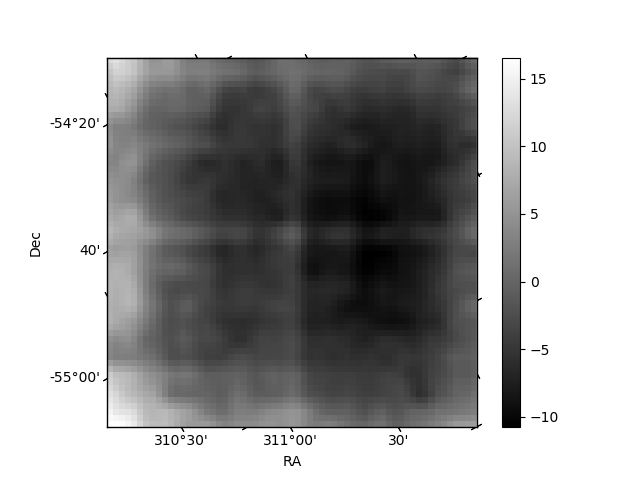
Quadrant B |
|---|---|---|---|
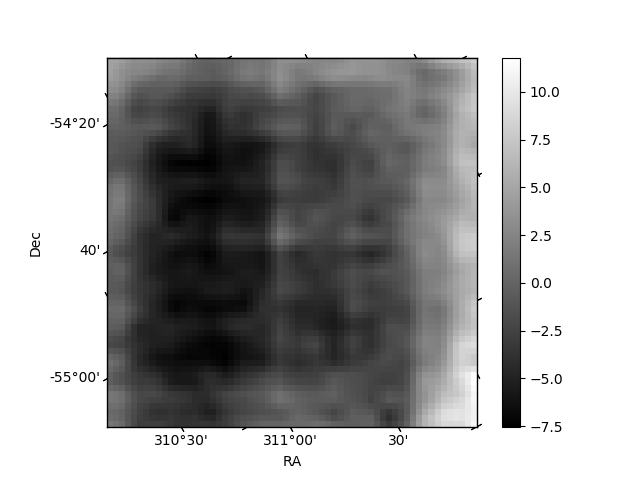
| Quadrant D | 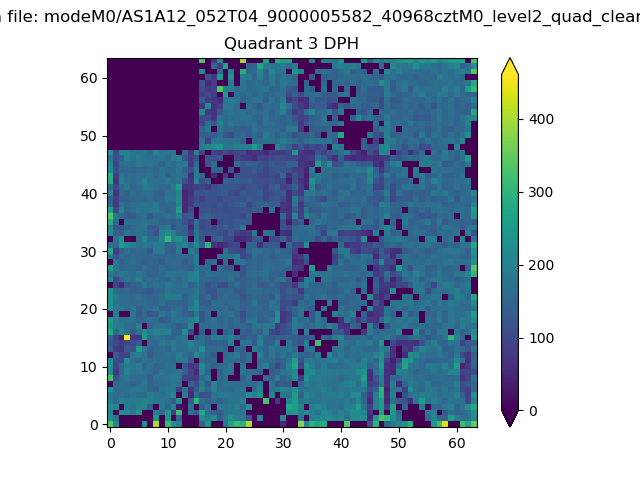 |
 |
Quadrant C |
| Plot type | Count rate plots | Images |
|---|---|---|
| Comparison with Poisson distribution Blue bars denote a histogram of data divided into 1 sec bins. Red curve is a Poisson curve with rate = median count rate of data. |
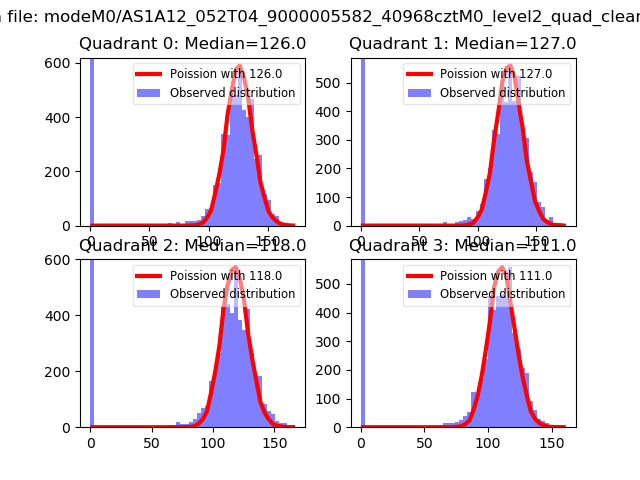 |
 |
| Quadrant-wise count rates Data is divided into 100 sec bins |
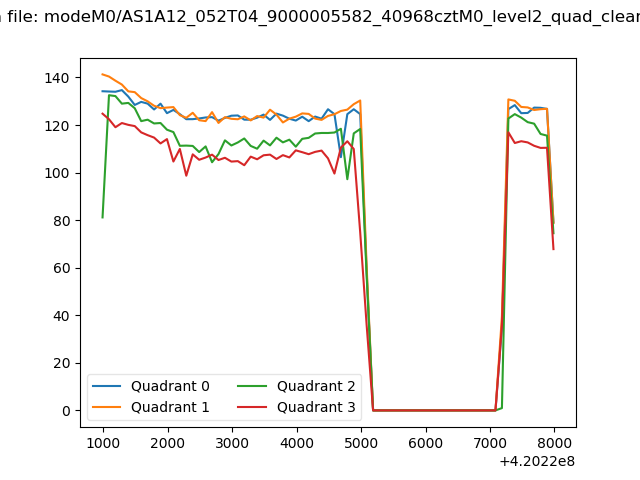 |
|
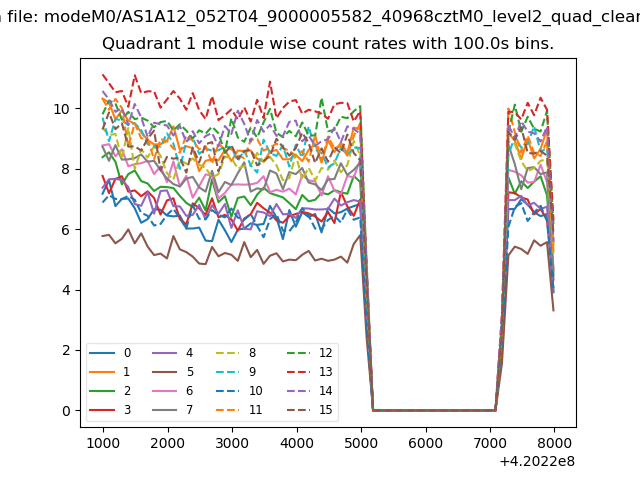
| Module-wise count rates for Quadrant A Data is divided into 100 sec bins |
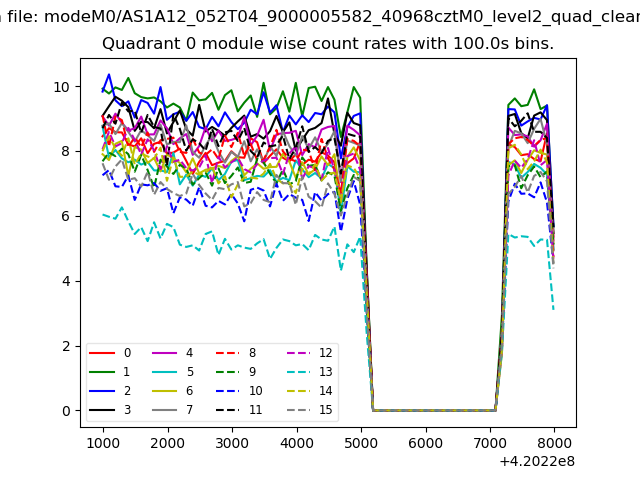 |
 |
| Module-wise count rates for Quadrant B Data is divided into 100 sec bins |
 |
 |
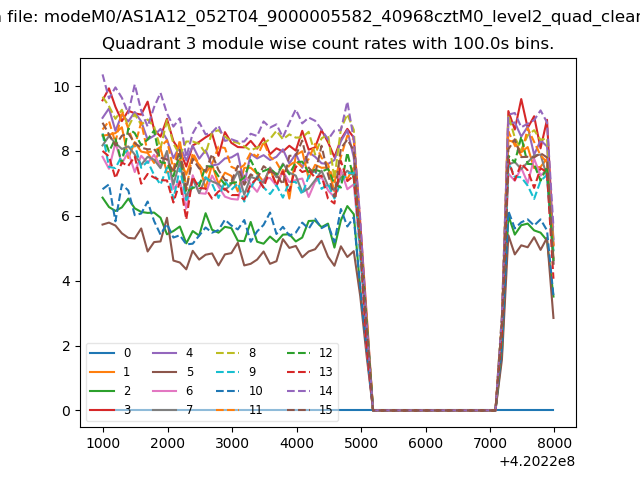
| Module-wise count rates for Quadrant C Data is divided into 100 sec bins |
 |
 |
| Module-wise count rates for Quadrant D Data is divided into 100 sec bins |
 |
 |
| Parameter | Plot |
|---|---|
| CZT HV Monitor | 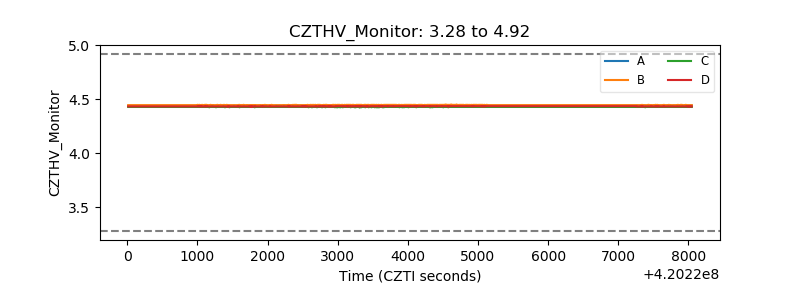 |
| D_VDD | 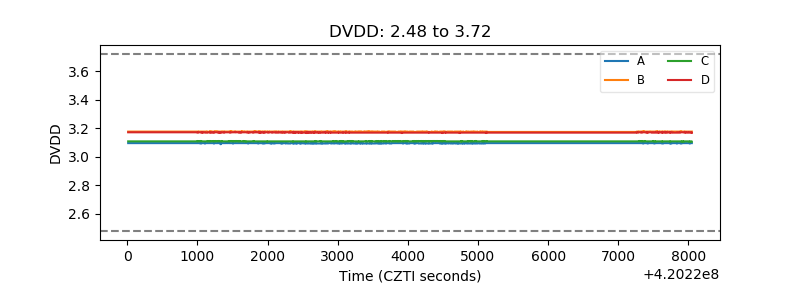 |
| Temperature 1 | 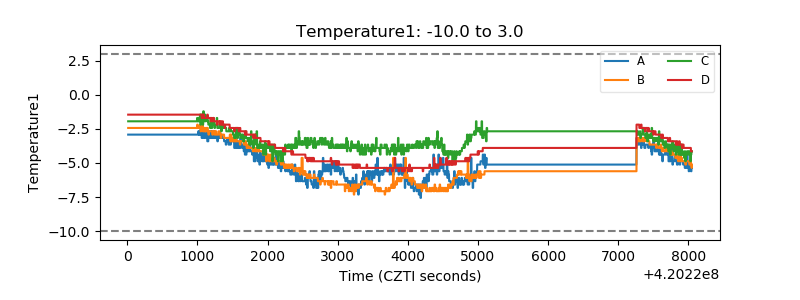 |
| Veto HV Monitor | 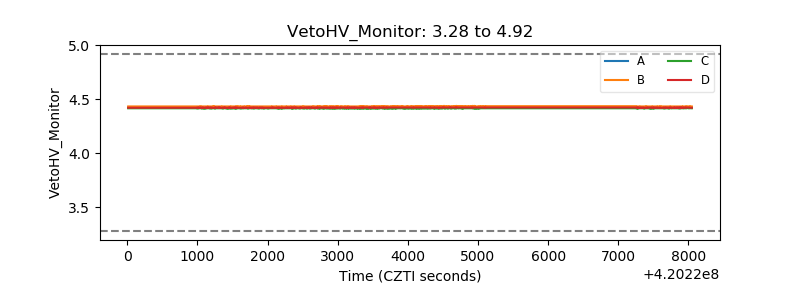 |
| Veto LLD | 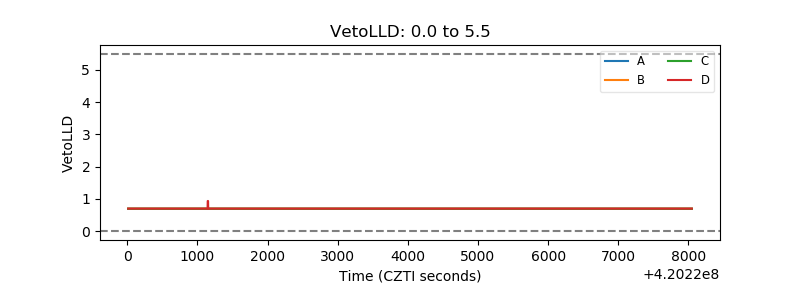 |
| Alpha Counter | 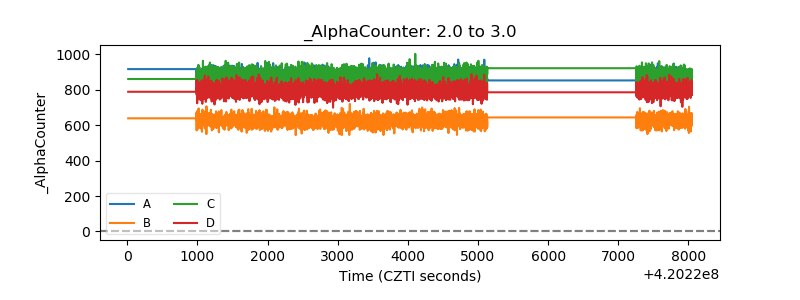 |
| _CPM_Rate | 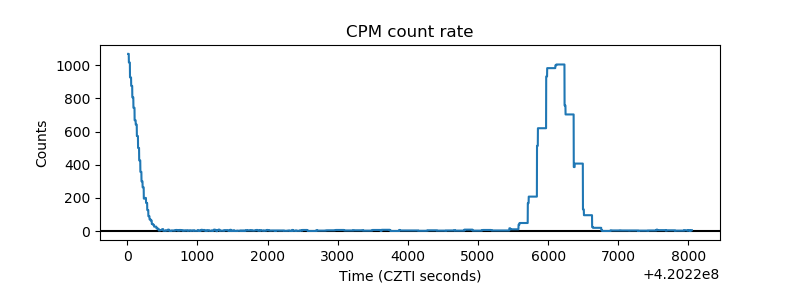 |
| CZT Counter | 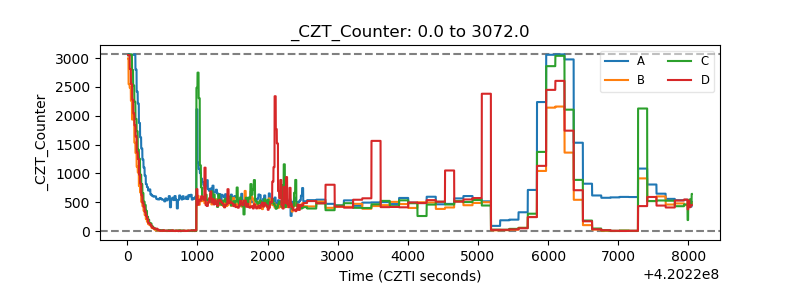 |
| +2.5 Volts monitor | 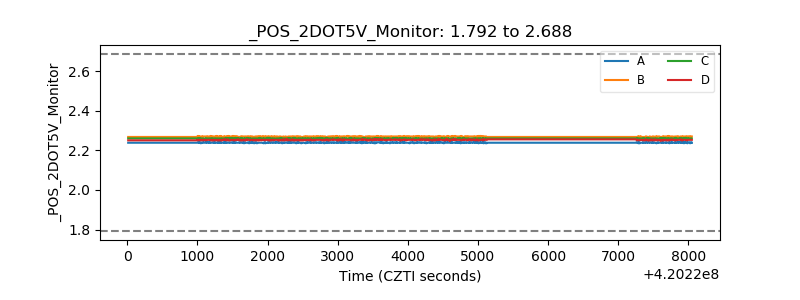 |
| +5 Volts monitor | 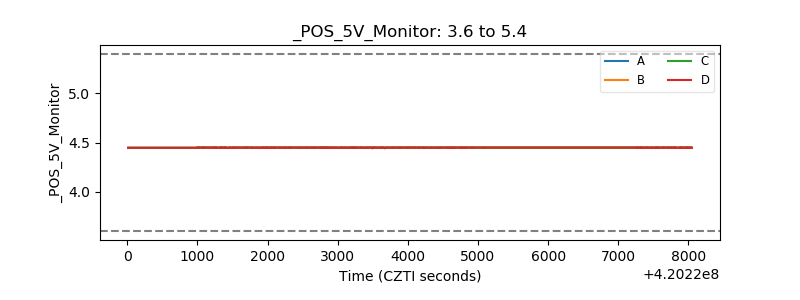 |
| _ROLL_ROT | 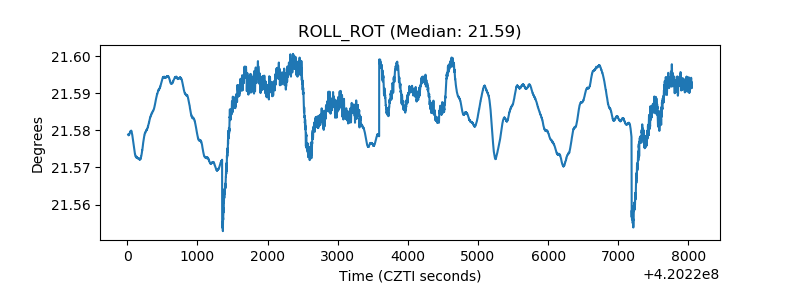 |
| _Roll_DEC | 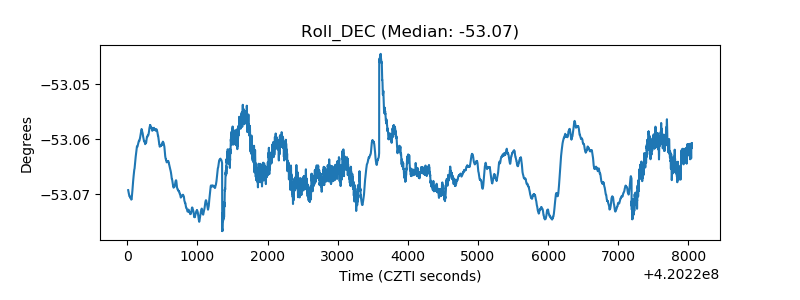 |
| _Roll_RA | 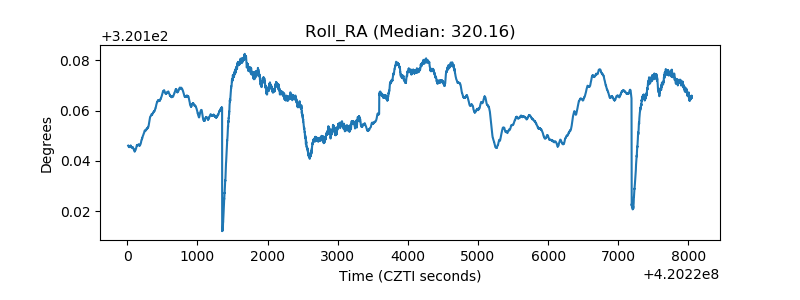 |
| Veto Counter | 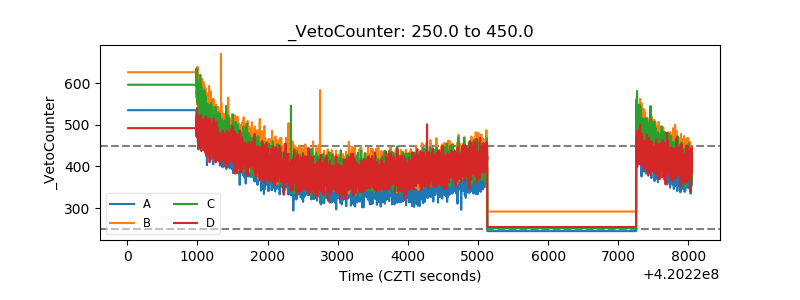 |