| Param | Original file | Final file |
|---|---|---|
| Filename | modeM0/AS1A12_052T04_9000005582_40969cztM0_level2.fits | modeM0/AS1A12_052T04_9000005582_40969cztM0_level2_quad_clean.evt |
| Size (bytes) | 302,941,440 | 84,960,000 |
| Size | 288.9 MB | 81.0 MB |
| Events in quadrant A | 2,754,020 | 589,278 |
| Events in quadrant B | 2,199,572 | 594,770 |
| Events in quadrant C | 2,587,829 | 543,498 |
| Events in quadrant D | 3,292,983 | 503,832 |
| Mode M9 | |||
|---|---|---|---|
| Quadrant | BADHDUFLAG | Total packets | Discarded packets |
| A | 0 | 30 | 0 |
| B | 0 | 30 | 0 |
| C | 0 | 30 | 0 |
| D | 0 | 31 | 0 |
| Mode SS | |||
|---|---|---|---|
| Quadrant | BADHDUFLAG | Total packets | Discarded packets |
| A | 0 | 98 | 0 |
| B | 0 | 98 | 0 |
| C | 0 | 98 | 0 |
| D | 0 | 98 | 0 |
| Mode M0 | |||
|---|---|---|---|
| Quadrant | BADHDUFLAG | Total packets | Discarded packets |
| A | 0 | 11167 | 3 |
| B | 0 | 9877 | 2 |
| C | 0 | 10713 | 2 |
| D | 0 | 13210 | 2 |
| Quadrant | Total seconds | Saturated seconds | Saturation percentage |
|---|---|---|---|
| A | 4868 | 11 | 0.225965% |
| B | 4868 | 9 | 0.184881% |
| C | 4868 | 84 | 1.725555% |
| D | 4868 | 235 | 4.827445% |
Noise dominated data is calculated using 1-second bins in cleaned event files. If a bin has >2000 counts, and if more than 50% of those come from <1% of pixels, then it is considered to be noise-dominated and hence unusable.
| Quadrant | # 1 sec bins | Bins with >0 counts | Bins with >2000 counts | High rate bins dominated by noise | Noise dominated (total time) | Noise dominated (detector-on time) | Marked lightcurve |
|---|---|---|---|---|---|---|---|
| A | 6991 | 4869 | 7 | 7 | 0.10% | 0.14% | 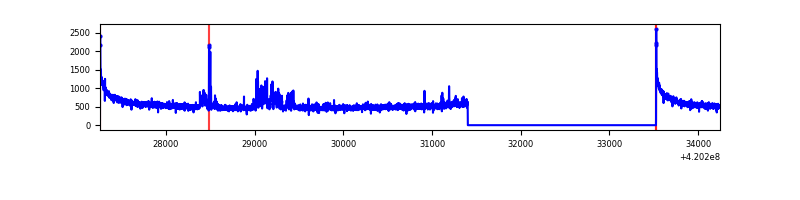 |
| B | 6991 | 4869 | 1 | 1 | 0.01% | 0.02% | 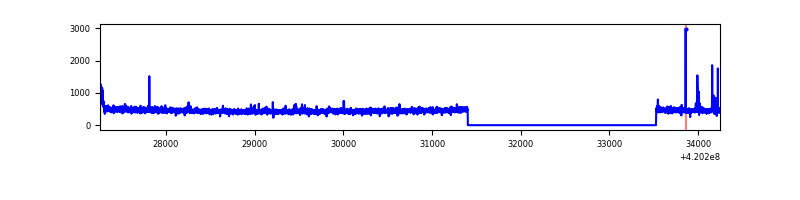 |
| C | 6991 | 4869 | 83 | 83 | 1.19% | 1.70% | 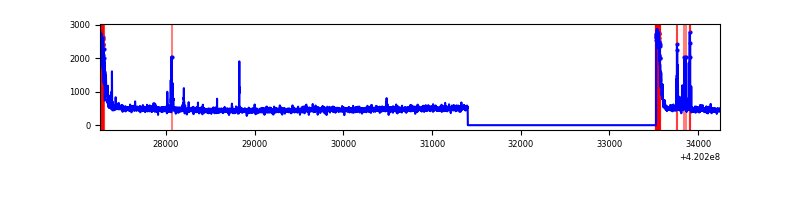 |
| D | 6991 | 4869 | 231 | 231 | 3.30% | 4.74% | 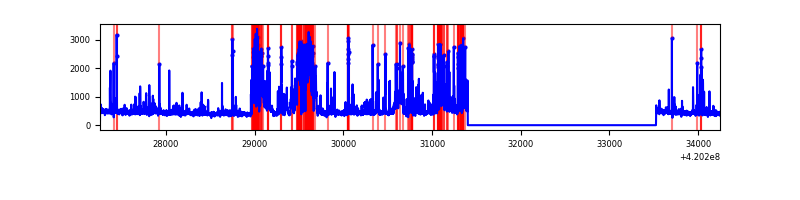 |
Top three noisy pixels from each quadrant. If the there are fewer than three noisy pixels in the level2.evt file, extra rows are filled as -1
| Pixel properties | Quadrant properties | ||||||
|---|---|---|---|---|---|---|---|
| Quadrant | DetID | PixID | Counts | Sigma | Mean | Median | Sigma |
| A | 10 | 83 | 471298 | 4176.01 | 549 | 539 | 112.7 |
| A | 12 | 189 | 157862 | 1395.58 | 549 | 539 | 112.7 |
| A | 13 | 254 | 7869 | 65.02 | 549 | 539 | 112.7 |
| B | 5 | 255 | 19402 | 181.26 | 545 | 531 | 104.1 |
| B | 0 | 190 | 18258 | 170.27 | 545 | 531 | 104.1 |
| B | 0 | 186 | 13756 | 127.03 | 545 | 531 | 104.1 |
| C | 0 | 10 | 232480 | 1899.35 | 526 | 531 | 122.1 |
| C | 15 | 214 | 212722 | 1737.56 | 526 | 531 | 122.1 |
| C | 14 | 254 | 80031 | 651.0 | 526 | 531 | 122.1 |
| D | 13 | 249 | 1065296 | 8432.23 | 521 | 507 | 126.3 |
| D | 2 | 249 | 121869 | 961.08 | 521 | 507 | 126.3 |
| D | 13 | 171 | 37133 | 290.05 | 521 | 507 | 126.3 |
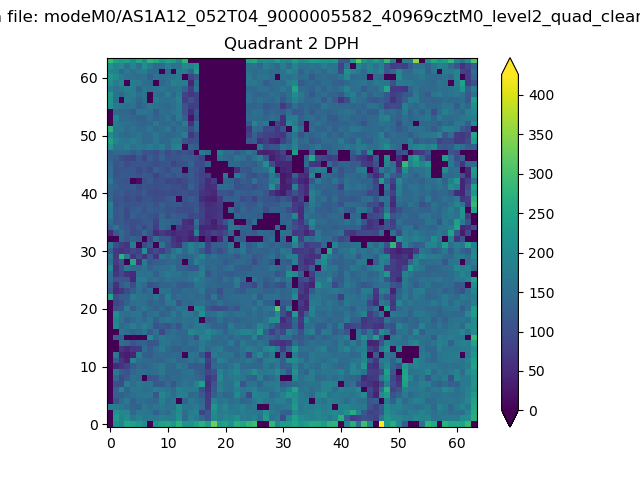
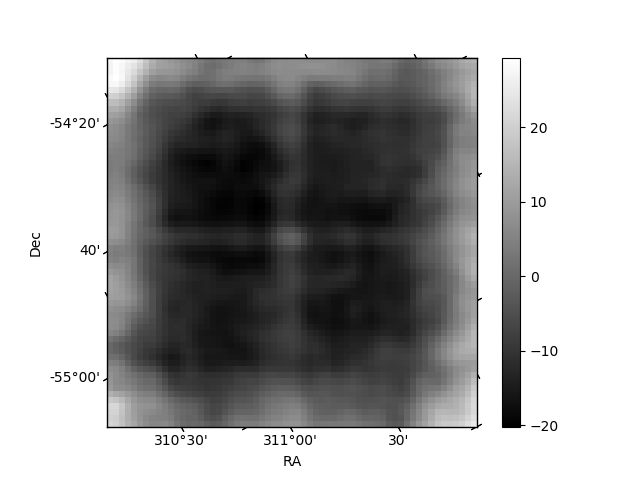
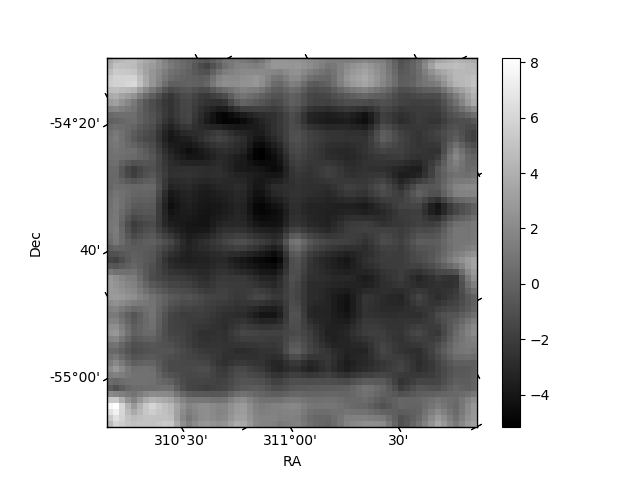
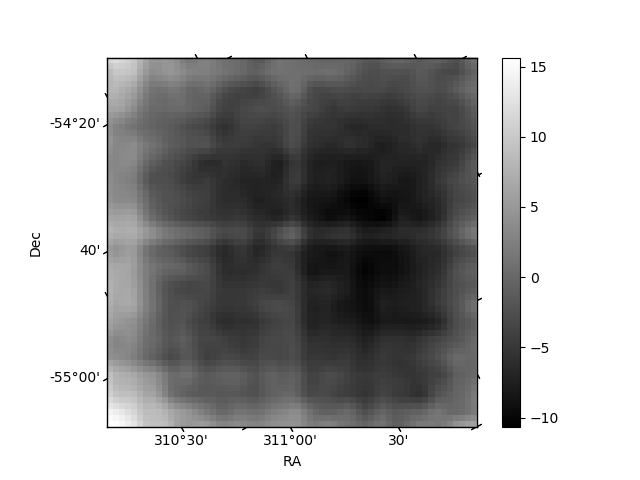
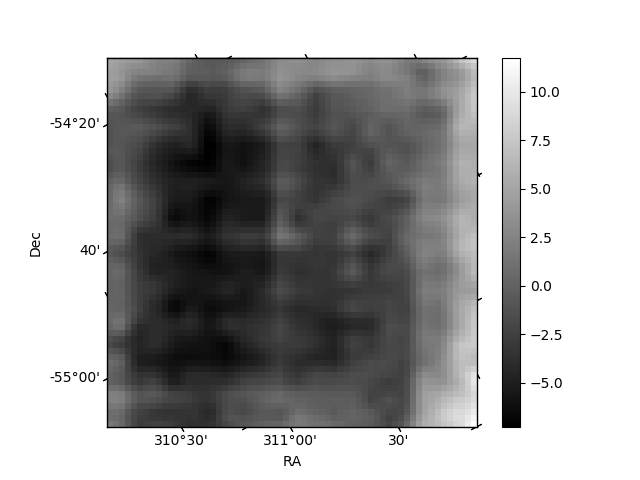
Histogram calculated using DETX and DETY for each event in the final _common_clean file
| Quadrant A | 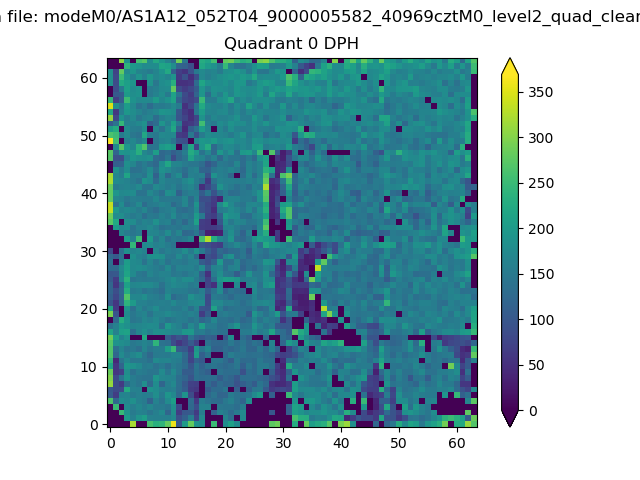 |
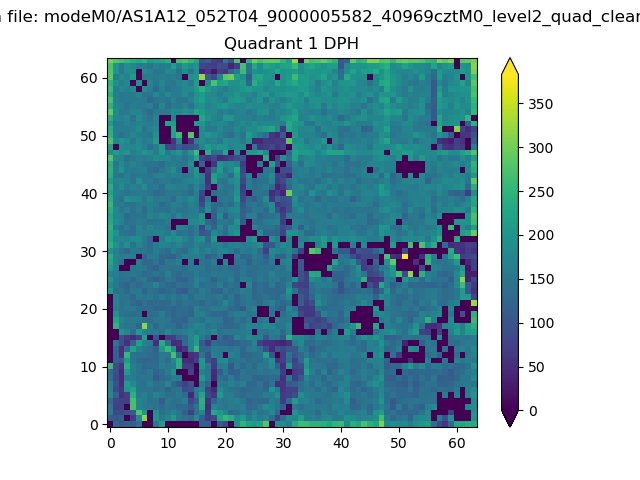 |
Quadrant B |
|---|---|---|---|
| Quadrant D | 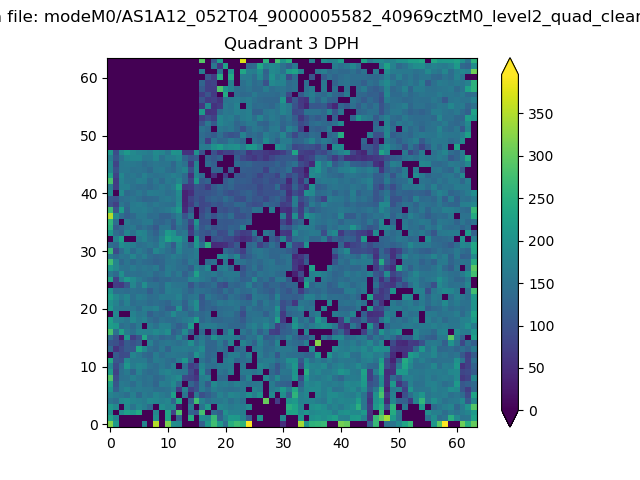 |
 |
Quadrant C |
| Plot type | Count rate plots | Images |
|---|---|---|
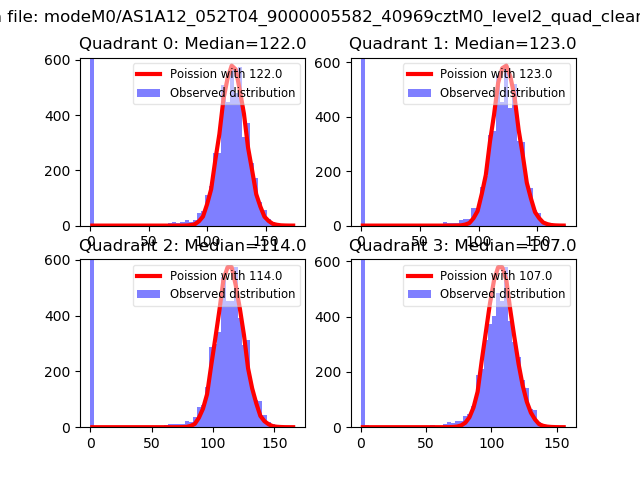
| Comparison with Poisson distribution Blue bars denote a histogram of data divided into 1 sec bins. Red curve is a Poisson curve with rate = median count rate of data. |
 |
 |
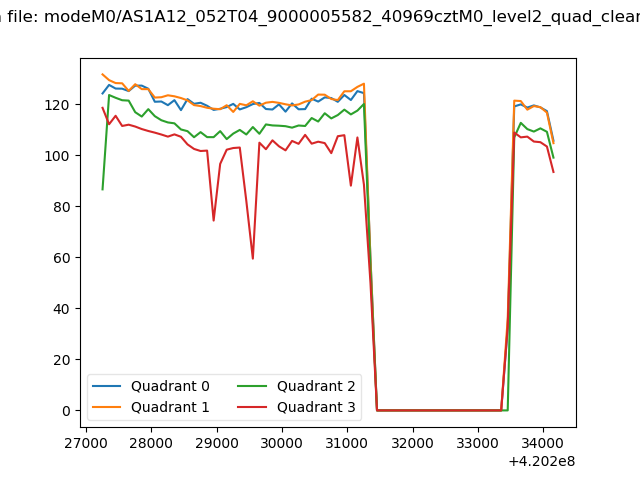
| Quadrant-wise count rates Data is divided into 100 sec bins |
 |
|
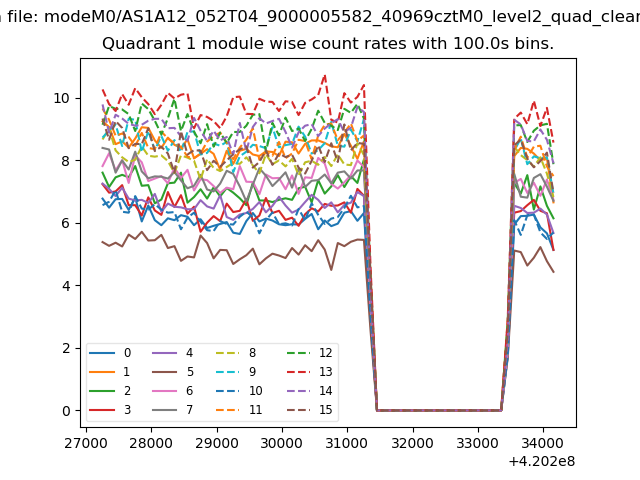
| Module-wise count rates for Quadrant A Data is divided into 100 sec bins |
 |
 |
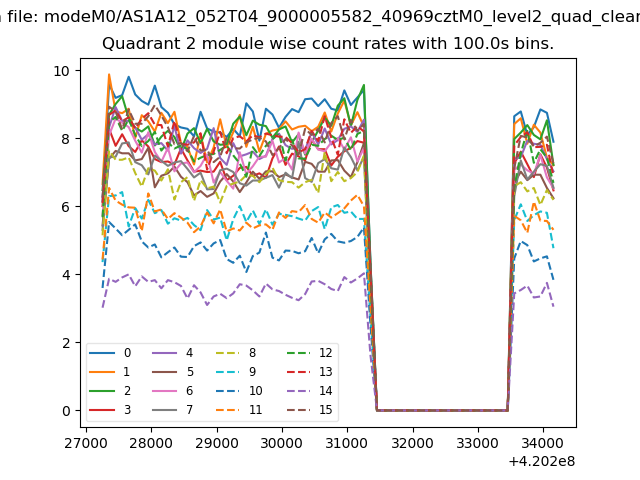
| Module-wise count rates for Quadrant B Data is divided into 100 sec bins |
 |
 |
| Module-wise count rates for Quadrant C Data is divided into 100 sec bins |
 |
 |
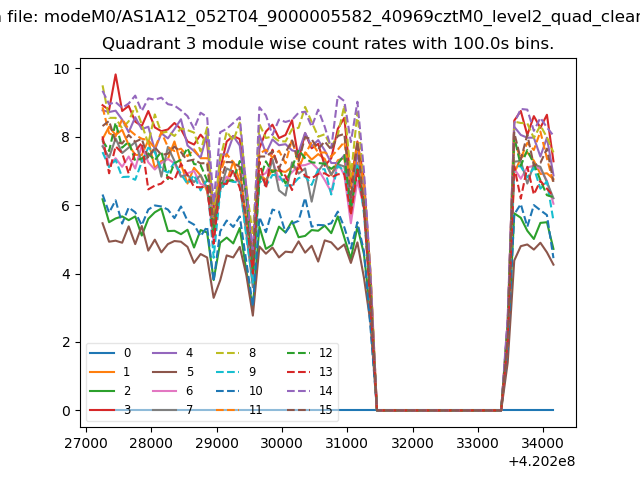
| Module-wise count rates for Quadrant D Data is divided into 100 sec bins |
 |
 |
| Parameter | Plot |
|---|---|
| CZT HV Monitor | 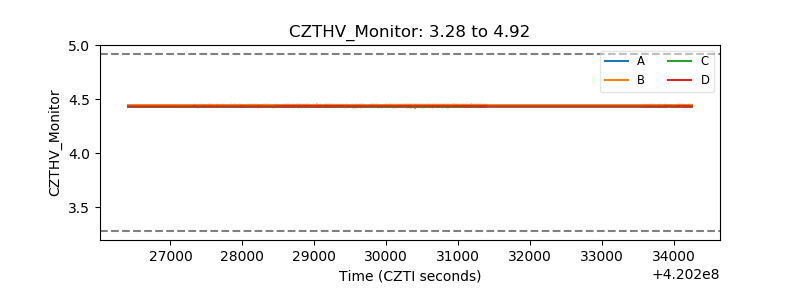 |
| D_VDD | 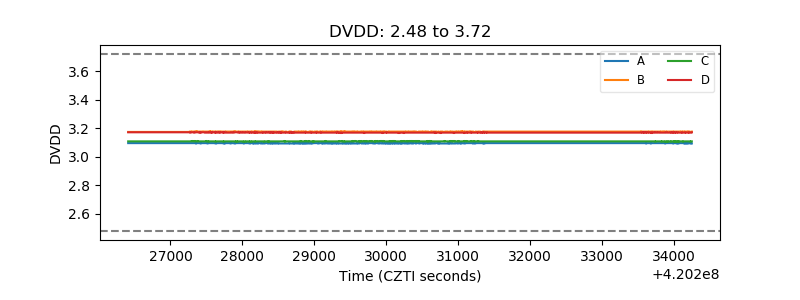 |
| Temperature 1 | 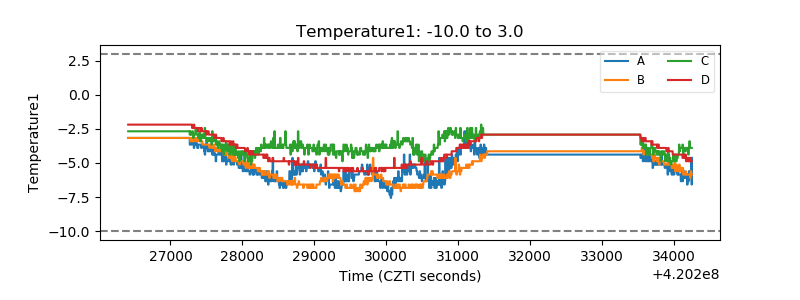 |
| Veto HV Monitor | 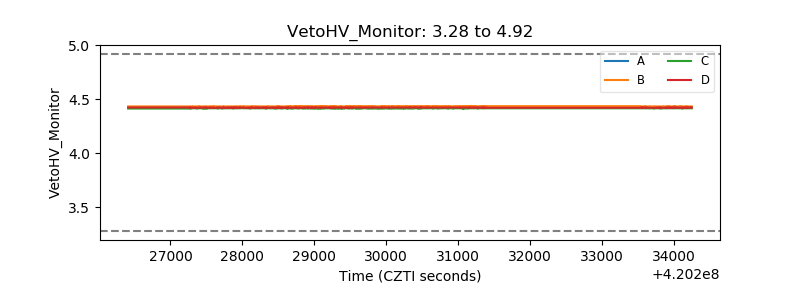 |
| Veto LLD | 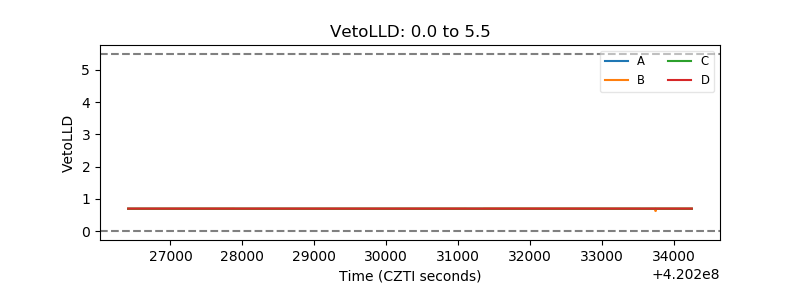 |
| Alpha Counter | 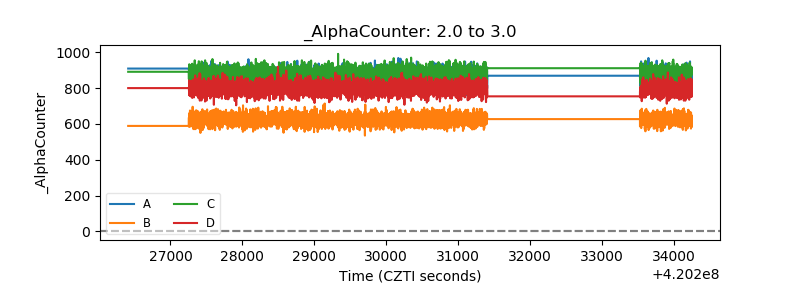 |
| _CPM_Rate | 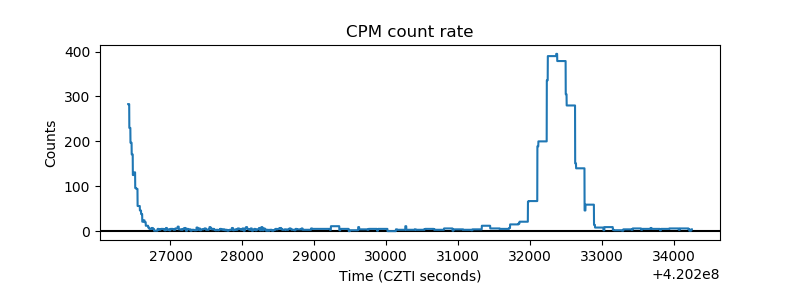 |
| CZT Counter | 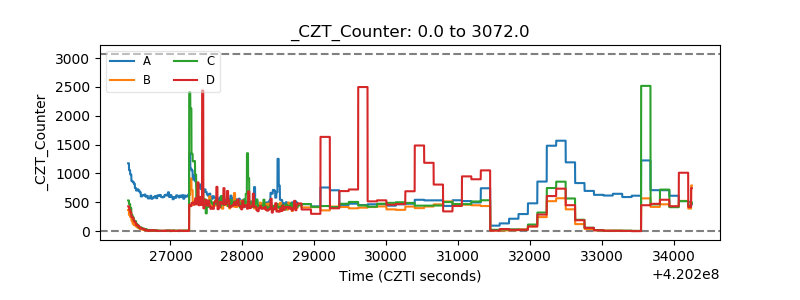 |
| +2.5 Volts monitor | 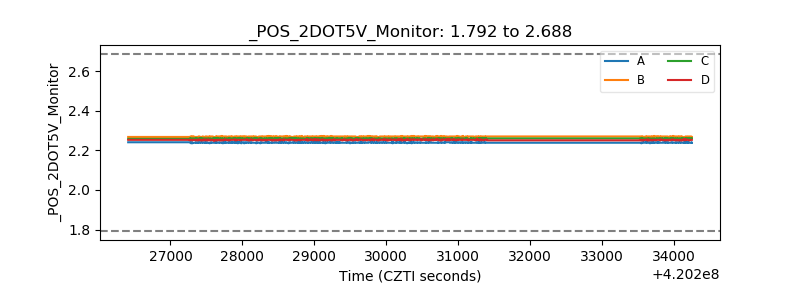 |
| +5 Volts monitor | 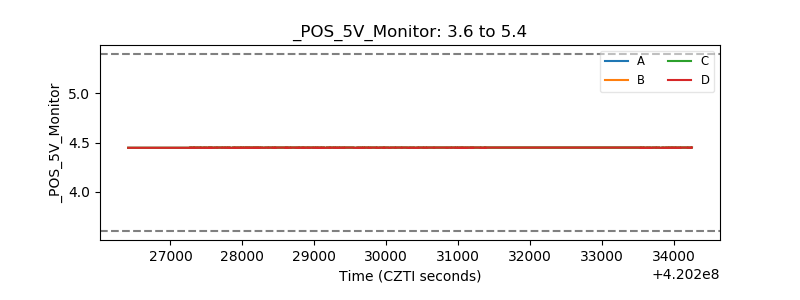 |
| _ROLL_ROT | 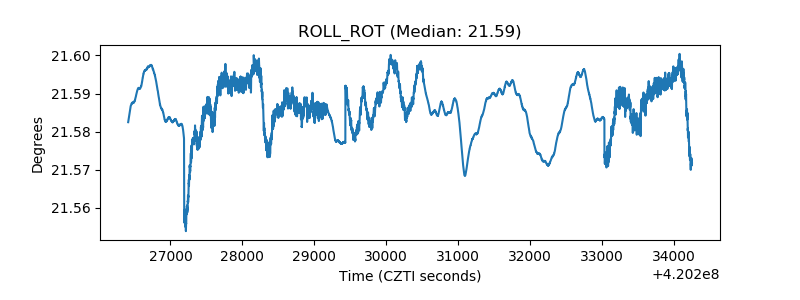 |
| _Roll_DEC | 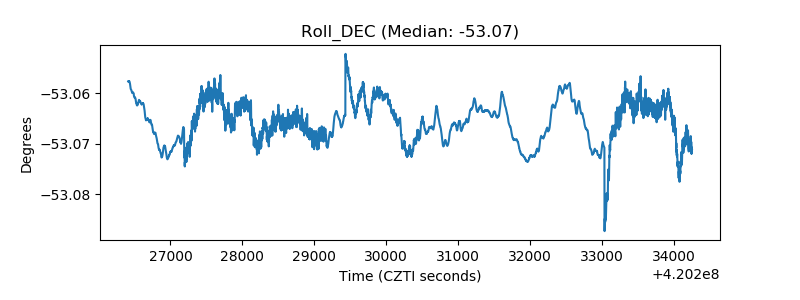 |
| _Roll_RA | 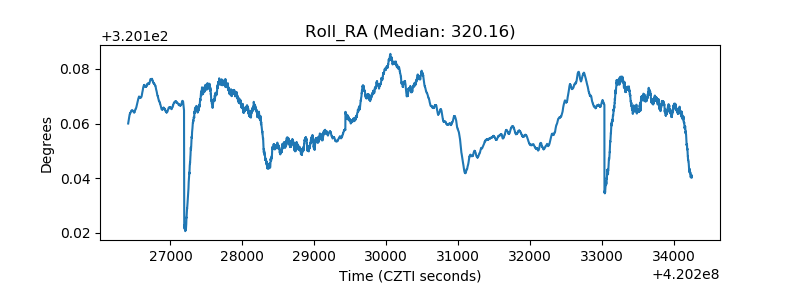 |
| Veto Counter | 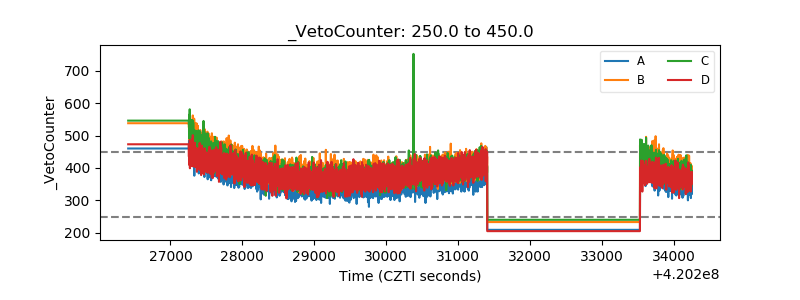 |