| Param | Original file | Final file |
|---|---|---|
| Filename | modeM0/AS1A12_052T04_9000005582_40970cztM0_level2.fits | modeM0/AS1A12_052T04_9000005582_40970cztM0_level2_quad_clean.evt |
| Size (bytes) | 308,131,200 | 85,184,640 |
| Size | 293.9 MB | 81.2 MB |
| Events in quadrant A | 3,020,984 | 583,197 |
| Events in quadrant B | 2,329,092 | 586,950 |
| Events in quadrant C | 2,805,008 | 546,131 |
| Events in quadrant D | 2,857,467 | 509,217 |
| Mode M9 | |||
|---|---|---|---|
| Quadrant | BADHDUFLAG | Total packets | Discarded packets |
| A | 0 | 36 | 0 |
| B | 0 | 36 | 0 |
| C | 0 | 36 | 0 |
| D | 0 | 37 | 0 |
| Mode SS | |||
|---|---|---|---|
| Quadrant | BADHDUFLAG | Total packets | Discarded packets |
| A | 0 | 104 | 0 |
| B | 0 | 104 | 0 |
| C | 0 | 104 | 0 |
| D | 0 | 104 | 0 |
| Mode M0 | |||
|---|---|---|---|
| Quadrant | BADHDUFLAG | Total packets | Discarded packets |
| A | 0 | 12161 | 3 |
| B | 0 | 10486 | 2 |
| C | 0 | 11603 | 2 |
| D | 0 | 12210 | 2 |
| Quadrant | Total seconds | Saturated seconds | Saturation percentage |
|---|---|---|---|
| A | 5046 | 30 | 0.594530% |
| B | 5046 | 24 | 0.475624% |
| C | 5046 | 120 | 2.378121% |
| D | 5046 | 180 | 3.567182% |
Noise dominated data is calculated using 1-second bins in cleaned event files. If a bin has >2000 counts, and if more than 50% of those come from <1% of pixels, then it is considered to be noise-dominated and hence unusable.
| Quadrant | # 1 sec bins | Bins with >0 counts | Bins with >2000 counts | High rate bins dominated by noise | Noise dominated (total time) | Noise dominated (detector-on time) | Marked lightcurve |
|---|---|---|---|---|---|---|---|
| A | 7019 | 5047 | 23 | 23 | 0.33% | 0.46% | 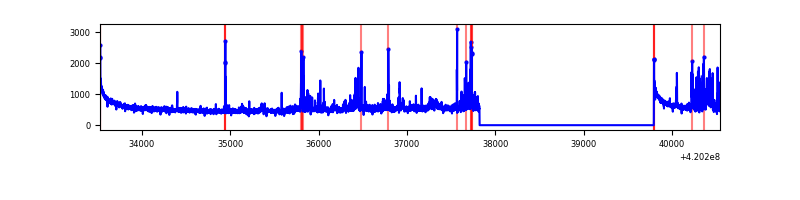 |
| B | 7019 | 5047 | 19 | 19 | 0.27% | 0.38% | 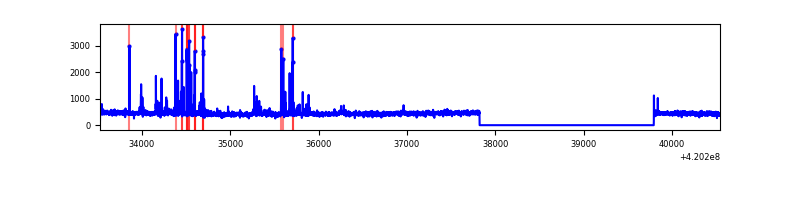 |
| C | 7019 | 5047 | 121 | 121 | 1.72% | 2.40% | 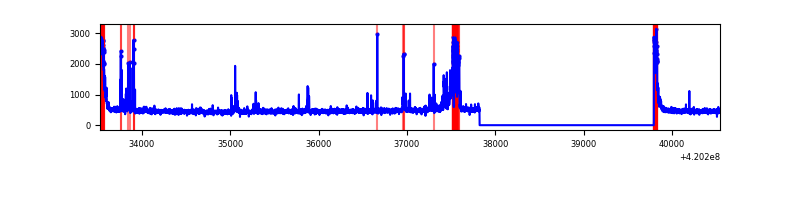 |
| D | 7019 | 5047 | 165 | 165 | 2.35% | 3.27% | 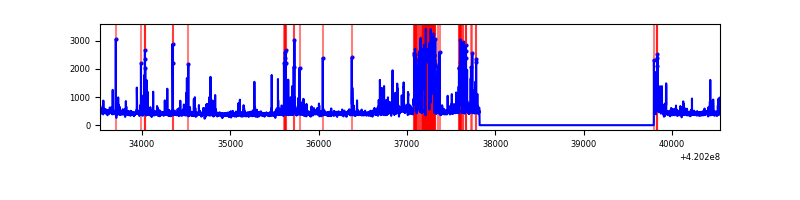 |
Top three noisy pixels from each quadrant. If the there are fewer than three noisy pixels in the level2.evt file, extra rows are filled as -1
| Pixel properties | Quadrant properties | ||||||
|---|---|---|---|---|---|---|---|
| Quadrant | DetID | PixID | Counts | Sigma | Mean | Median | Sigma |
| A | 10 | 83 | 472855 | 4170.55 | 553 | 542 | 113.2 |
| A | 12 | 189 | 232495 | 2048.16 | 553 | 542 | 113.2 |
| A | 13 | 248 | 154254 | 1357.29 | 553 | 542 | 113.2 |
| B | 5 | 255 | 153486 | 1457.32 | 548 | 533 | 105.0 |
| B | 0 | 190 | 17813 | 164.64 | 548 | 533 | 105.0 |
| B | 12 | 111 | 13354 | 122.16 | 548 | 533 | 105.0 |
| C | 14 | 254 | 240687 | 1921.07 | 535 | 539 | 125.0 |
| C | 0 | 10 | 229405 | 1830.81 | 535 | 539 | 125.0 |
| C | 15 | 214 | 219199 | 1749.17 | 535 | 539 | 125.0 |
| D | 12 | 233 | 392992 | 3009.87 | 532 | 515 | 130.4 |
| D | 2 | 249 | 207603 | 1588.14 | 532 | 515 | 130.4 |
| D | 13 | 249 | 103683 | 791.19 | 532 | 515 | 130.4 |
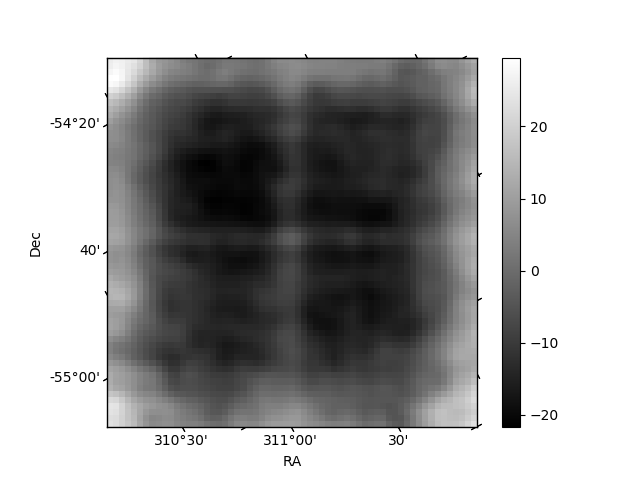
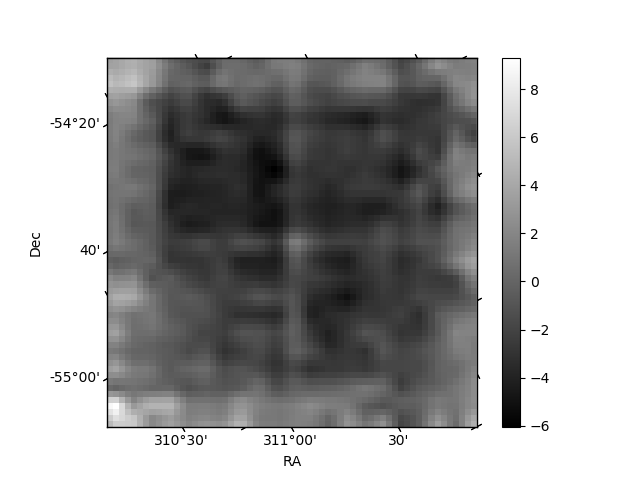
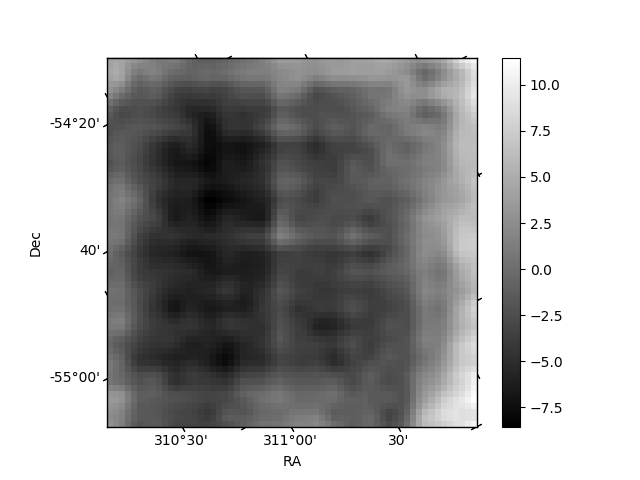
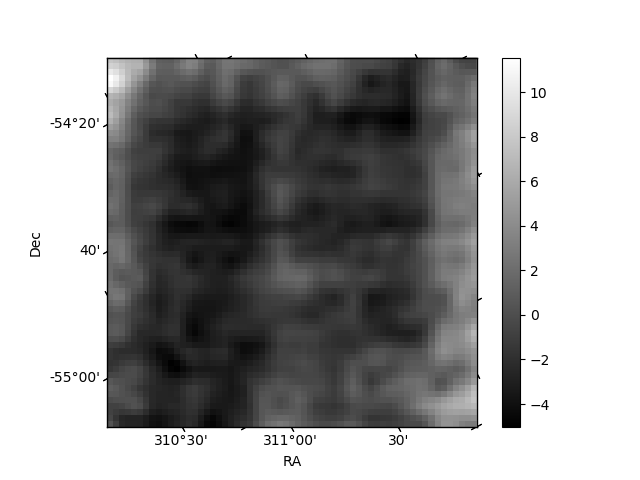
Histogram calculated using DETX and DETY for each event in the final _common_clean file
| Quadrant A | 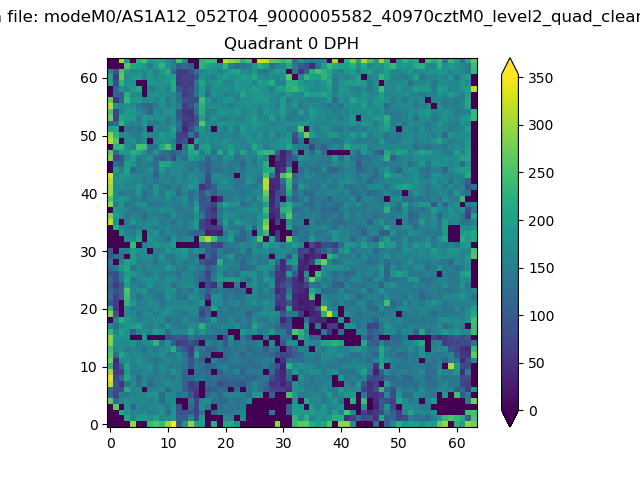 |
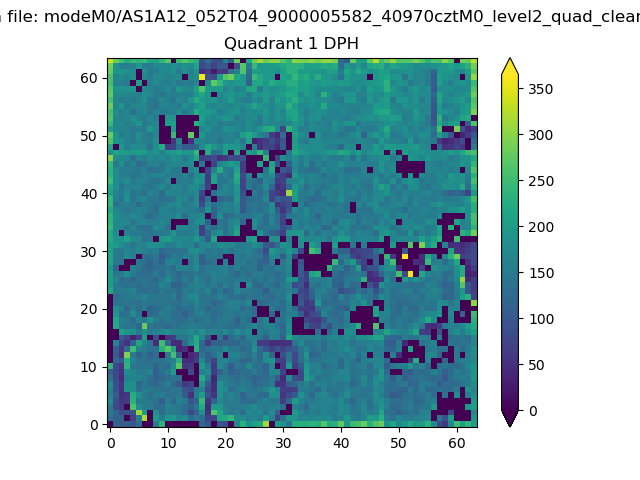 |
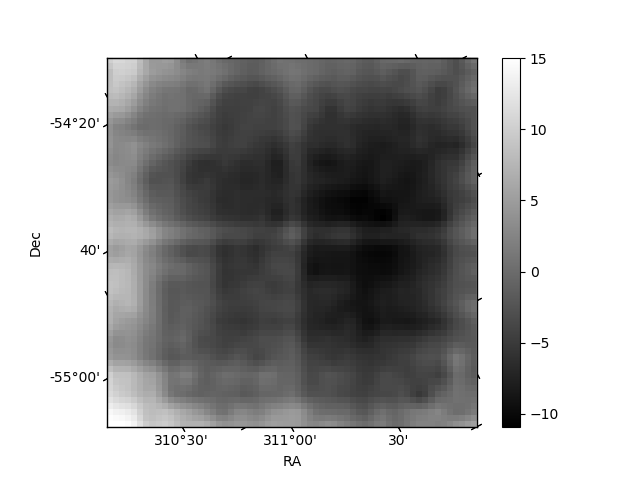
Quadrant B |
|---|---|---|---|
| Quadrant D | 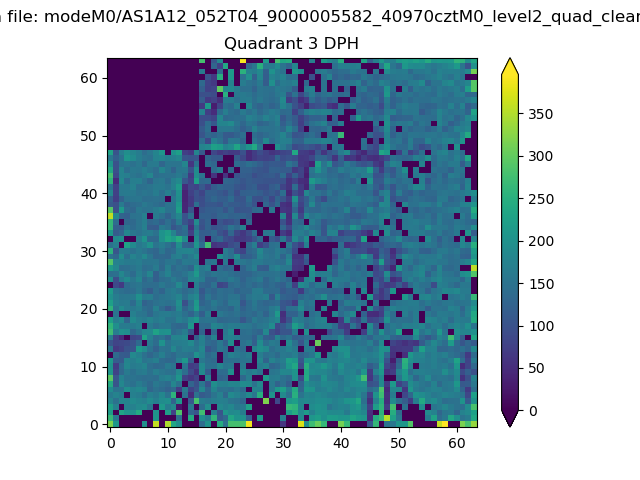 |
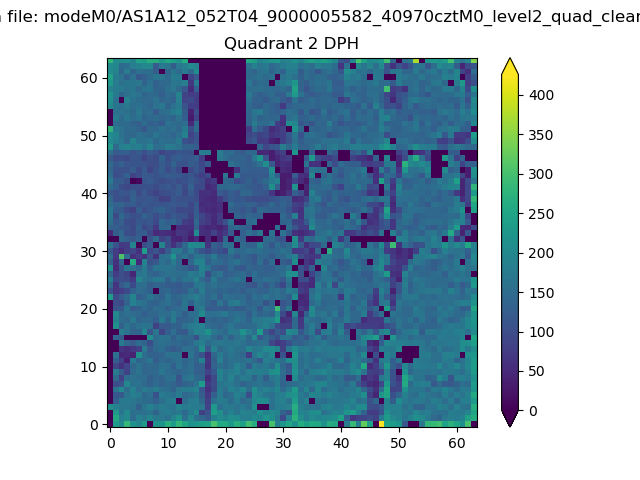 |
Quadrant C |
| Plot type | Count rate plots | Images |
|---|---|---|
| Comparison with Poisson distribution Blue bars denote a histogram of data divided into 1 sec bins. Red curve is a Poisson curve with rate = median count rate of data. |
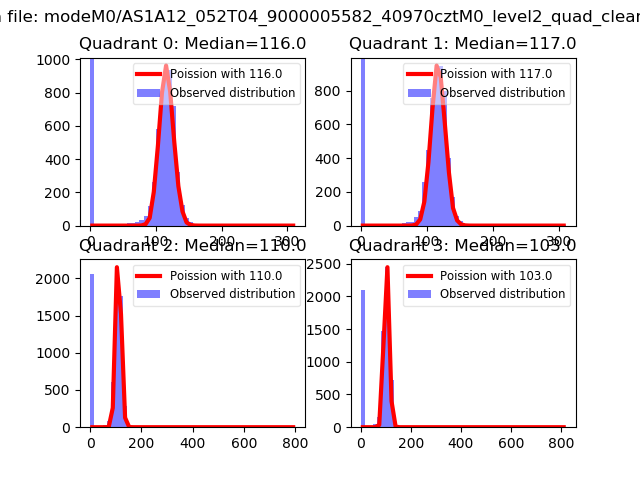 |
 |
| Quadrant-wise count rates Data is divided into 100 sec bins |
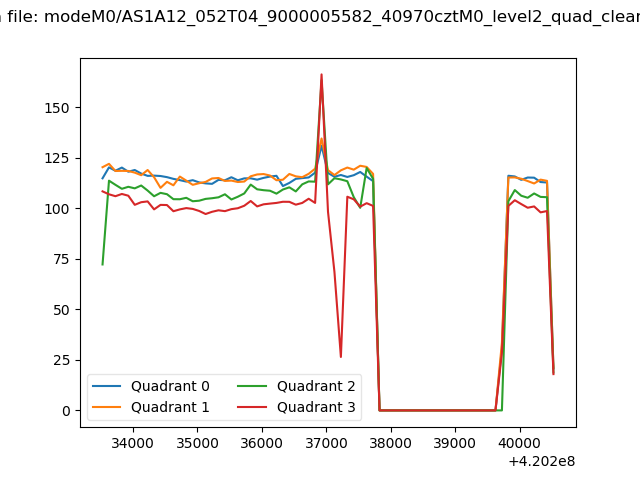 |
|
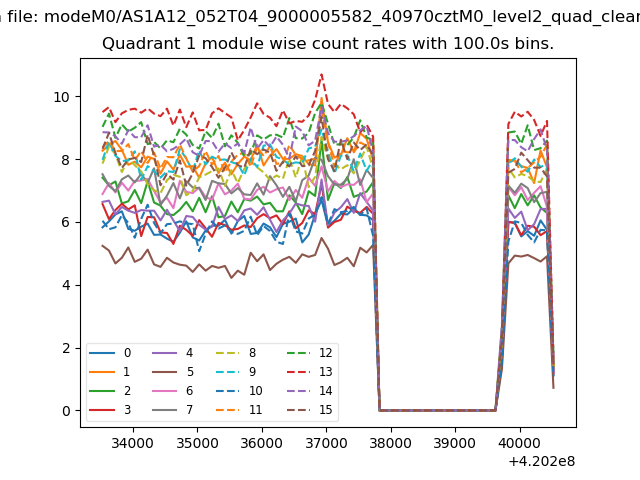
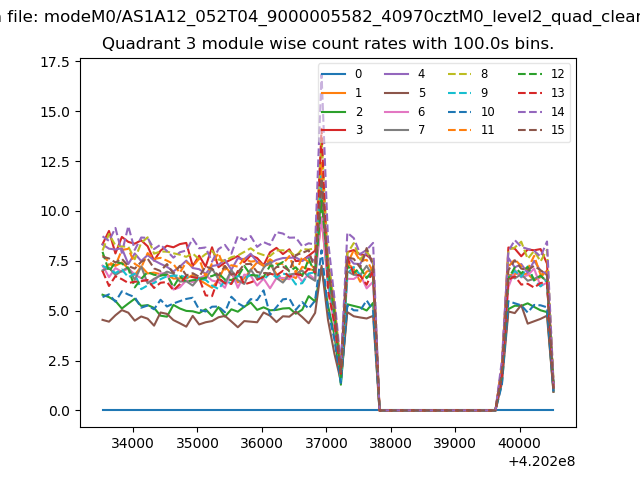
| Module-wise count rates for Quadrant A Data is divided into 100 sec bins |
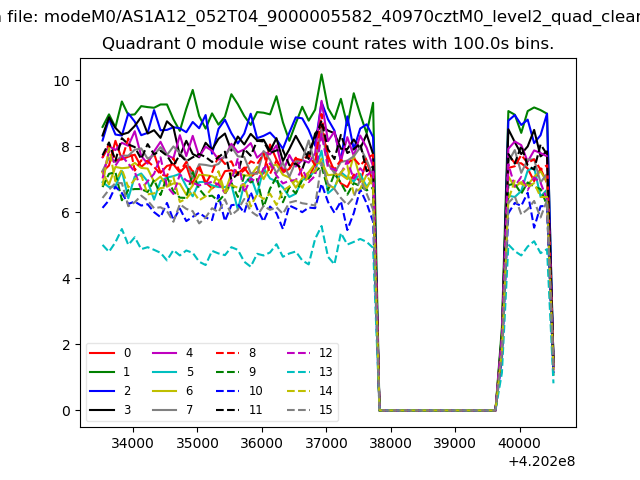 |
 |
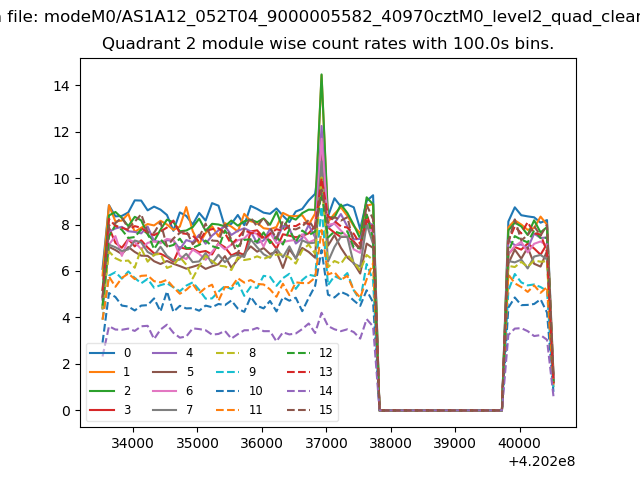
| Module-wise count rates for Quadrant B Data is divided into 100 sec bins |
 |
 |
| Module-wise count rates for Quadrant C Data is divided into 100 sec bins |
 |
 |
| Module-wise count rates for Quadrant D Data is divided into 100 sec bins |
 |
 |
| Parameter | Plot |
|---|---|
| CZT HV Monitor |  |
| D_VDD | 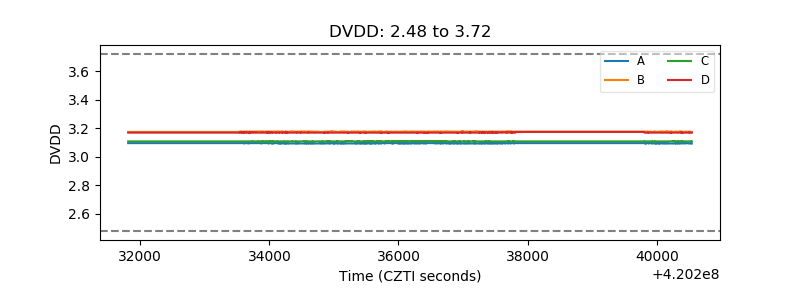 |
| Temperature 1 | 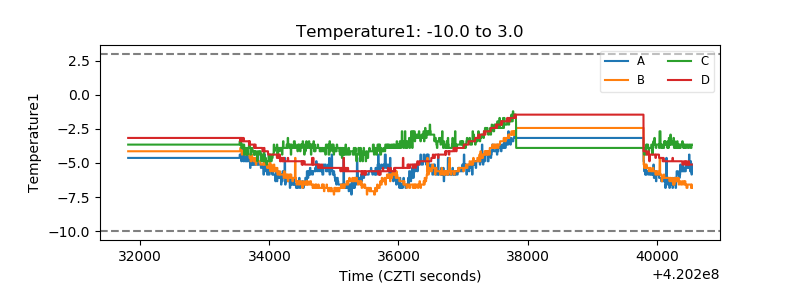 |
| Veto HV Monitor | 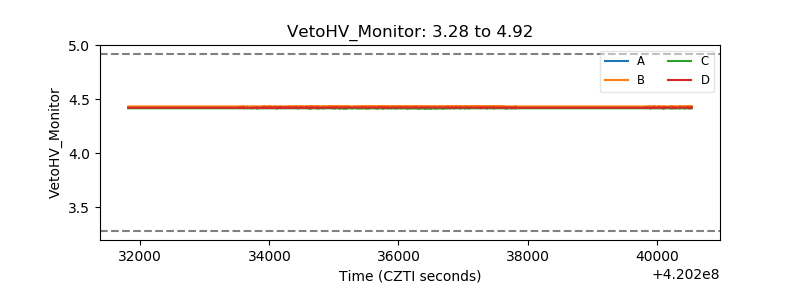 |
| Veto LLD | 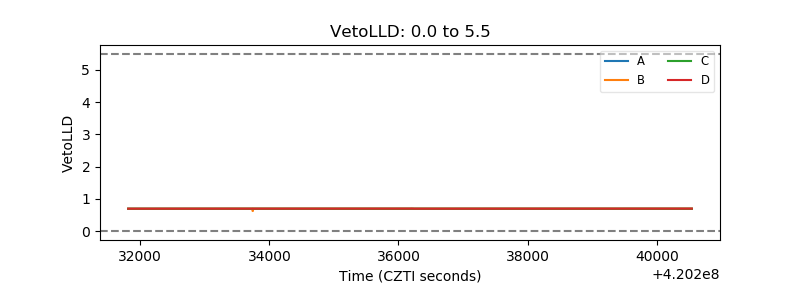 |
| Alpha Counter | 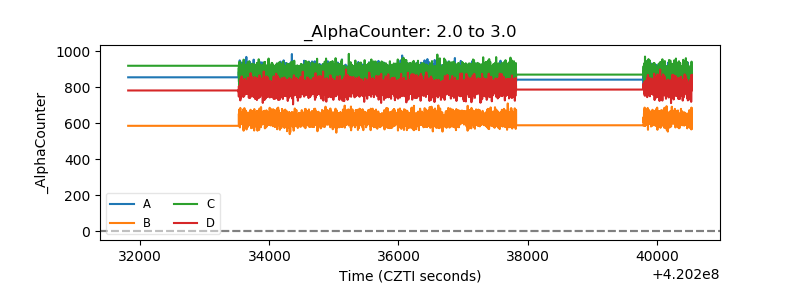 |
| _CPM_Rate | 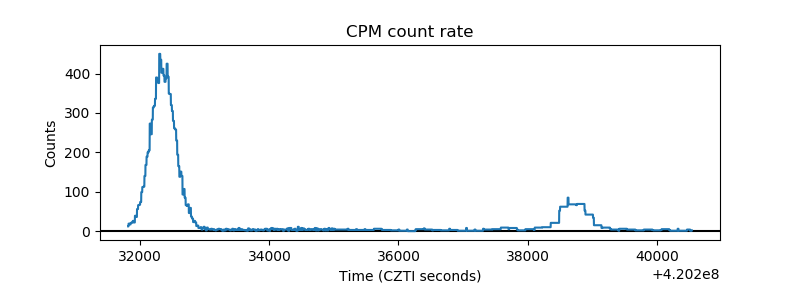 |
| CZT Counter | 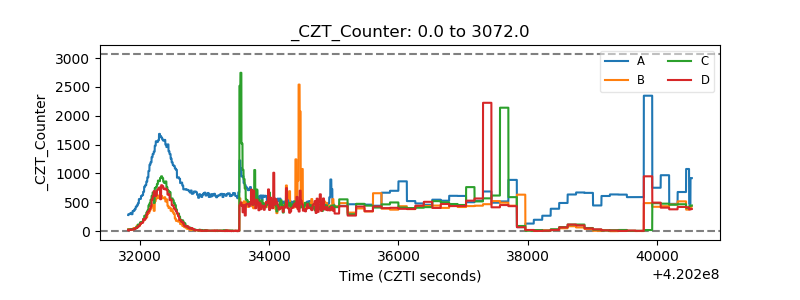 |
| +2.5 Volts monitor | 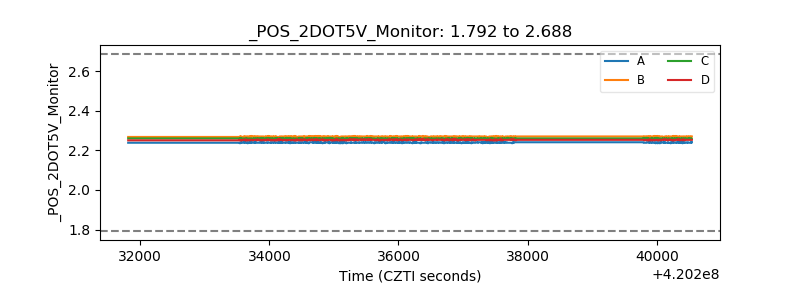 |
| +5 Volts monitor | 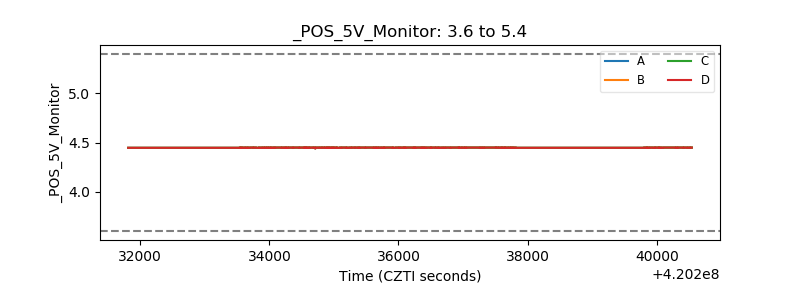 |
| _ROLL_ROT | 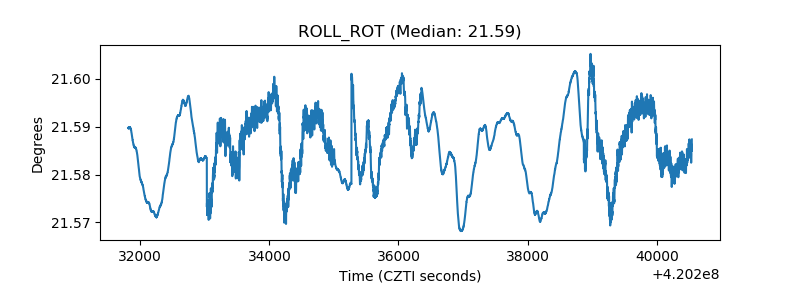 |
| _Roll_DEC | 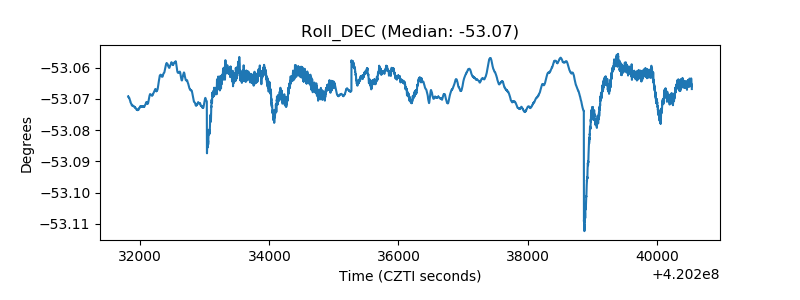 |
| _Roll_RA | 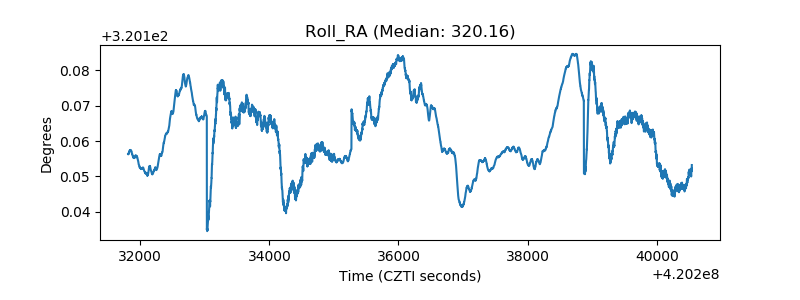 |
| Veto Counter | 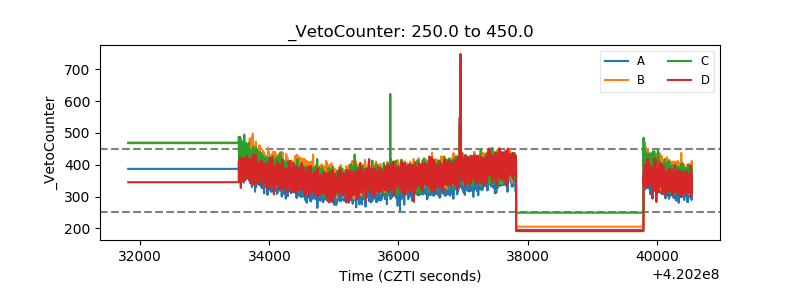 |