| Param | Original file | Final file |
|---|---|---|
| Filename | modeM0/AS1A12_052T04_9000005582_40971cztM0_level2.fits | modeM0/AS1A12_052T04_9000005582_40971cztM0_level2_quad_clean.evt |
| Size (bytes) | 306,619,200 | 89,530,560 |
| Size | 292.4 MB | 85.4 MB |
| Events in quadrant A | 3,112,335 | 607,431 |
| Events in quadrant B | 2,460,774 | 613,725 |
| Events in quadrant C | 2,695,251 | 574,457 |
| Events in quadrant D | 2,658,665 | 535,635 |
| Mode M9 | |||
|---|---|---|---|
| Quadrant | BADHDUFLAG | Total packets | Discarded packets |
| A | 0 | 32 | 0 |
| B | 0 | 32 | 0 |
| C | 0 | 32 | 0 |
| D | 0 | 33 | 0 |
| Mode SS | |||
|---|---|---|---|
| Quadrant | BADHDUFLAG | Total packets | Discarded packets |
| A | 0 | 110 | 0 |
| B | 0 | 110 | 0 |
| C | 0 | 110 | 0 |
| D | 0 | 110 | 0 |
| Mode M0 | |||
|---|---|---|---|
| Quadrant | BADHDUFLAG | Total packets | Discarded packets |
| A | 0 | 12624 | 3 |
| B | 0 | 11345 | 2 |
| C | 0 | 11523 | 2 |
| D | 0 | 11981 | 2 |
| Quadrant | Total seconds | Saturated seconds | Saturation percentage |
|---|---|---|---|
| A | 5426 | 16 | 0.294877% |
| B | 5426 | 34 | 0.626613% |
| C | 5426 | 58 | 1.068927% |
| D | 5426 | 86 | 1.584961% |
Noise dominated data is calculated using 1-second bins in cleaned event files. If a bin has >2000 counts, and if more than 50% of those come from <1% of pixels, then it is considered to be noise-dominated and hence unusable.
| Quadrant | # 1 sec bins | Bins with >0 counts | Bins with >2000 counts | High rate bins dominated by noise | Noise dominated (total time) | Noise dominated (detector-on time) | Marked lightcurve |
|---|---|---|---|---|---|---|---|
| A | 7099 | 5427 | 10 | 10 | 0.14% | 0.18% | 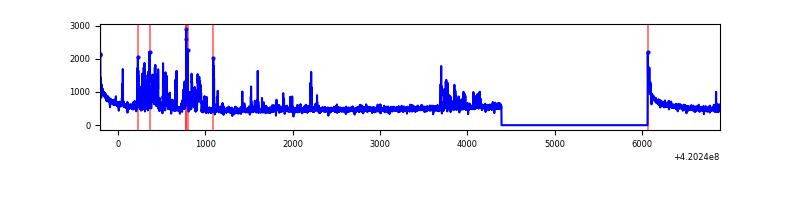 |
| B | 7099 | 5426 | 19 | 19 | 0.27% | 0.35% | 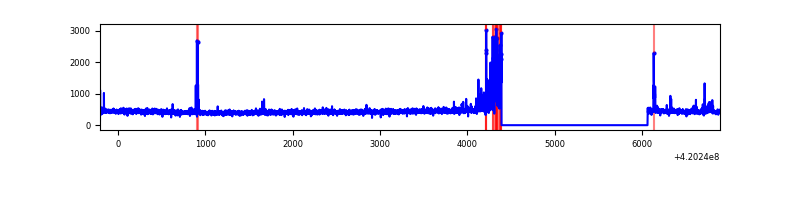 |
| C | 7099 | 5427 | 56 | 56 | 0.79% | 1.03% | 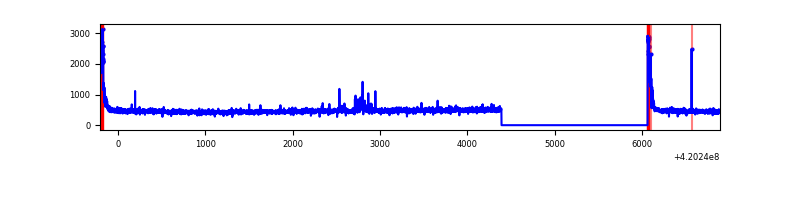 |
| D | 7099 | 5427 | 70 | 70 | 0.99% | 1.29% | 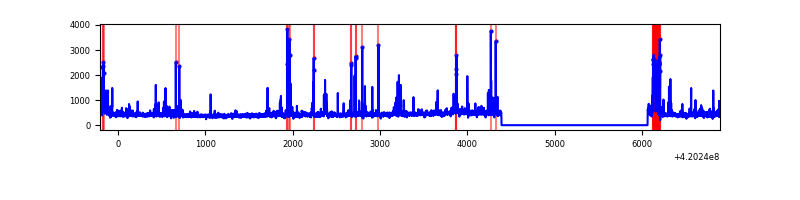 |
Top three noisy pixels from each quadrant. If the there are fewer than three noisy pixels in the level2.evt file, extra rows are filled as -1
| Pixel properties | Quadrant properties | ||||||
|---|---|---|---|---|---|---|---|
| Quadrant | DetID | PixID | Counts | Sigma | Mean | Median | Sigma |
| A | 10 | 83 | 488574 | 4033.05 | 588 | 577 | 121.0 |
| A | 12 | 189 | 222819 | 1836.72 | 588 | 577 | 121.0 |
| A | 13 | 248 | 122867 | 1010.67 | 588 | 577 | 121.0 |
| B | 0 | 186 | 86509 | 764.91 | 582 | 566 | 112.4 |
| B | 5 | 255 | 83984 | 742.43 | 582 | 566 | 112.4 |
| B | 12 | 111 | 14321 | 122.42 | 582 | 566 | 112.4 |
| C | 15 | 214 | 235621 | 1750.66 | 572 | 576 | 134.3 |
| C | 0 | 10 | 185801 | 1379.59 | 572 | 576 | 134.3 |
| C | 14 | 254 | 34879 | 255.49 | 572 | 576 | 134.3 |
| D | 2 | 249 | 308208 | 2190.03 | 573 | 556 | 140.5 |
| D | 12 | 233 | 96225 | 681.02 | 573 | 556 | 140.5 |
| D | 13 | 249 | 26392 | 183.91 | 573 | 556 | 140.5 |
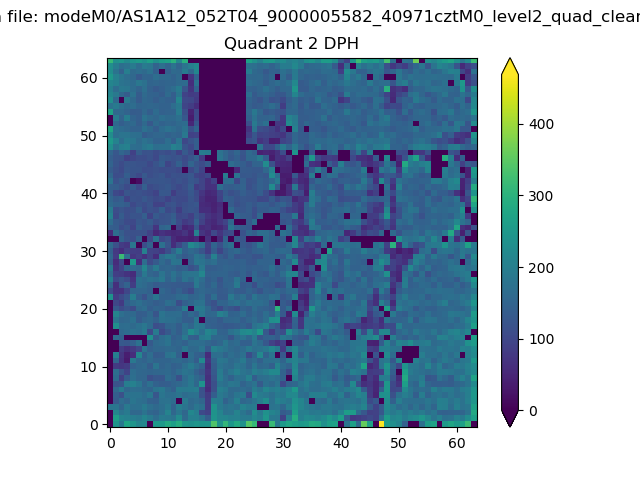
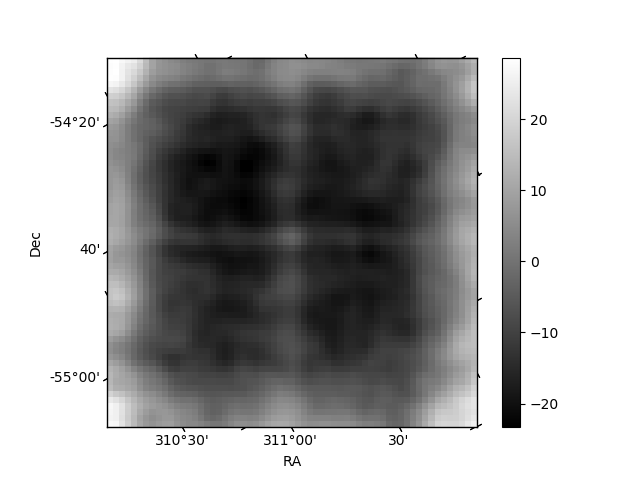
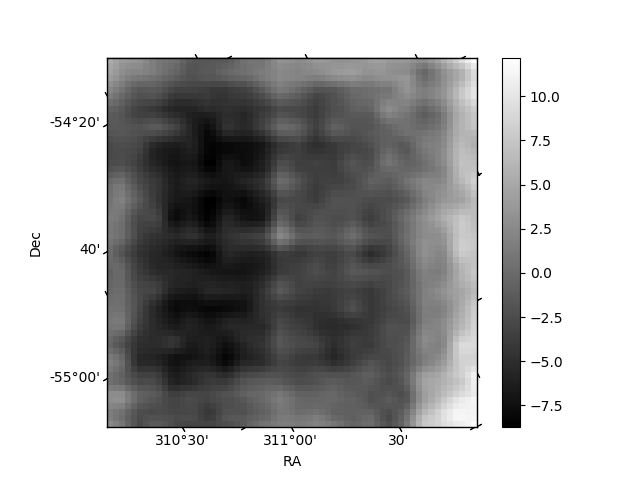
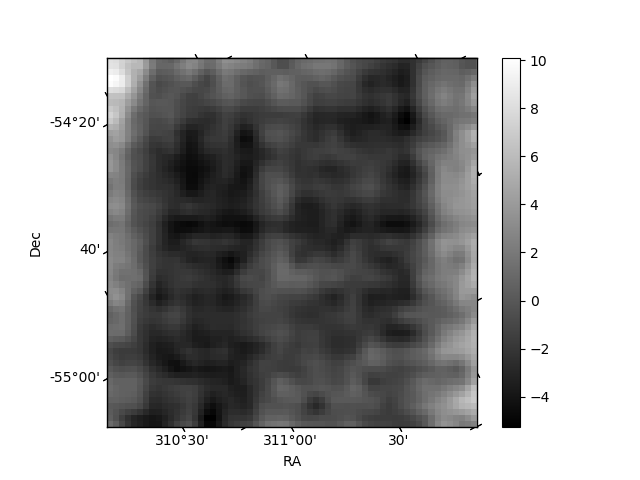
Histogram calculated using DETX and DETY for each event in the final _common_clean file
| Quadrant A | 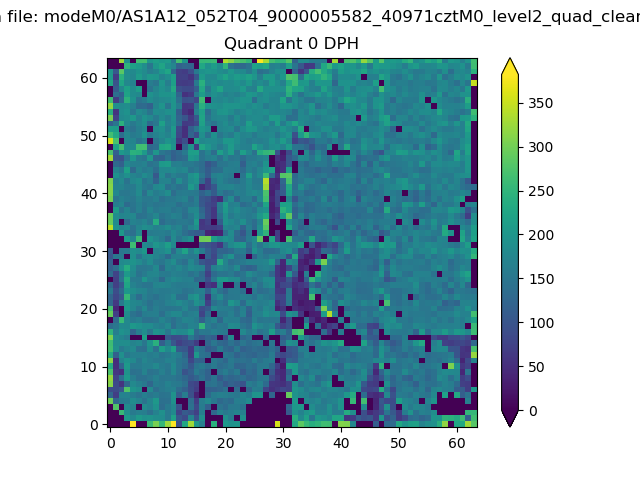 |
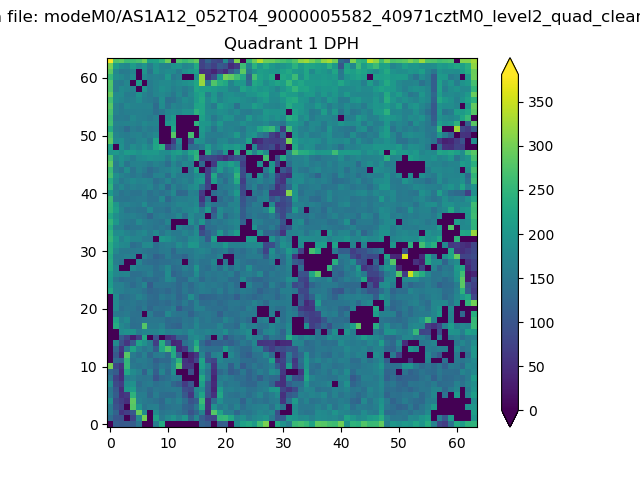 |
Quadrant B |
|---|---|---|---|
| Quadrant D | 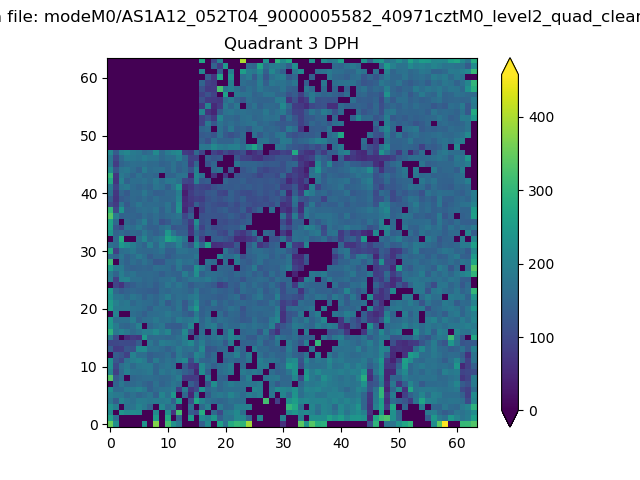 |
 |
Quadrant C |
| Plot type | Count rate plots | Images |
|---|---|---|
| Comparison with Poisson distribution Blue bars denote a histogram of data divided into 1 sec bins. Red curve is a Poisson curve with rate = median count rate of data. |
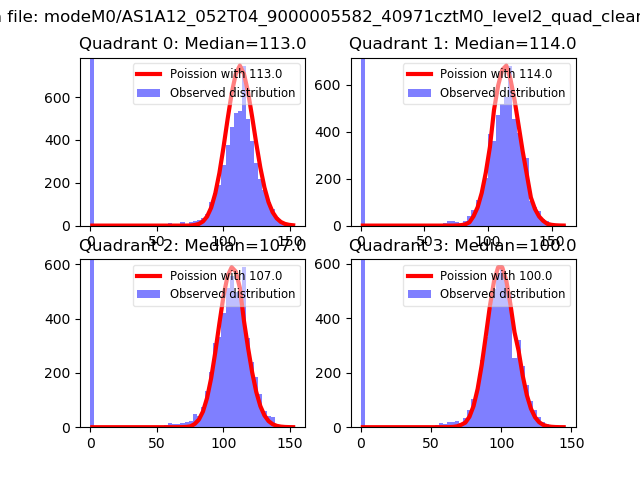 |
 |
| Quadrant-wise count rates Data is divided into 100 sec bins |
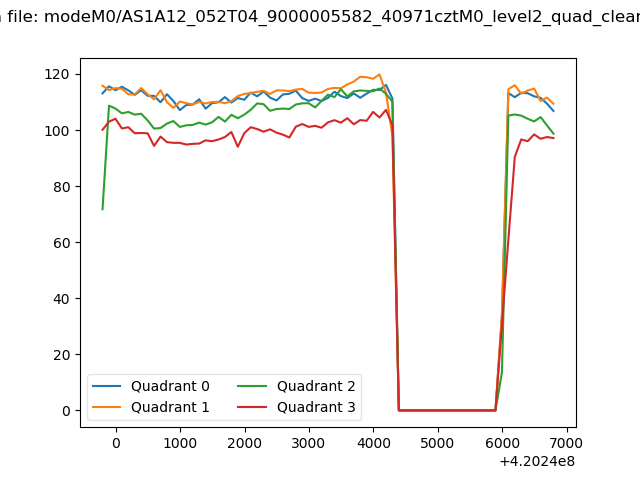 |
|
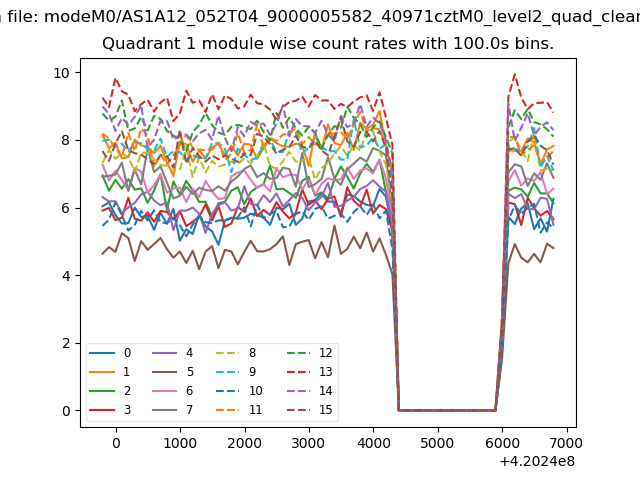
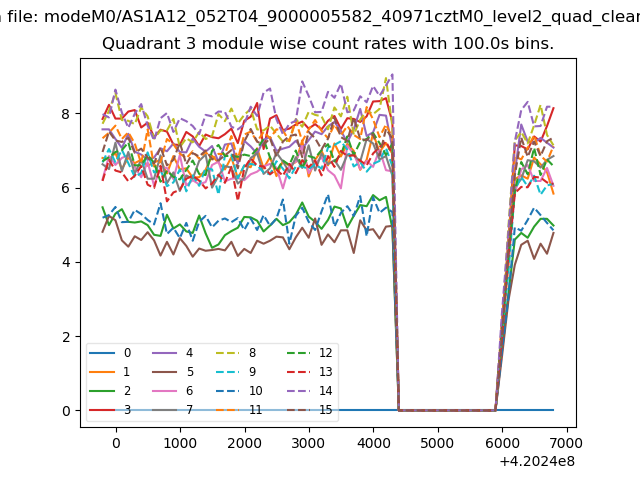
| Module-wise count rates for Quadrant A Data is divided into 100 sec bins |
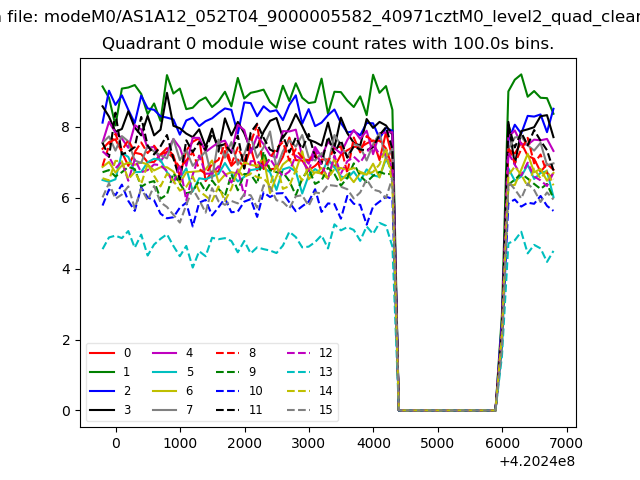 |
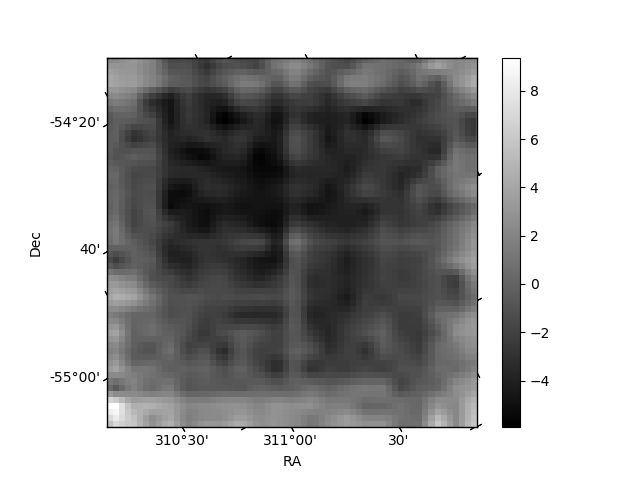 |
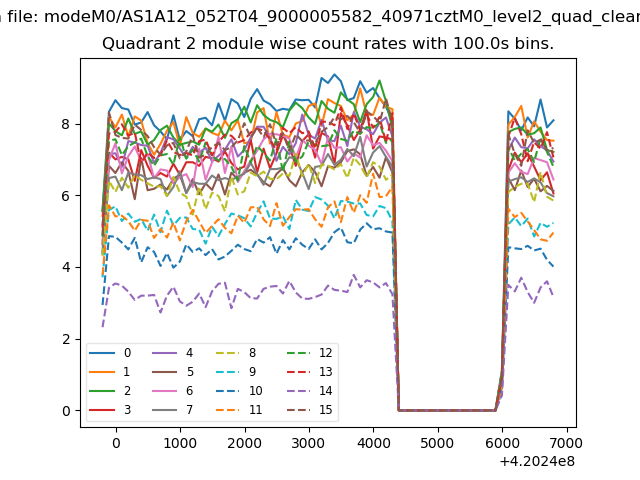
| Module-wise count rates for Quadrant B Data is divided into 100 sec bins |
 |
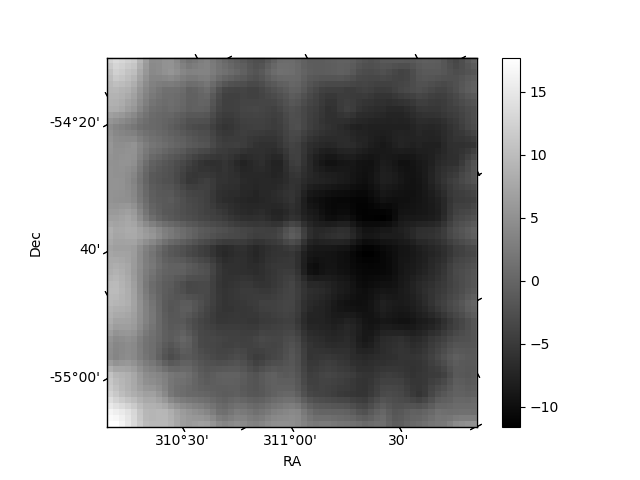 |
| Module-wise count rates for Quadrant C Data is divided into 100 sec bins |
 |
 |
| Module-wise count rates for Quadrant D Data is divided into 100 sec bins |
 |
 |
| Parameter | Plot |
|---|---|
| CZT HV Monitor | 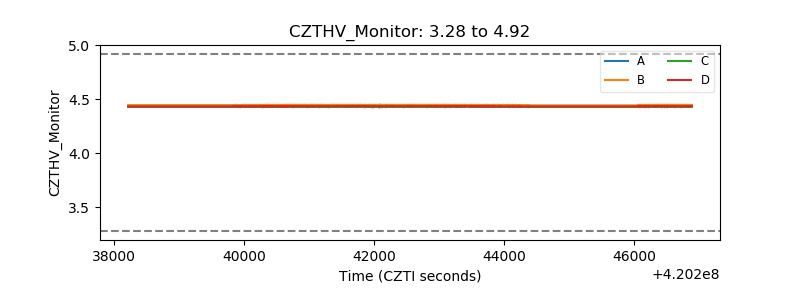 |
| D_VDD | 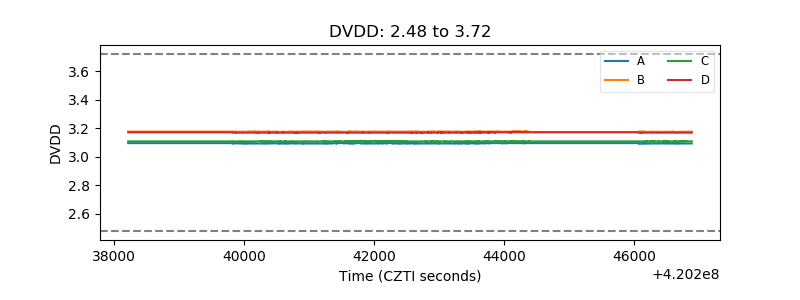 |
| Temperature 1 | 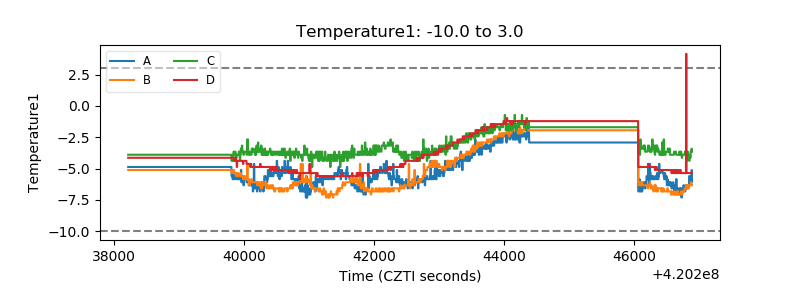 |
| Veto HV Monitor | 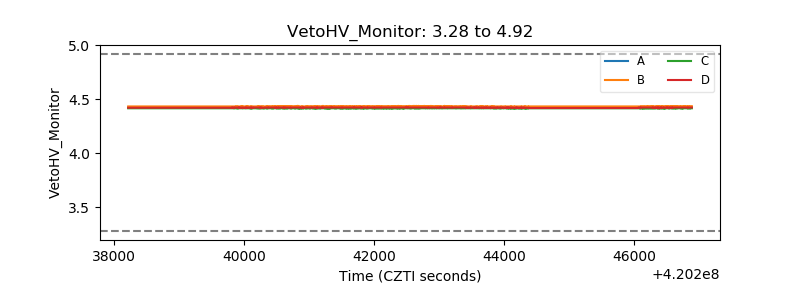 |
| Veto LLD | 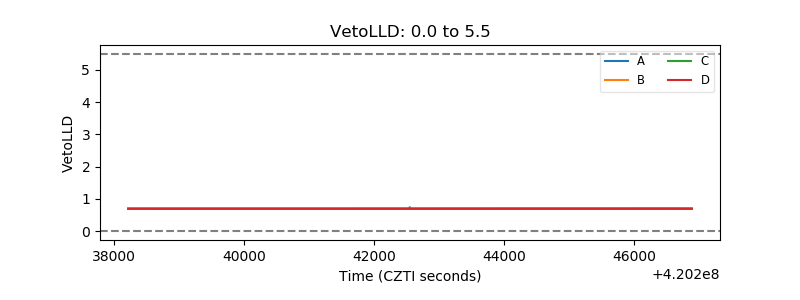 |
| Alpha Counter | 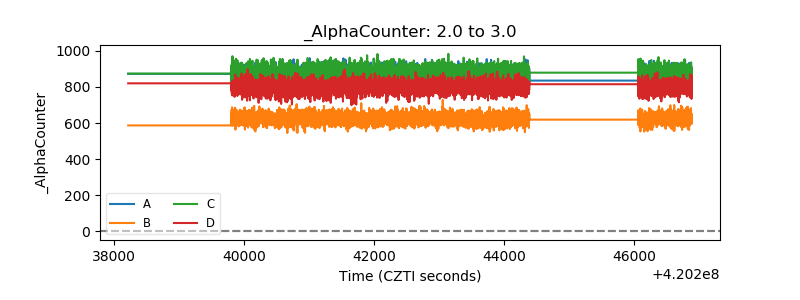 |
| _CPM_Rate | 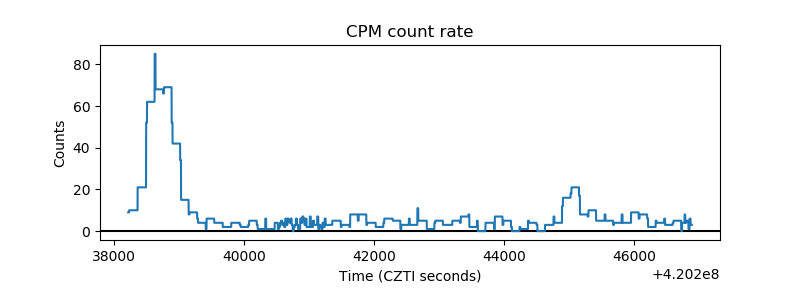 |
| CZT Counter | 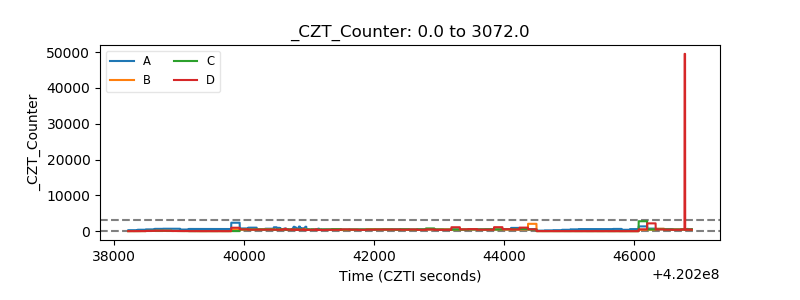 |
| +2.5 Volts monitor | 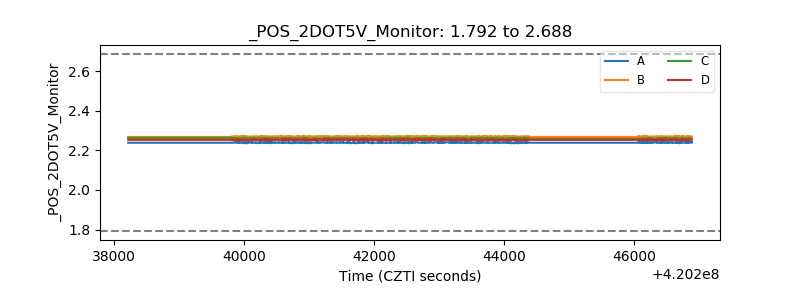 |
| +5 Volts monitor | 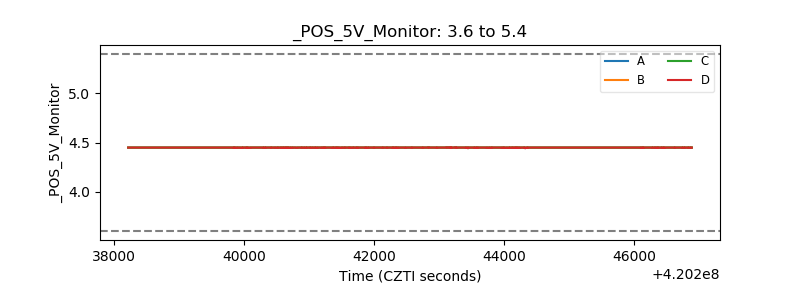 |
| _ROLL_ROT | 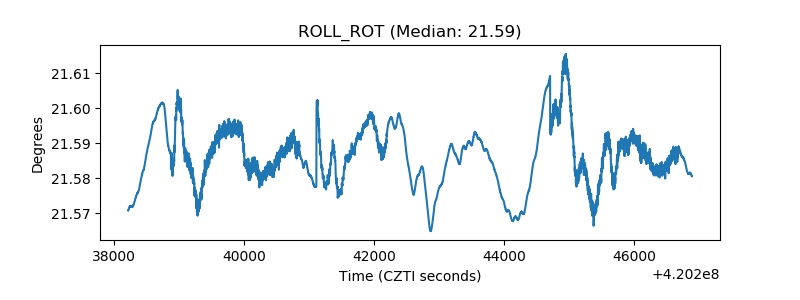 |
| _Roll_DEC | 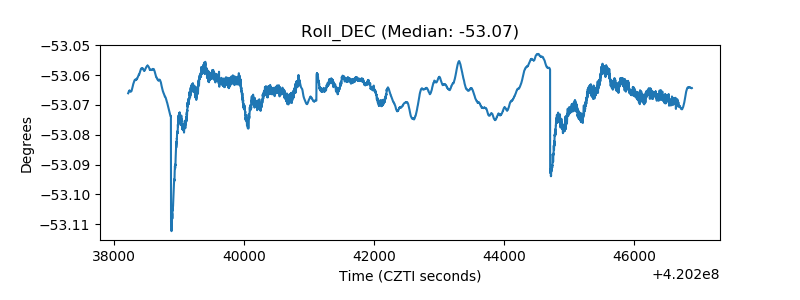 |
| _Roll_RA | 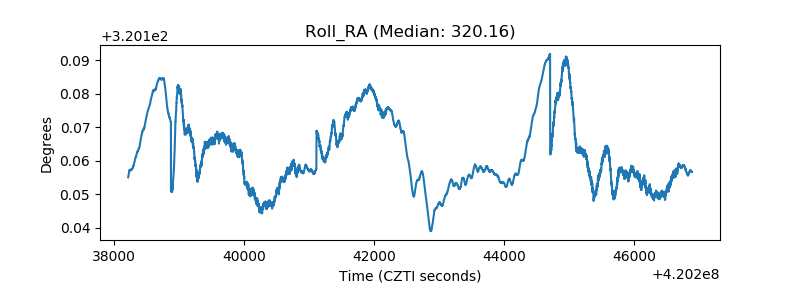 |
| Veto Counter | 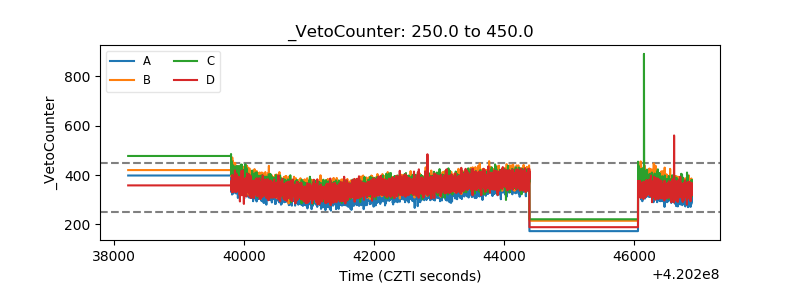 |