| Param | Original file | Final file |
|---|---|---|
| Filename | modeM0/AS1A12_052T04_9000005582_40972cztM0_level2.fits | modeM0/AS1A12_052T04_9000005582_40972cztM0_level2_quad_clean.evt |
| Size (bytes) | 324,734,400 | 93,971,520 |
| Size | 309.7 MB | 89.6 MB |
| Events in quadrant A | 3,169,748 | 633,502 |
| Events in quadrant B | 2,698,497 | 642,648 |
| Events in quadrant C | 2,812,430 | 604,428 |
| Events in quadrant D | 2,891,647 | 562,605 |
| Mode M9 | |||
|---|---|---|---|
| Quadrant | BADHDUFLAG | Total packets | Discarded packets |
| A | 0 | 25 | 0 |
| B | 0 | 25 | 0 |
| C | 0 | 25 | 0 |
| D | 0 | 26 | 0 |
| Mode SS | |||
|---|---|---|---|
| Quadrant | BADHDUFLAG | Total packets | Discarded packets |
| A | 0 | 118 | 0 |
| B | 0 | 118 | 0 |
| C | 0 | 118 | 0 |
| D | 0 | 118 | 0 |
| Mode M0 | |||
|---|---|---|---|
| Quadrant | BADHDUFLAG | Total packets | Discarded packets |
| A | 0 | 13005 | 3 |
| B | 0 | 12208 | 2 |
| C | 0 | 12045 | 2 |
| D | 0 | 12791 | 2 |
| Quadrant | Total seconds | Saturated seconds | Saturation percentage |
|---|---|---|---|
| A | 5751 | 13 | 0.226048% |
| B | 5751 | 56 | 0.973744% |
| C | 5751 | 50 | 0.869414% |
| D | 5751 | 84 | 1.460616% |
Noise dominated data is calculated using 1-second bins in cleaned event files. If a bin has >2000 counts, and if more than 50% of those come from <1% of pixels, then it is considered to be noise-dominated and hence unusable.
| Quadrant | # 1 sec bins | Bins with >0 counts | Bins with >2000 counts | High rate bins dominated by noise | Noise dominated (total time) | Noise dominated (detector-on time) | Marked lightcurve |
|---|---|---|---|---|---|---|---|
| A | 7155 | 5752 | 4 | 4 | 0.06% | 0.07% | 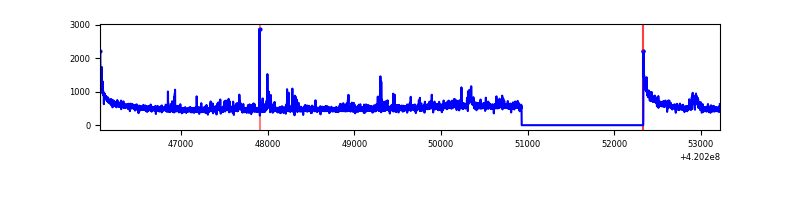 |
| B | 7154 | 5751 | 43 | 43 | 0.60% | 0.75% | 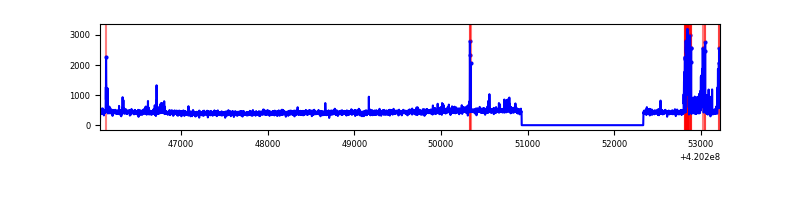 |
| C | 7155 | 5752 | 49 | 49 | 0.68% | 0.85% | 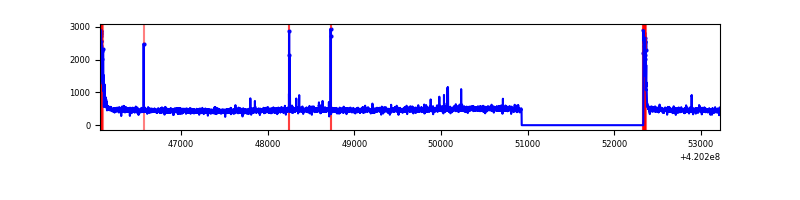 |
| D | 7155 | 5752 | 74 | 74 | 1.03% | 1.29% | 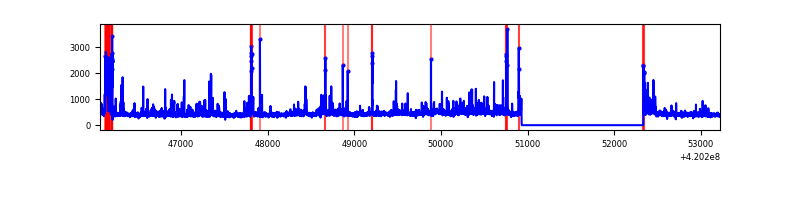 |
Top three noisy pixels from each quadrant. If the there are fewer than three noisy pixels in the level2.evt file, extra rows are filled as -1
| Pixel properties | Quadrant properties | ||||||
|---|---|---|---|---|---|---|---|
| Quadrant | DetID | PixID | Counts | Sigma | Mean | Median | Sigma |
| A | 10 | 83 | 511915 | 3999.42 | 625 | 611 | 127.8 |
| A | 12 | 189 | 189093 | 1474.31 | 625 | 611 | 127.8 |
| A | 13 | 248 | 36858 | 283.52 | 625 | 611 | 127.8 |
| B | 5 | 255 | 251330 | 2058.37 | 619 | 599 | 121.8 |
| B | 12 | 111 | 15512 | 122.43 | 619 | 599 | 121.8 |
| B | 11 | 111 | 14281 | 112.32 | 619 | 599 | 121.8 |
| C | 15 | 214 | 248543 | 1747.23 | 609 | 614 | 141.9 |
| C | 0 | 10 | 156480 | 1098.43 | 609 | 614 | 141.9 |
| C | 14 | 254 | 17955 | 122.21 | 609 | 614 | 141.9 |
| D | 2 | 249 | 212663 | 1434.23 | 609 | 592 | 147.9 |
| D | 13 | 249 | 120266 | 809.35 | 609 | 592 | 147.9 |
| D | 12 | 233 | 74855 | 502.24 | 609 | 592 | 147.9 |
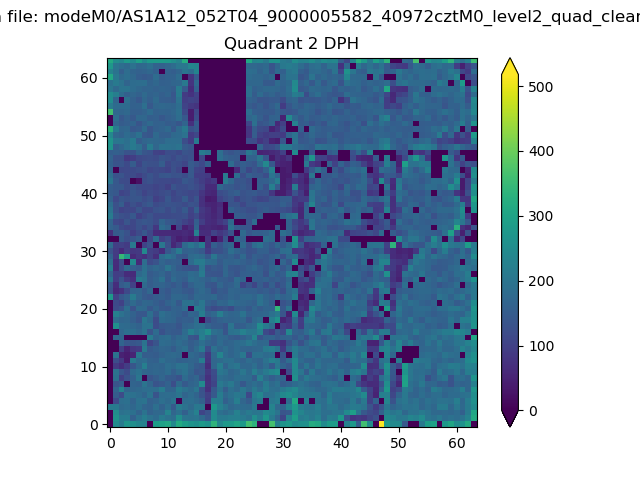
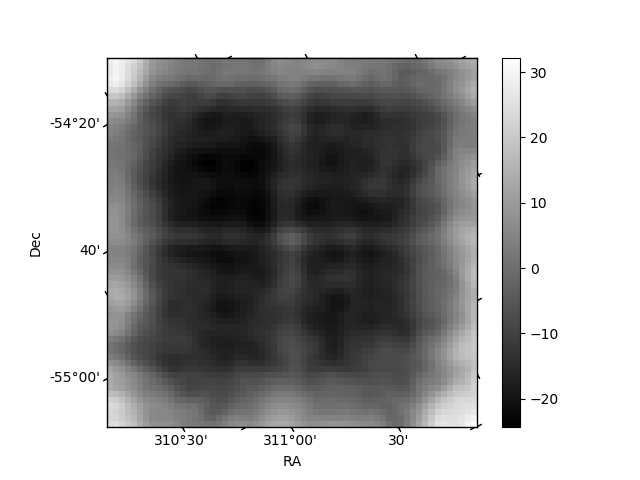
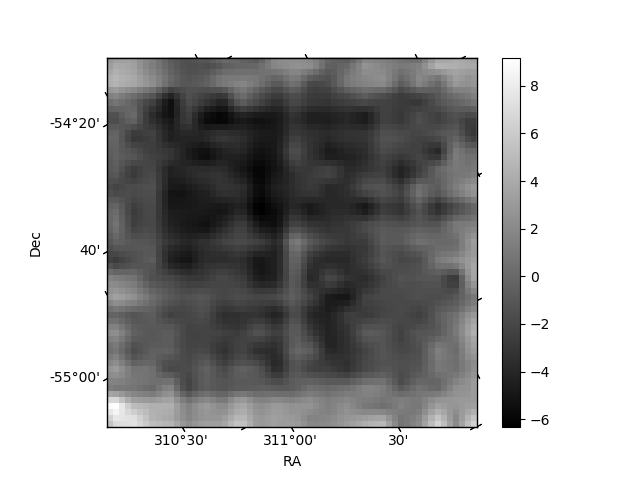
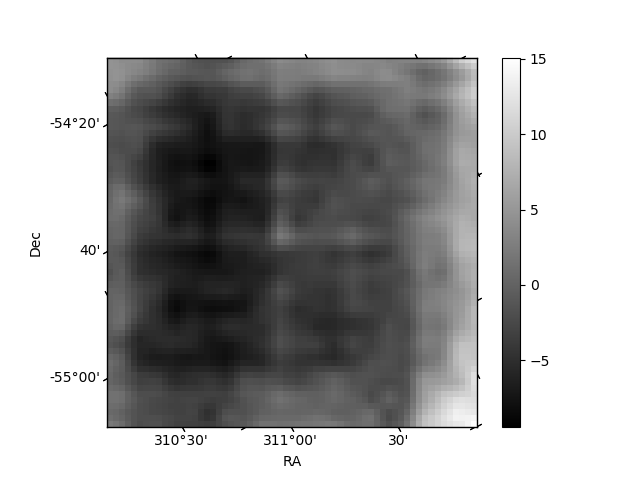
Histogram calculated using DETX and DETY for each event in the final _common_clean file
| Quadrant A | 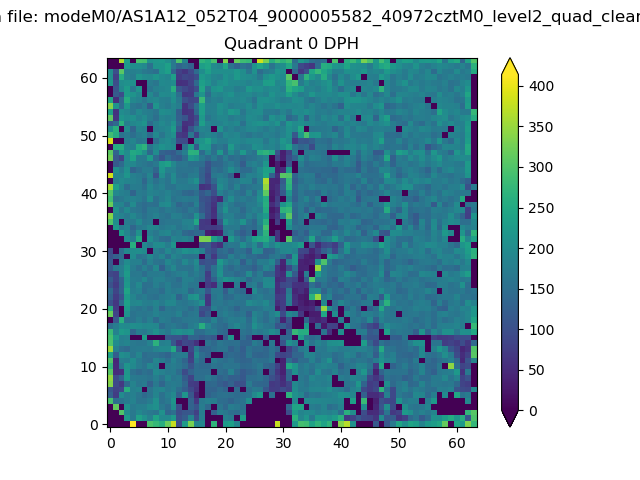 |
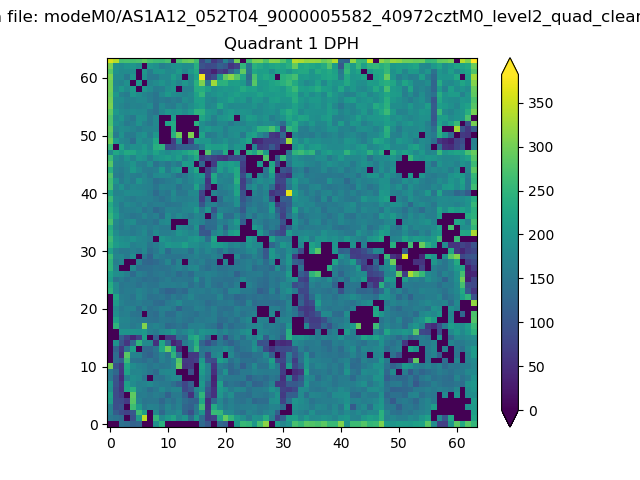 |
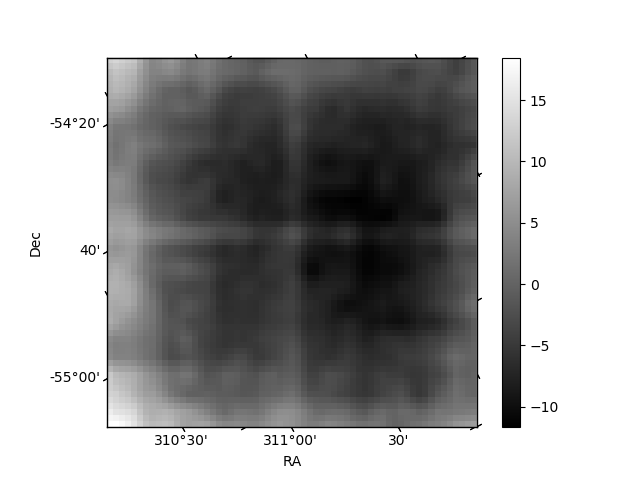
Quadrant B |
|---|---|---|---|
| Quadrant D | 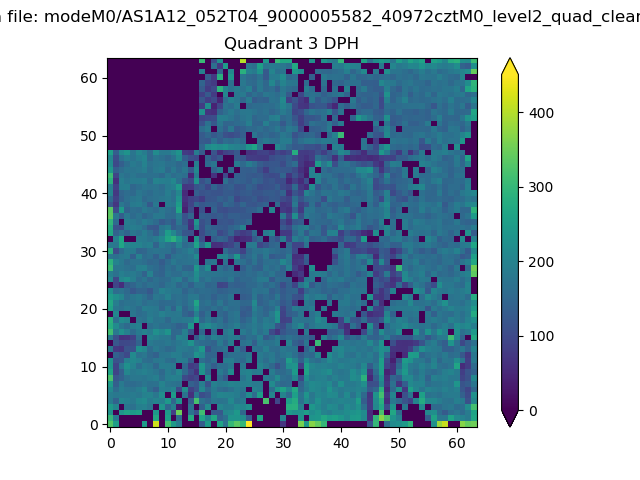 |
 |
Quadrant C |
| Plot type | Count rate plots | Images |
|---|---|---|
| Comparison with Poisson distribution Blue bars denote a histogram of data divided into 1 sec bins. Red curve is a Poisson curve with rate = median count rate of data. |
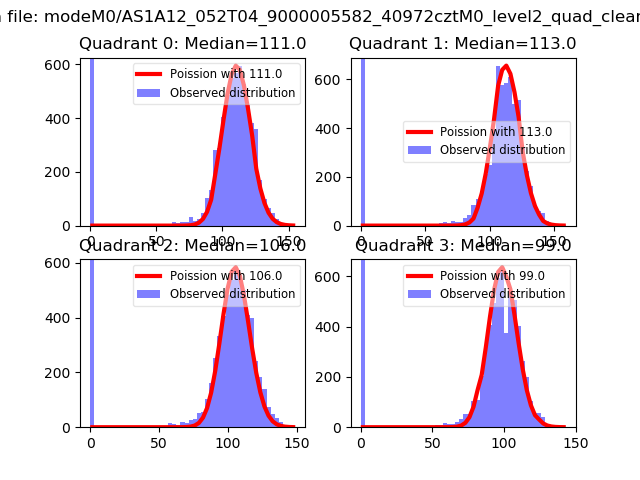 |
 |
| Quadrant-wise count rates Data is divided into 100 sec bins |
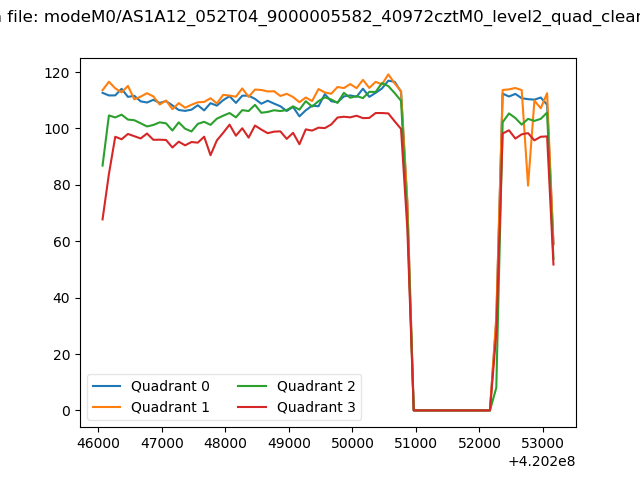 |
|
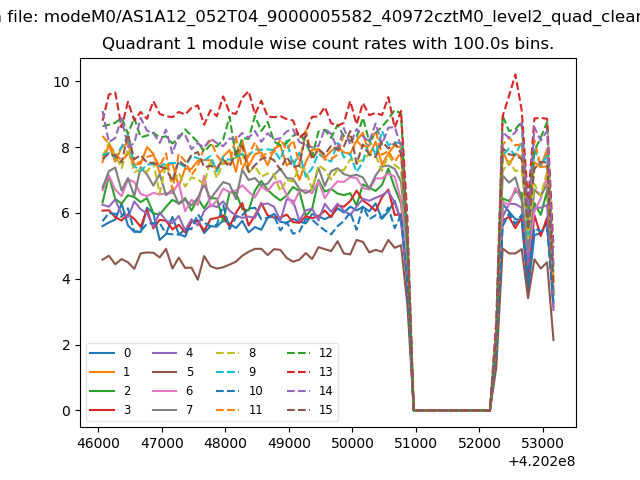
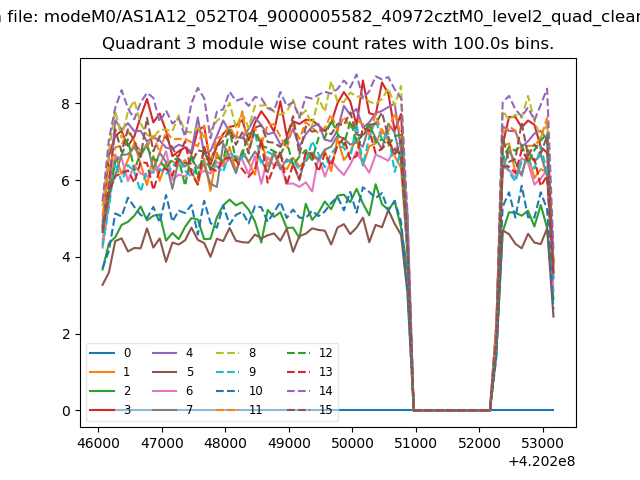
| Module-wise count rates for Quadrant A Data is divided into 100 sec bins |
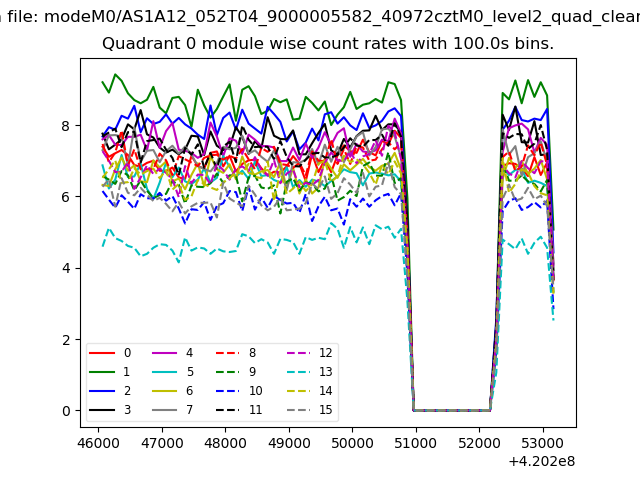 |
 |
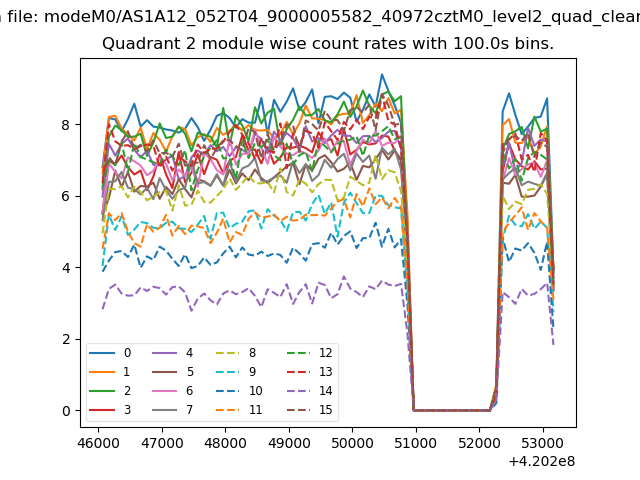
| Module-wise count rates for Quadrant B Data is divided into 100 sec bins |
 |
 |
| Module-wise count rates for Quadrant C Data is divided into 100 sec bins |
 |
 |
| Module-wise count rates for Quadrant D Data is divided into 100 sec bins |
 |
 |
| Parameter | Plot |
|---|---|
| CZT HV Monitor | 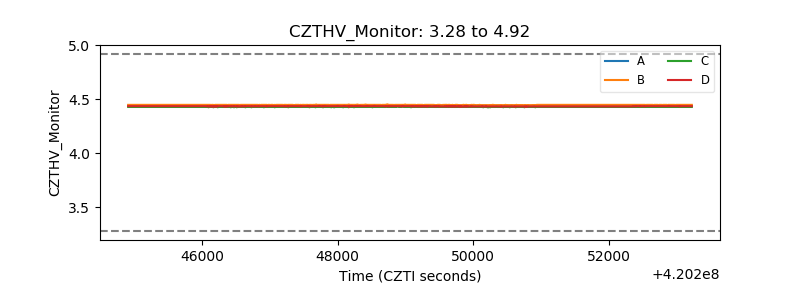 |
| D_VDD | 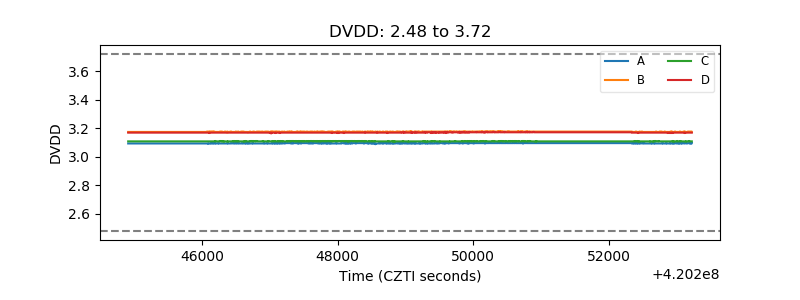 |
| Temperature 1 | 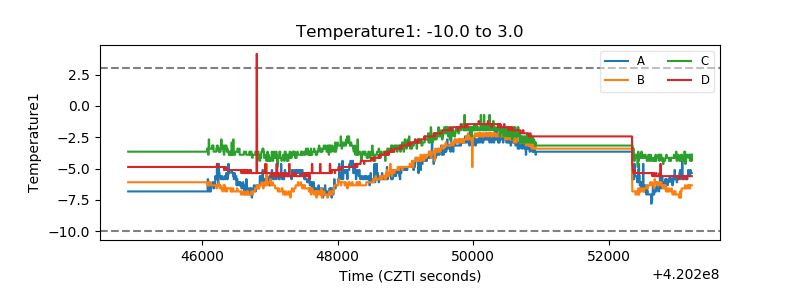 |
| Veto HV Monitor | 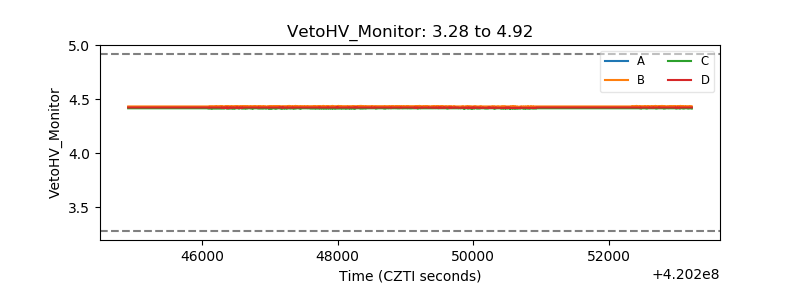 |
| Veto LLD | 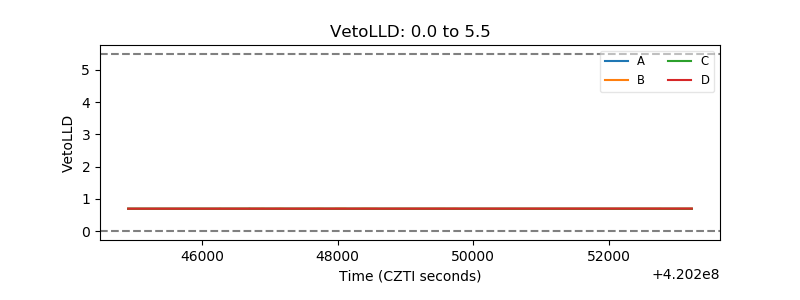 |
| Alpha Counter | 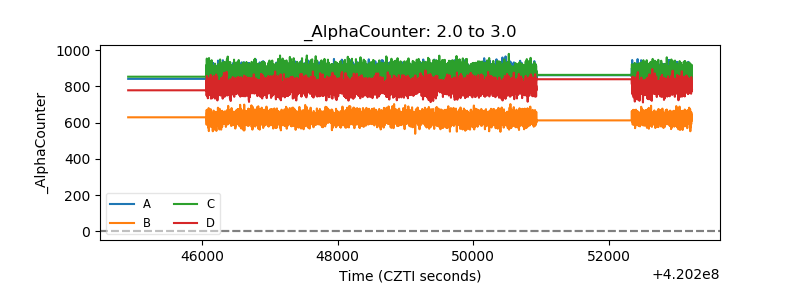 |
| _CPM_Rate | 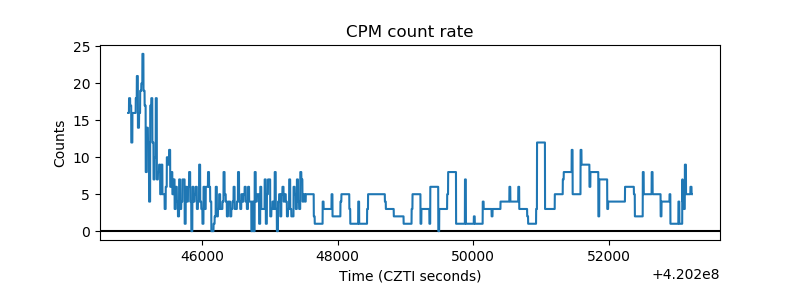 |
| CZT Counter | 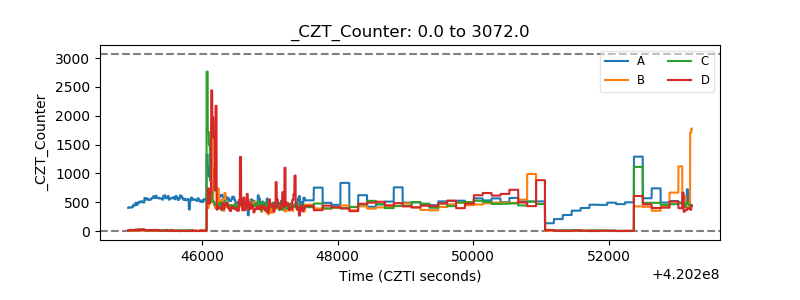 |
| +2.5 Volts monitor | 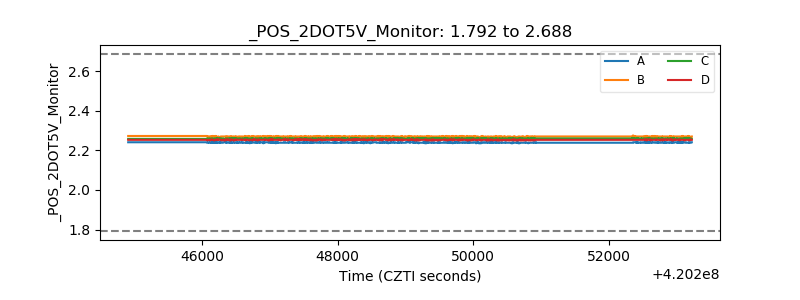 |
| +5 Volts monitor | 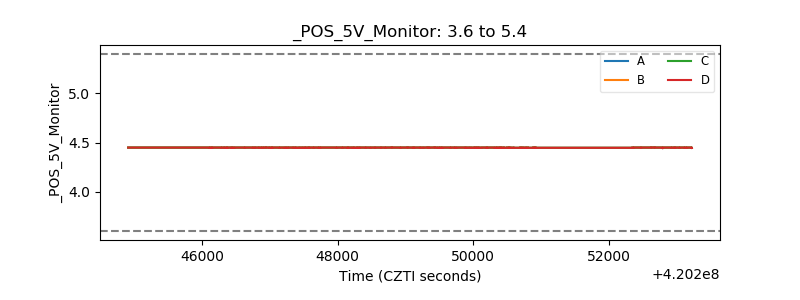 |
| _ROLL_ROT | 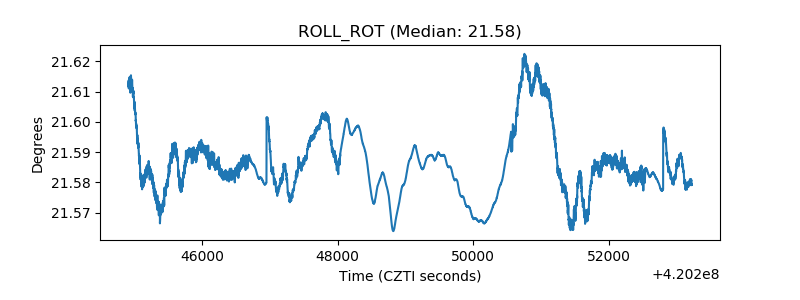 |
| _Roll_DEC | 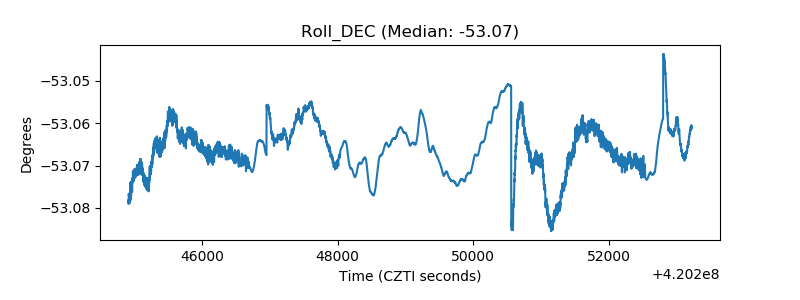 |
| _Roll_RA | 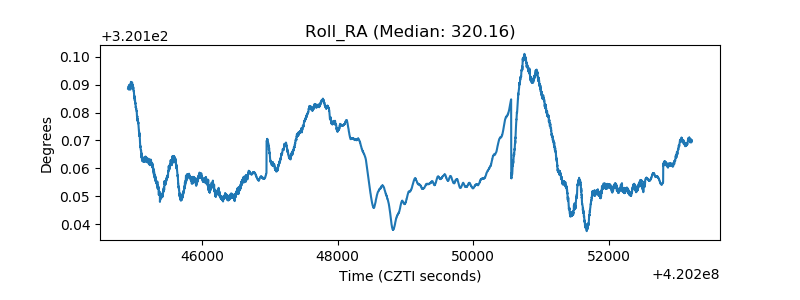 |
| Veto Counter | 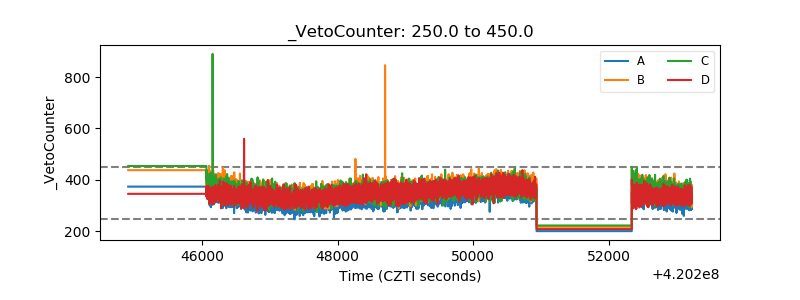 |