| Param | Original file | Final file |
|---|---|---|
| Filename | modeM0/AS1A12_052T04_9000005582_40973cztM0_level2.fits | modeM0/AS1A12_052T04_9000005582_40973cztM0_level2_quad_clean.evt |
| Size (bytes) | 378,429,120 | 106,721,280 |
| Size | 360.9 MB | 101.8 MB |
| Events in quadrant A | 3,563,524 | 719,027 |
| Events in quadrant B | 3,216,590 | 724,981 |
| Events in quadrant C | 3,148,293 | 692,682 |
| Events in quadrant D | 3,573,317 | 640,936 |
| Mode M9 | |||
|---|---|---|---|
| Quadrant | BADHDUFLAG | Total packets | Discarded packets |
| A | 0 | 27 | 0 |
| B | 0 | 27 | 0 |
| C | 0 | 27 | 0 |
| D | 0 | 27 | 0 |
| Mode SS | |||
|---|---|---|---|
| Quadrant | BADHDUFLAG | Total packets | Discarded packets |
| A | 0 | 134 | 0 |
| B | 0 | 134 | 0 |
| C | 0 | 134 | 0 |
| D | 0 | 134 | 0 |
| Mode M0 | |||
|---|---|---|---|
| Quadrant | BADHDUFLAG | Total packets | Discarded packets |
| A | 0 | 14647 | 3 |
| B | 0 | 14109 | 2 |
| C | 0 | 13451 | 2 |
| D | 0 | 15292 | 2 |
| Quadrant | Total seconds | Saturated seconds | Saturation percentage |
|---|---|---|---|
| A | 6506 | 13 | 0.199816% |
| B | 6506 | 69 | 1.060559% |
| C | 6506 | 41 | 0.630188% |
| D | 6506 | 125 | 1.921303% |
Noise dominated data is calculated using 1-second bins in cleaned event files. If a bin has >2000 counts, and if more than 50% of those come from <1% of pixels, then it is considered to be noise-dominated and hence unusable.
| Quadrant | # 1 sec bins | Bins with >0 counts | Bins with >2000 counts | High rate bins dominated by noise | Noise dominated (total time) | Noise dominated (detector-on time) | Marked lightcurve |
|---|---|---|---|---|---|---|---|
| A | 9221 | 6508 | 4 | 4 | 0.04% | 0.06% | 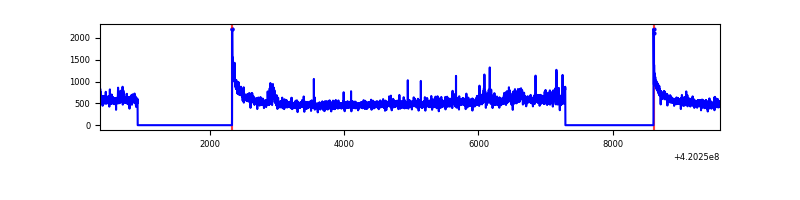 |
| B | 9221 | 6508 | 51 | 51 | 0.55% | 0.78% | 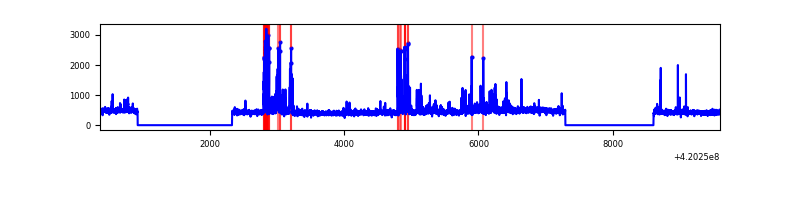 |
| C | 9221 | 6508 | 39 | 39 | 0.42% | 0.60% | 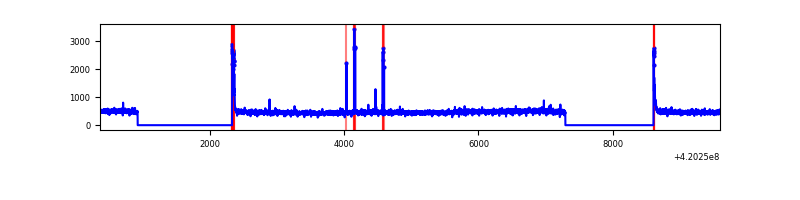 |
| D | 9221 | 6508 | 110 | 110 | 1.19% | 1.69% | 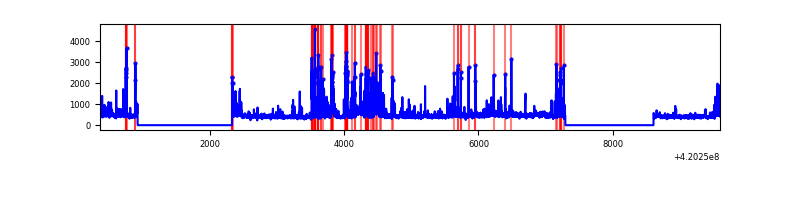 |
Top three noisy pixels from each quadrant. If the there are fewer than three noisy pixels in the level2.evt file, extra rows are filled as -1
| Pixel properties | Quadrant properties | ||||||
|---|---|---|---|---|---|---|---|
| Quadrant | DetID | PixID | Counts | Sigma | Mean | Median | Sigma |
| A | 10 | 83 | 578614 | 3926.13 | 719 | 703 | 147.2 |
| A | 12 | 189 | 148501 | 1004.09 | 719 | 703 | 147.2 |
| A | 2 | 79 | 21689 | 142.57 | 719 | 703 | 147.2 |
| B | 5 | 255 | 386608 | 2757.11 | 711 | 690 | 140.0 |
| B | 0 | 229 | 22863 | 158.41 | 711 | 690 | 140.0 |
| B | 12 | 111 | 17669 | 121.3 | 711 | 690 | 140.0 |
| C | 15 | 214 | 279176 | 1720.72 | 697 | 702 | 161.8 |
| C | 0 | 10 | 104002 | 638.3 | 697 | 702 | 161.8 |
| C | 12 | 249 | 27422 | 165.11 | 697 | 702 | 161.8 |
| D | 13 | 249 | 534147 | 3116.18 | 699 | 678 | 171.2 |
| D | 12 | 233 | 102305 | 593.64 | 699 | 678 | 171.2 |
| D | 2 | 249 | 98552 | 571.72 | 699 | 678 | 171.2 |
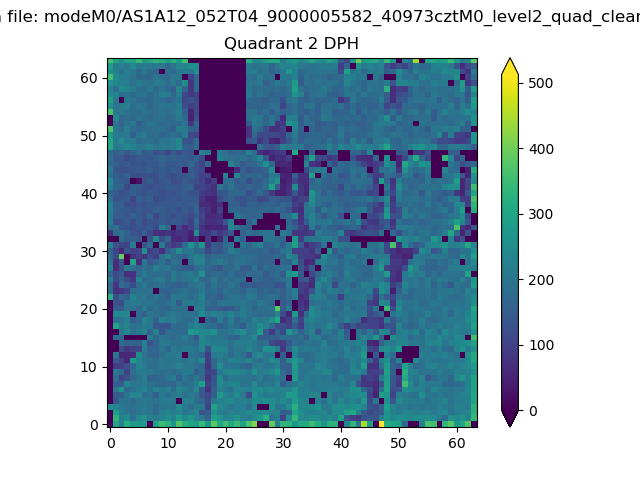
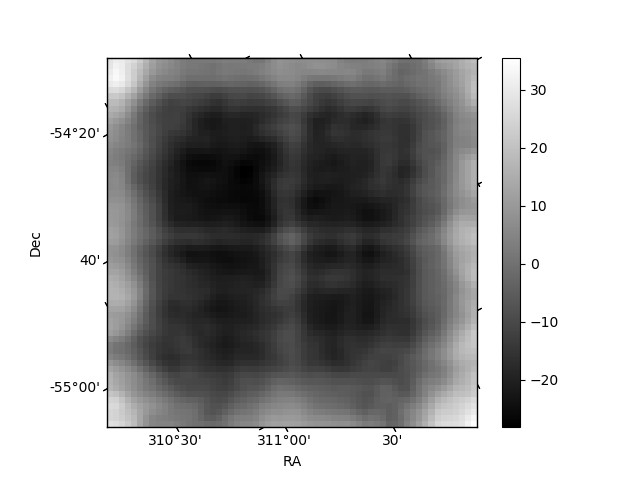
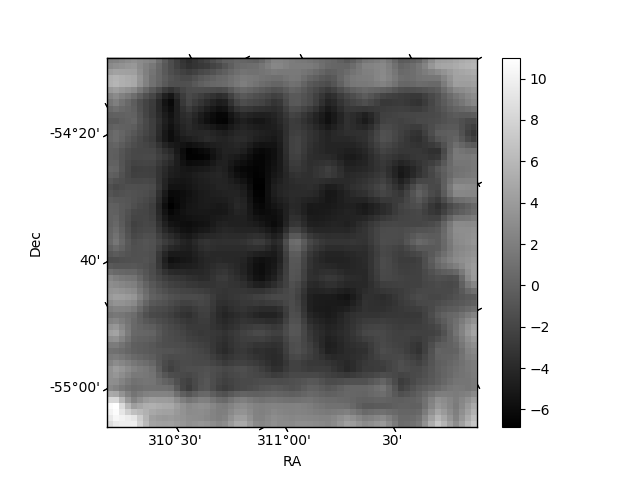
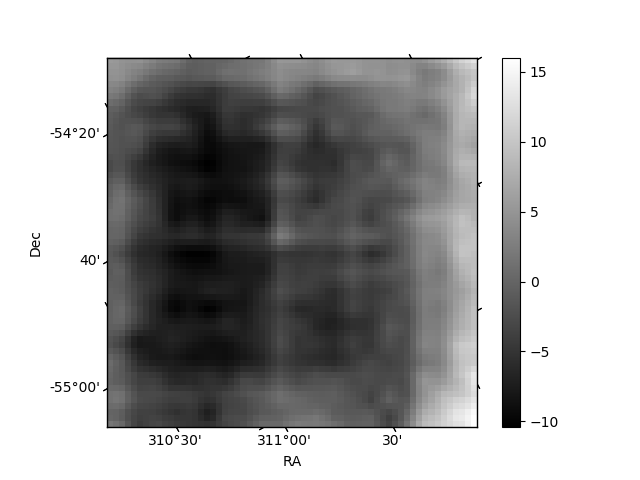
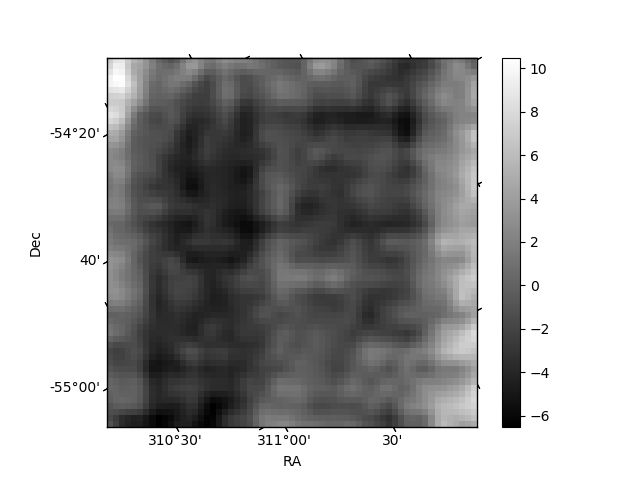
Histogram calculated using DETX and DETY for each event in the final _common_clean file
| Quadrant A | 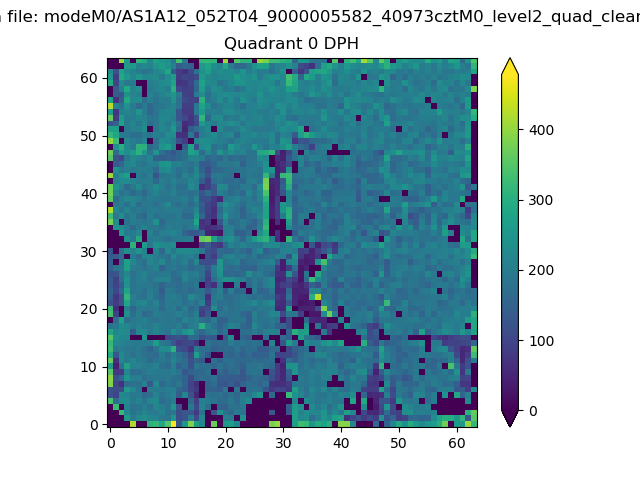 |
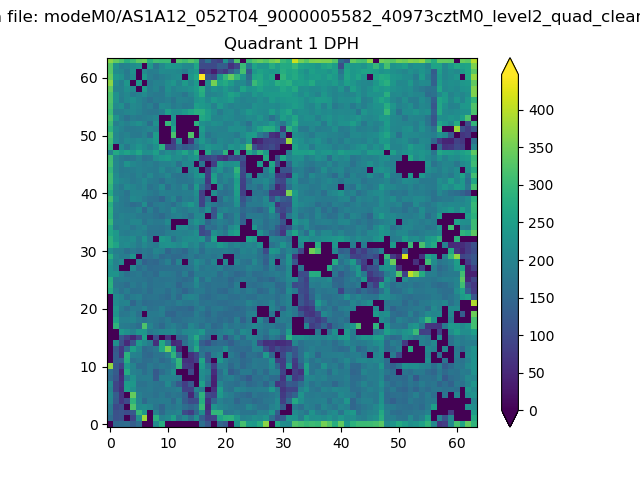 |
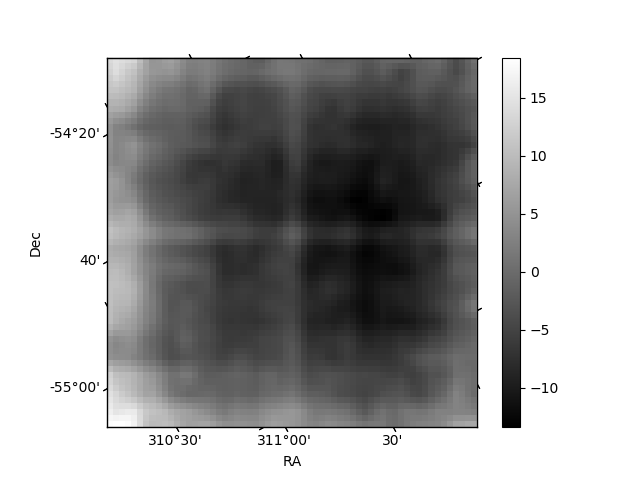
Quadrant B |
|---|---|---|---|
| Quadrant D | 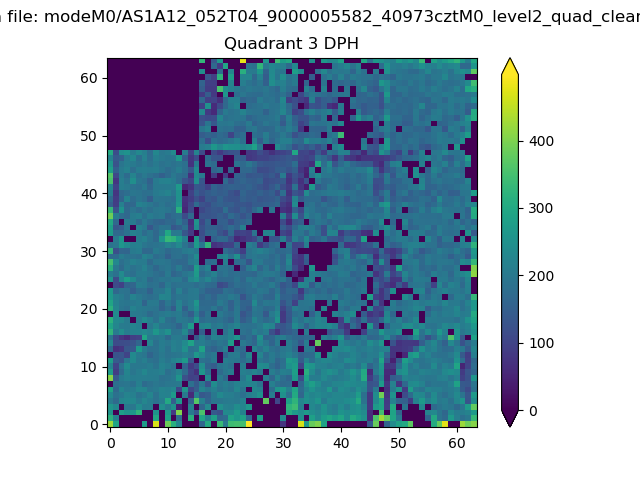 |
 |
Quadrant C |
| Plot type | Count rate plots | Images |
|---|---|---|
| Comparison with Poisson distribution Blue bars denote a histogram of data divided into 1 sec bins. Red curve is a Poisson curve with rate = median count rate of data. |
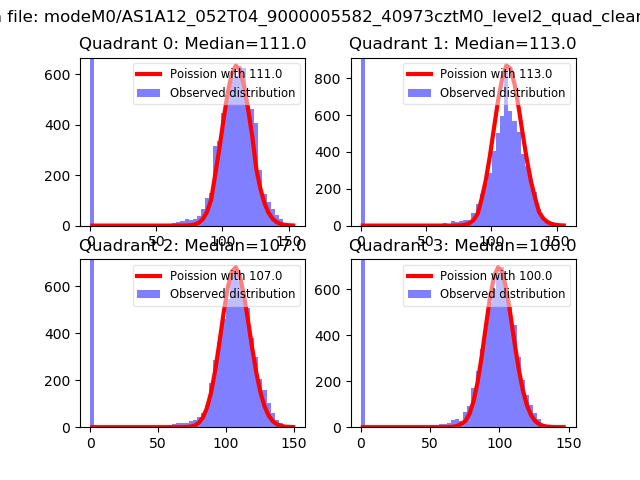 |
 |
| Quadrant-wise count rates Data is divided into 100 sec bins |
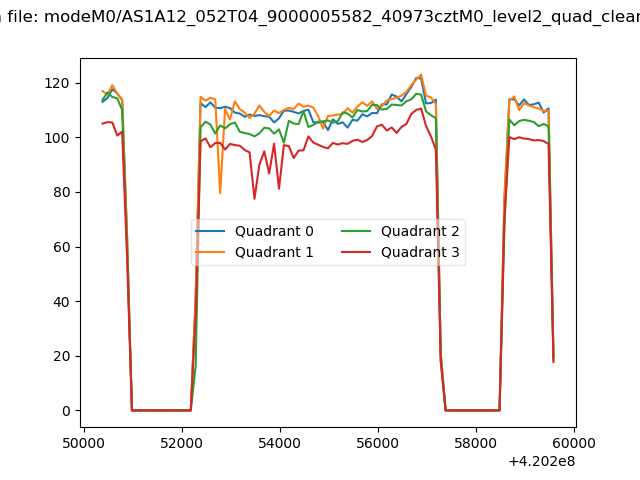 |
|
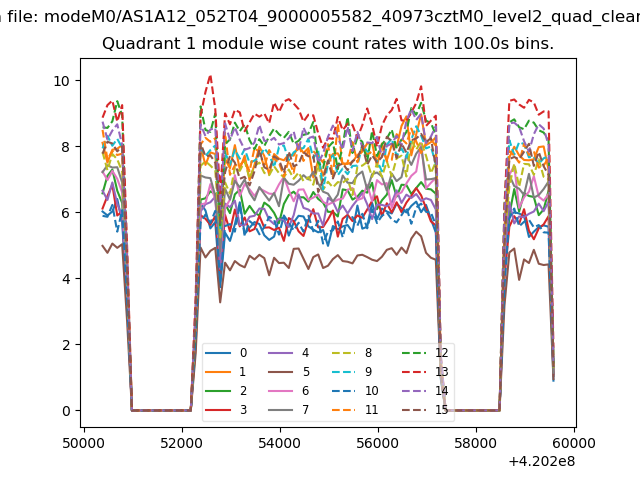
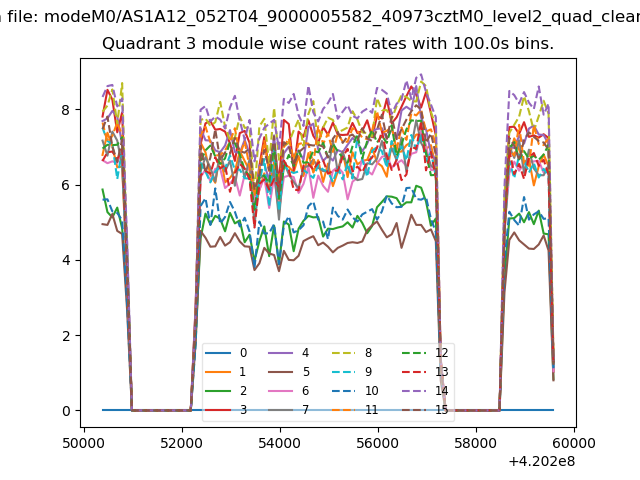
| Module-wise count rates for Quadrant A Data is divided into 100 sec bins |
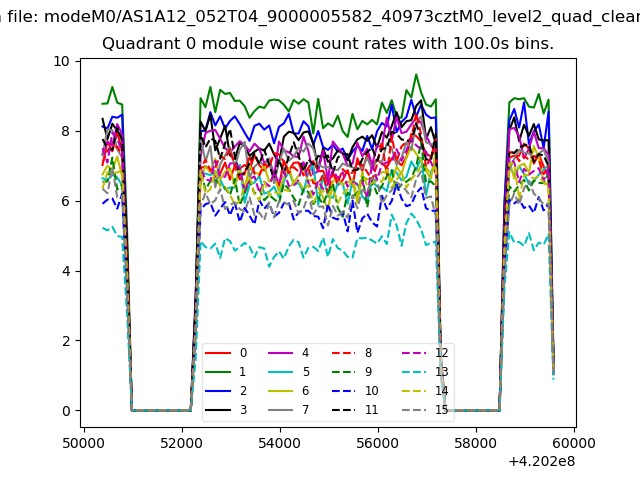 |
 |
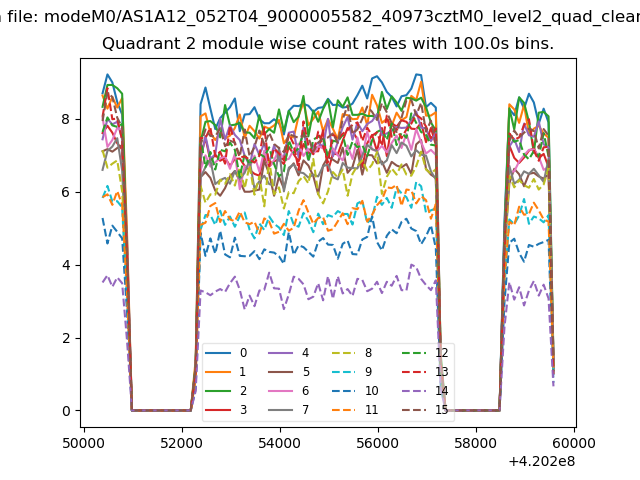
| Module-wise count rates for Quadrant B Data is divided into 100 sec bins |
 |
 |
| Module-wise count rates for Quadrant C Data is divided into 100 sec bins |
 |
 |
| Module-wise count rates for Quadrant D Data is divided into 100 sec bins |
 |
 |
| Parameter | Plot |
|---|---|
| CZT HV Monitor | 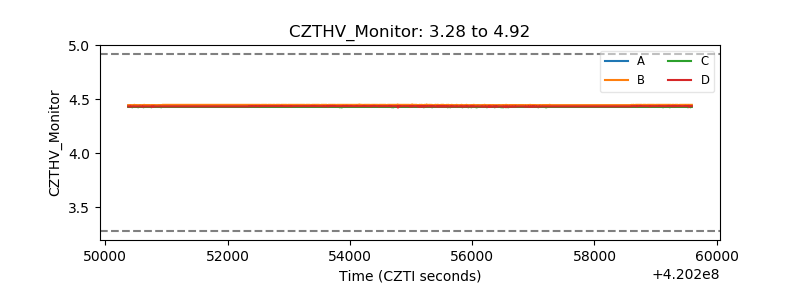 |
| D_VDD | 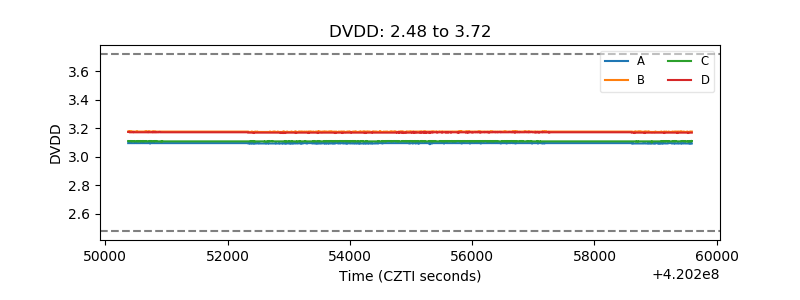 |
| Temperature 1 | 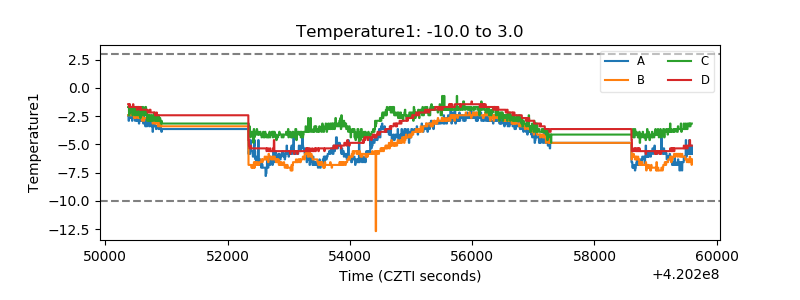 |
| Veto HV Monitor | 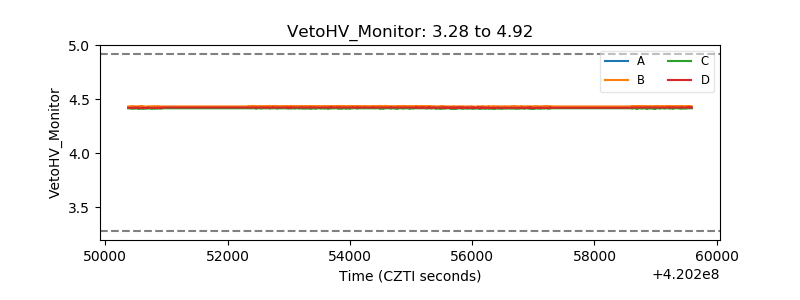 |
| Veto LLD | 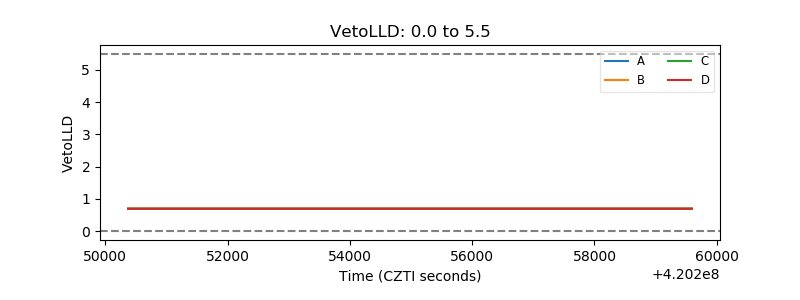 |
| Alpha Counter | 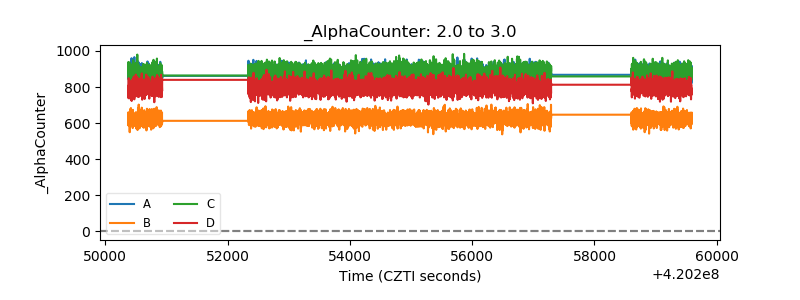 |
| _CPM_Rate | 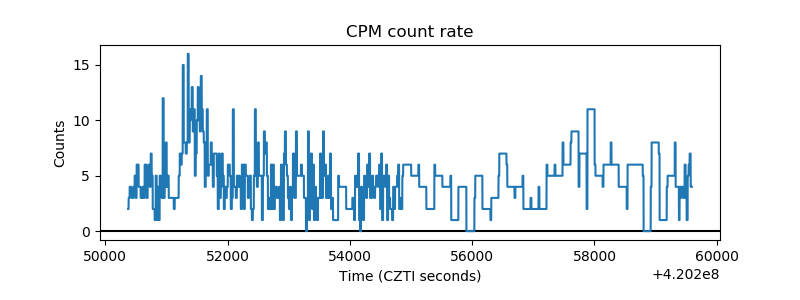 |
| CZT Counter | 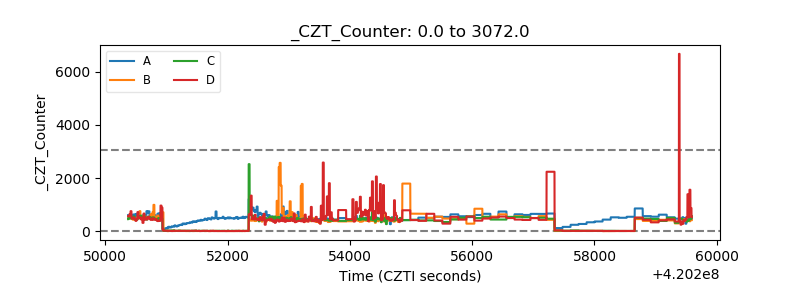 |
| +2.5 Volts monitor | 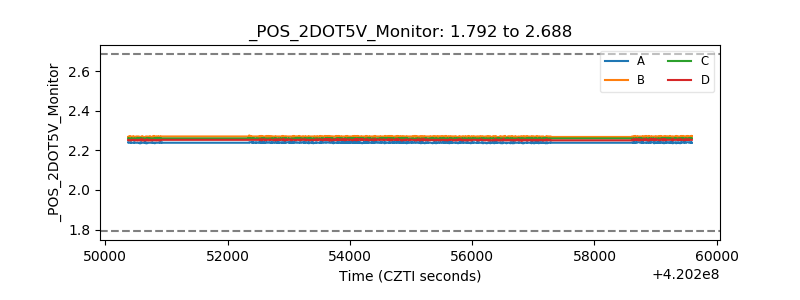 |
| +5 Volts monitor | 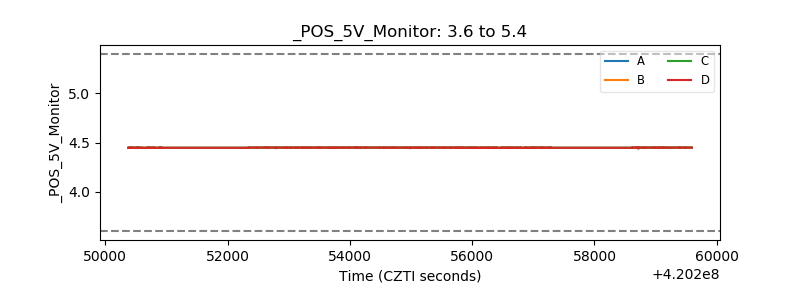 |
| _ROLL_ROT | 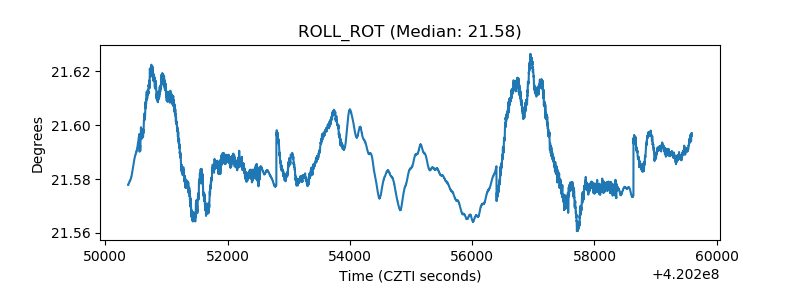 |
| _Roll_DEC | 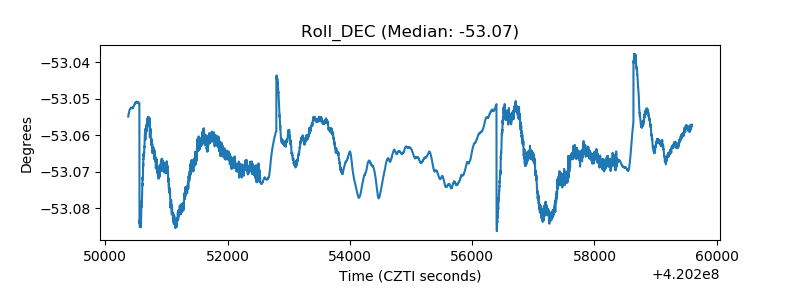 |
| _Roll_RA | 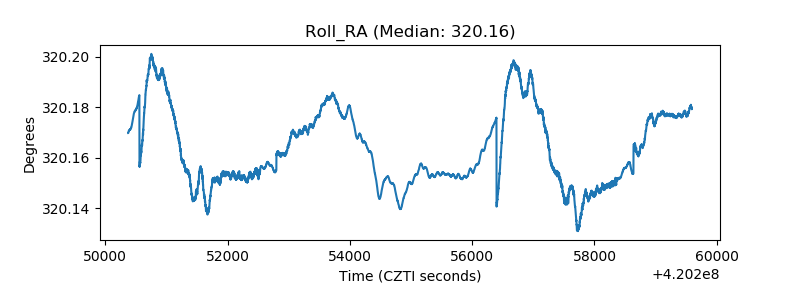 |
| Veto Counter | 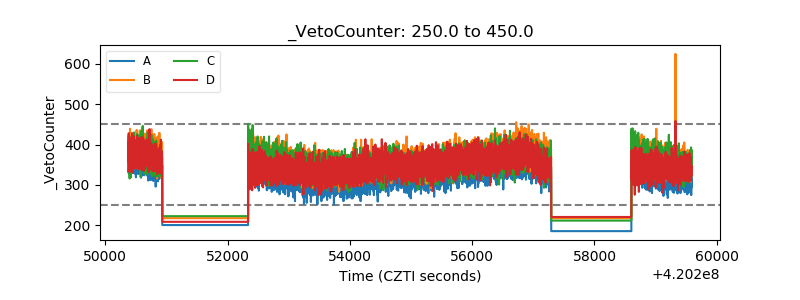 |