| Param | Original file | Final file |
|---|---|---|
| Filename | modeM0/AS1A12_052T04_9000005582_40977cztM0_level2.fits | modeM0/AS1A12_052T04_9000005582_40977cztM0_level2_quad_clean.evt |
| Size (bytes) | 1,104,580,800 | 298,028,160 |
| Size | 1.0 GB | 284.2 MB |
| Events in quadrant A | 10,053,248 | 2,004,744 |
| Events in quadrant B | 8,174,662 | 2,032,586 |
| Events in quadrant C | 10,131,665 | 1,911,516 |
| Events in quadrant D | 11,083,355 | 1,789,151 |
| Mode M9 | |||
|---|---|---|---|
| Quadrant | BADHDUFLAG | Total packets | Discarded packets |
| A | 0 | 42 | 0 |
| B | 0 | 42 | 0 |
| C | 0 | 42 | 0 |
| D | 0 | 42 | 0 |
| Mode SS | |||
|---|---|---|---|
| Quadrant | BADHDUFLAG | Total packets | Discarded packets |
| A | 0 | 378 | 0 |
| B | 0 | 378 | 0 |
| C | 0 | 378 | 0 |
| D | 0 | 378 | 0 |
| Mode M0 | |||
|---|---|---|---|
| Quadrant | BADHDUFLAG | Total packets | Discarded packets |
| A | 0 | 40907 | 3 |
| B | 0 | 37709 | 3 |
| C | 0 | 41951 | 3 |
| D | 0 | 46330 | 3 |
| Quadrant | Total seconds | Saturated seconds | Saturation percentage |
|---|---|---|---|
| A | 18651 | 61 | 0.327060% |
| B | 18651 | 41 | 0.219827% |
| C | 18651 | 443 | 2.375208% |
| D | 18651 | 605 | 3.243794% |
Noise dominated data is calculated using 1-second bins in cleaned event files. If a bin has >2000 counts, and if more than 50% of those come from <1% of pixels, then it is considered to be noise-dominated and hence unusable.
| Quadrant | # 1 sec bins | Bins with >0 counts | Bins with >2000 counts | High rate bins dominated by noise | Noise dominated (total time) | Noise dominated (detector-on time) | Marked lightcurve |
|---|---|---|---|---|---|---|---|
| A | 22890 | 18654 | 34 | 34 | 0.15% | 0.18% | 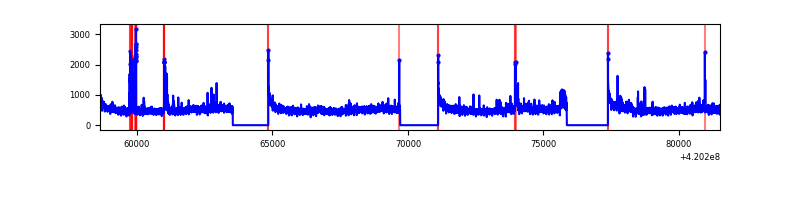 |
| B | 22890 | 18654 | 17 | 17 | 0.07% | 0.09% | 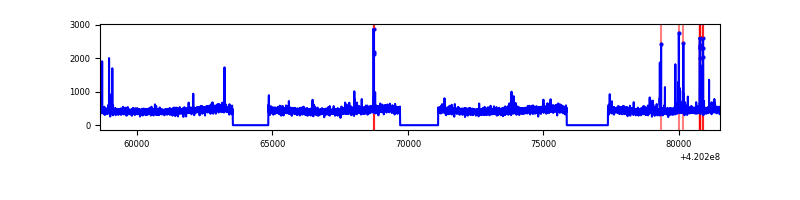 |
| C | 22890 | 18654 | 447 | 447 | 1.95% | 2.40% | 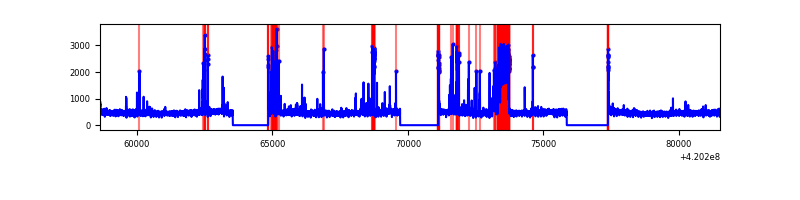 |
| D | 22890 | 18654 | 573 | 573 | 2.50% | 3.07% | 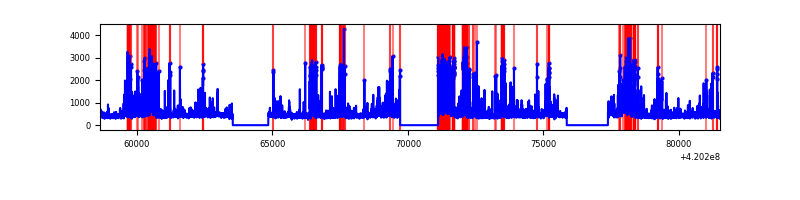 |
Top three noisy pixels from each quadrant. If the there are fewer than three noisy pixels in the level2.evt file, extra rows are filled as -1
| Pixel properties | Quadrant properties | ||||||
|---|---|---|---|---|---|---|---|
| Quadrant | DetID | PixID | Counts | Sigma | Mean | Median | Sigma |
| A | 10 | 83 | 1444107 | 3458.26 | 2052 | 2011 | 417.0 |
| A | 12 | 189 | 508923 | 1215.62 | 2052 | 2011 | 417.0 |
| A | 2 | 79 | 149407 | 353.47 | 2052 | 2011 | 417.0 |
| B | 5 | 255 | 115288 | 289.32 | 2028 | 1970 | 391.7 |
| B | 0 | 229 | 66525 | 164.82 | 2028 | 1970 | 391.7 |
| B | 12 | 111 | 50422 | 123.7 | 2028 | 1970 | 391.7 |
| C | 14 | 254 | 1418889 | 3104.86 | 1977 | 1991 | 456.3 |
| C | 15 | 214 | 788160 | 1722.74 | 1977 | 1991 | 456.3 |
| C | 0 | 10 | 138784 | 299.75 | 1977 | 1991 | 456.3 |
| D | 13 | 249 | 2430004 | 5044.51 | 1986 | 1929 | 481.3 |
| D | 2 | 249 | 266679 | 550.04 | 1986 | 1929 | 481.3 |
| D | 12 | 233 | 193323 | 397.64 | 1986 | 1929 | 481.3 |
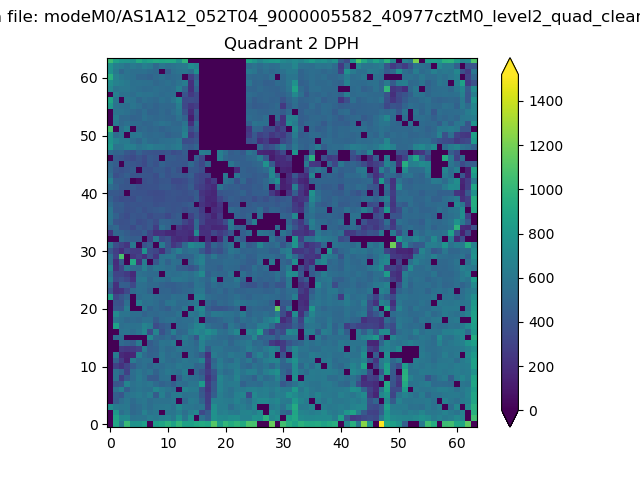
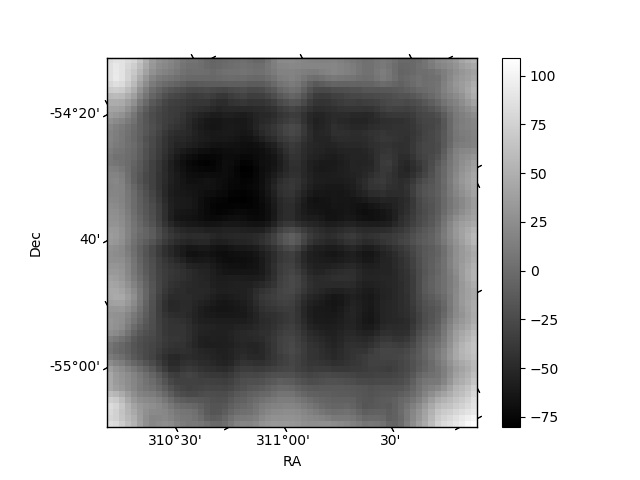
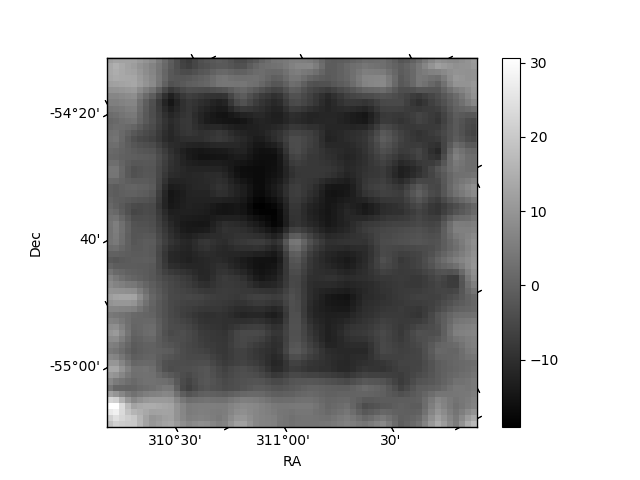
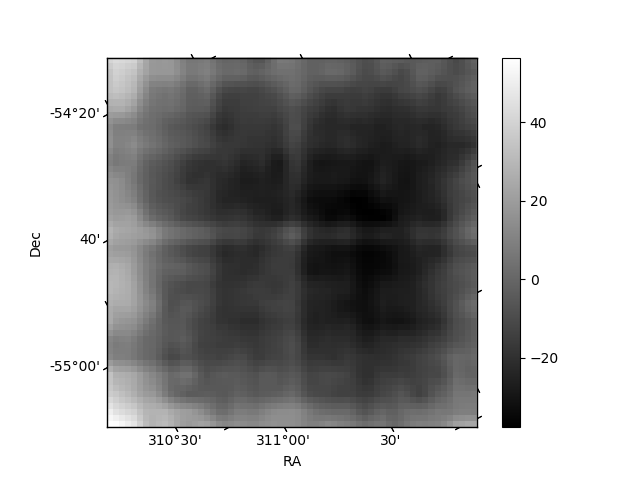
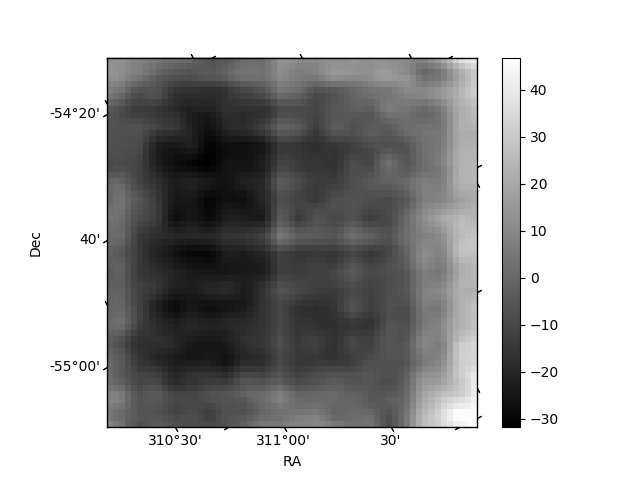
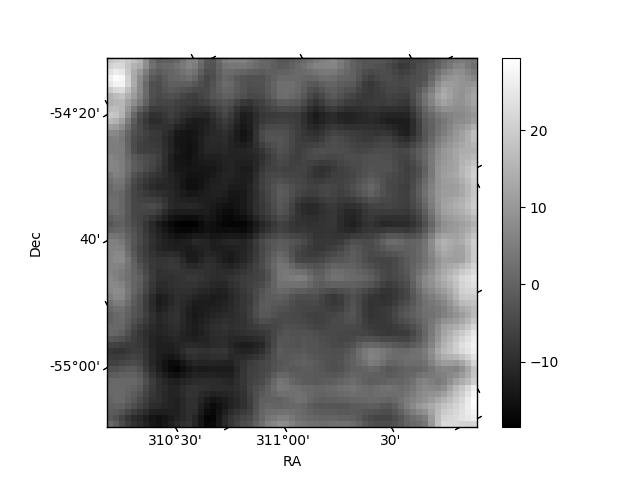
Histogram calculated using DETX and DETY for each event in the final _common_clean file
| Quadrant A | 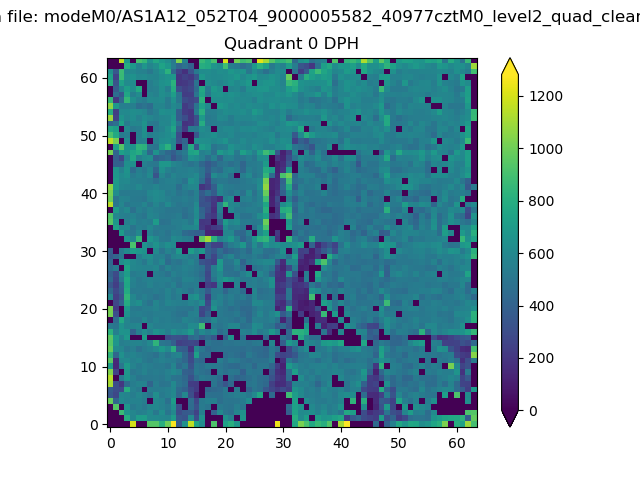 |
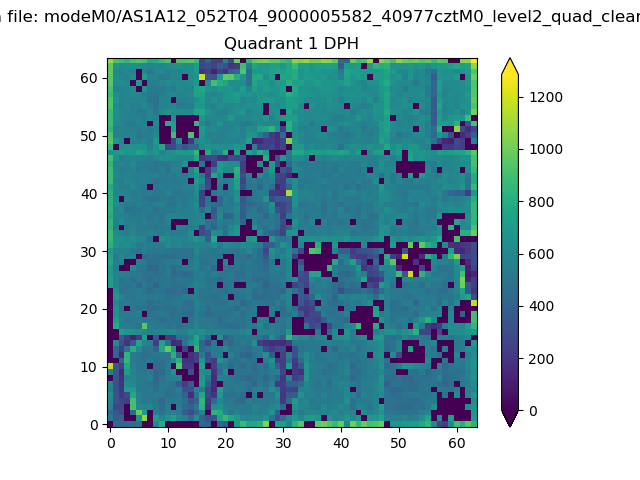 |
Quadrant B |
|---|---|---|---|
| Quadrant D | 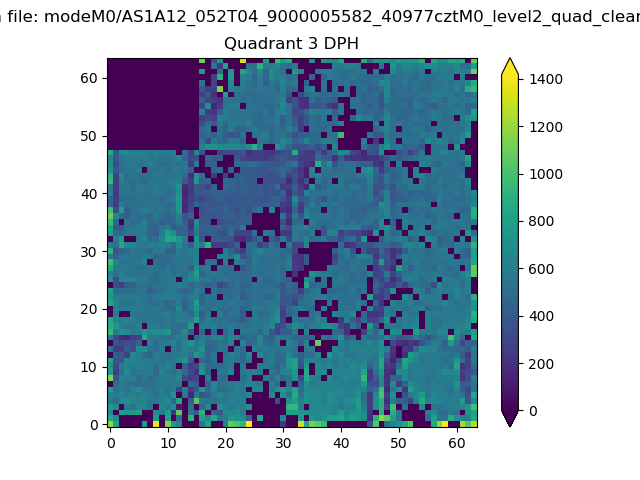 |
 |
Quadrant C |
| Plot type | Count rate plots | Images |
|---|---|---|
| Comparison with Poisson distribution Blue bars denote a histogram of data divided into 1 sec bins. Red curve is a Poisson curve with rate = median count rate of data. |
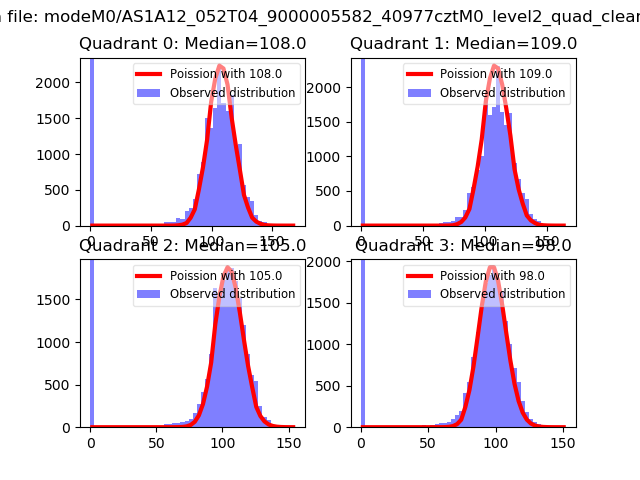 |
 |
| Quadrant-wise count rates Data is divided into 100 sec bins |
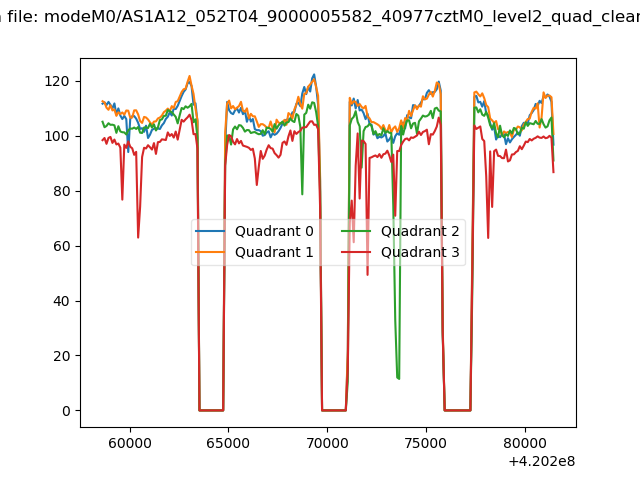 |
|
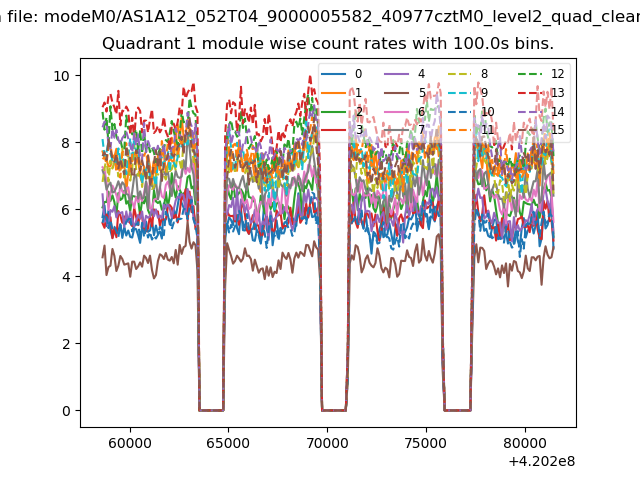
| Module-wise count rates for Quadrant A Data is divided into 100 sec bins |
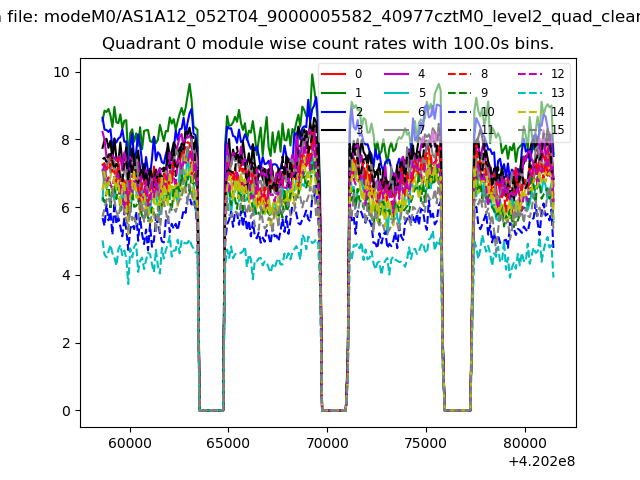 |
 |
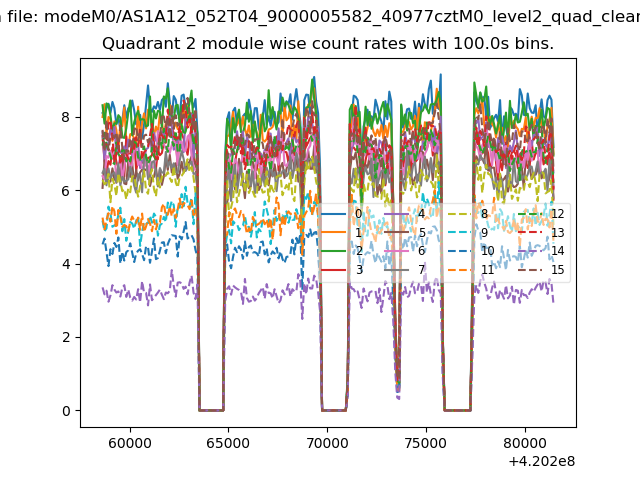
| Module-wise count rates for Quadrant B Data is divided into 100 sec bins |
 |
 |
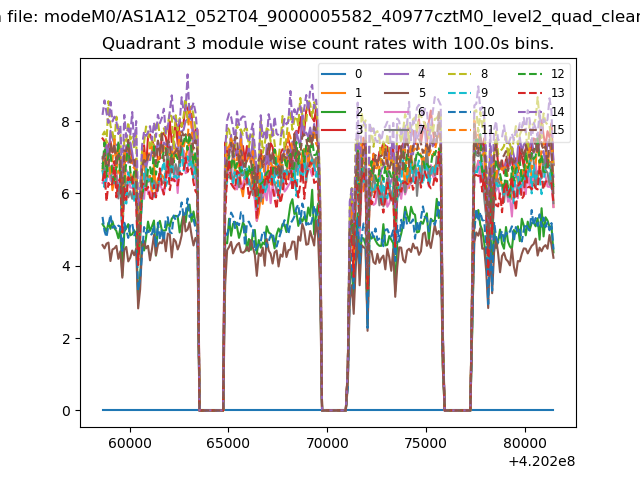
| Module-wise count rates for Quadrant C Data is divided into 100 sec bins |
 |
 |
| Module-wise count rates for Quadrant D Data is divided into 100 sec bins |
 |
 |
| Parameter | Plot |
|---|---|
| CZT HV Monitor |  |
| D_VDD | 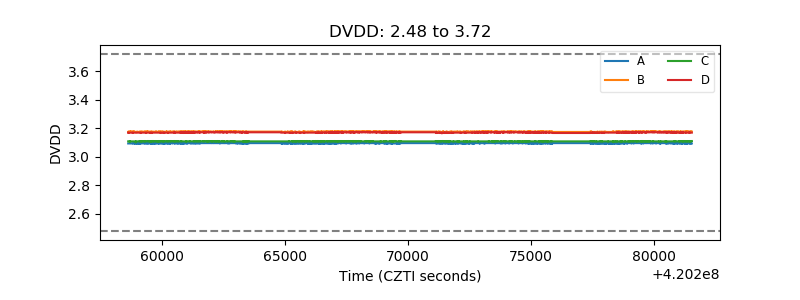 |
| Temperature 1 | 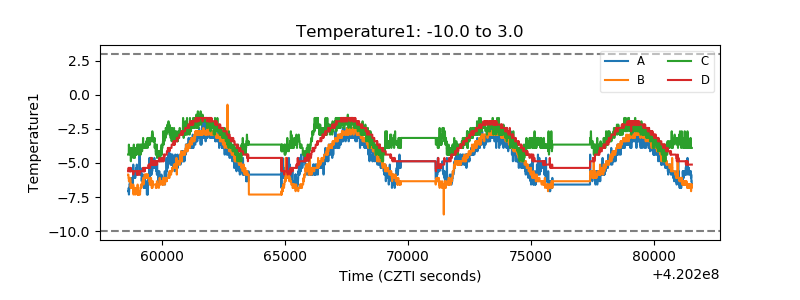 |
| Veto HV Monitor | 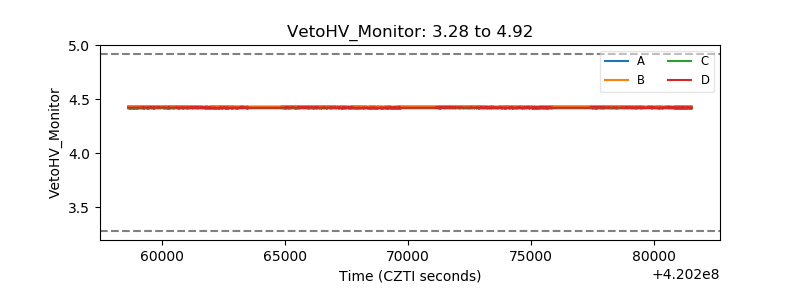 |
| Veto LLD | 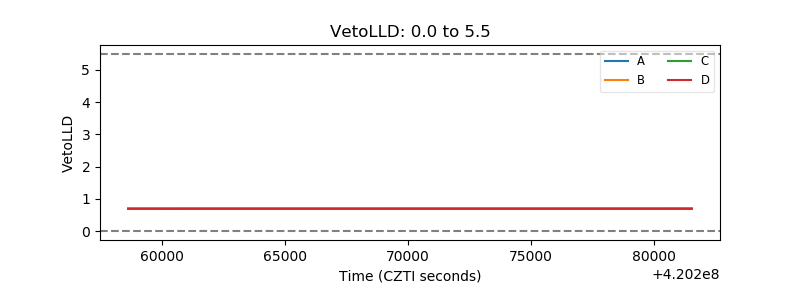 |
| Alpha Counter | 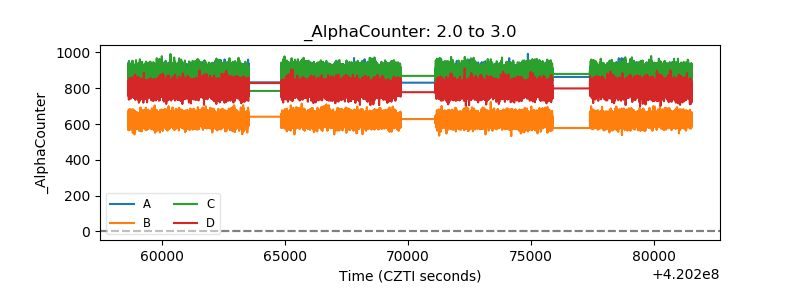 |
| _CPM_Rate |  |
| CZT Counter | 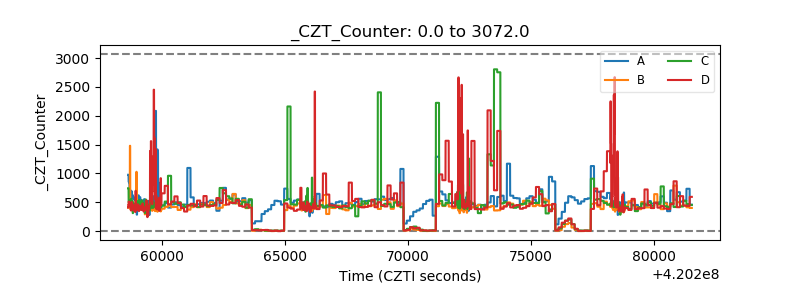 |
| +2.5 Volts monitor | 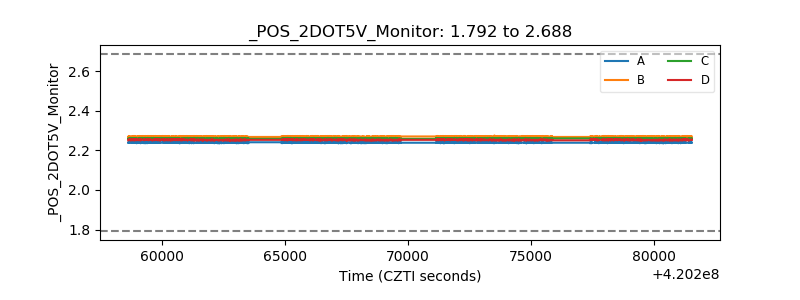 |
| +5 Volts monitor | 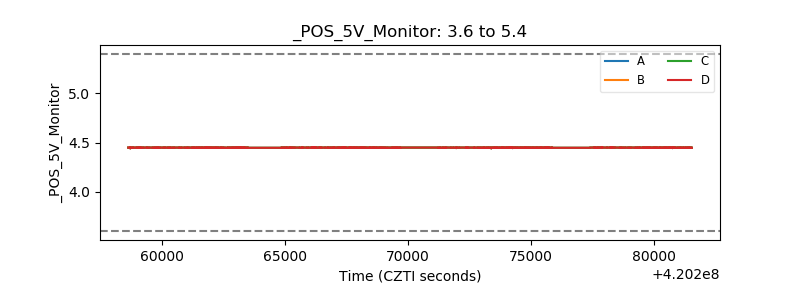 |
| _ROLL_ROT | 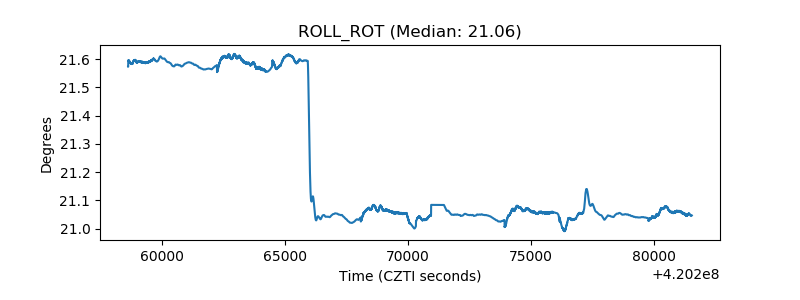 |
| _Roll_DEC | 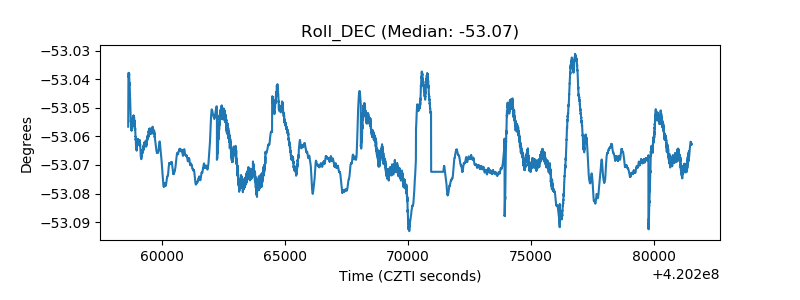 |
| _Roll_RA | 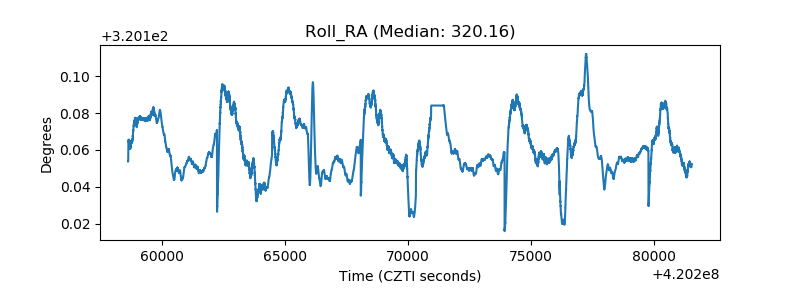 |
| Veto Counter | 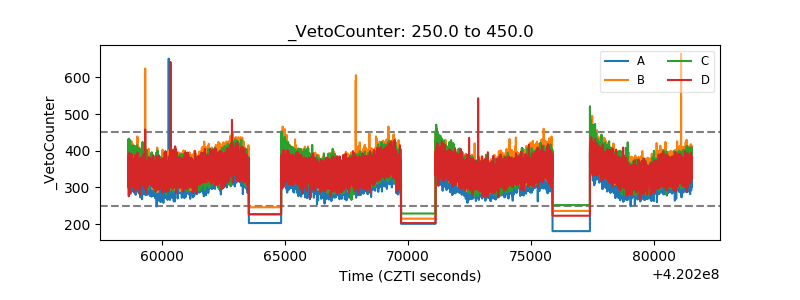 |