| Param | Original file | Final file |
|---|---|---|
| Filename | modeM0/AS1A12_066T01_9000005584_40977cztM0_level2.fits | modeM0/AS1A12_066T01_9000005584_40977cztM0_level2_quad_clean.evt |
| Size (bytes) | 69,546,240 | 18,100,800 |
| Size | 66.3 MB | 17.3 MB |
| Events in quadrant A | 630,668 | 120,791 |
| Events in quadrant B | 508,248 | 123,335 |
| Events in quadrant C | 595,233 | 116,581 |
| Events in quadrant D | 753,622 | 105,178 |
| Mode SS | |||
|---|---|---|---|
| Quadrant | BADHDUFLAG | Total packets | Discarded packets |
| A | 0 | 24 | 0 |
| B | 0 | 24 | 0 |
| C | 0 | 24 | 0 |
| D | 0 | 24 | 0 |
| Mode M0 | |||
|---|---|---|---|
| Quadrant | BADHDUFLAG | Total packets | Discarded packets |
| A | 0 | 2538 | 2 |
| B | 0 | 2243 | 1 |
| C | 0 | 2406 | 1 |
| D | 0 | 2976 | 1 |
| Mode M9 | |||
|---|---|---|---|
| Quadrant | BADHDUFLAG | Total packets | Discarded packets |
| A | 0 | 16 | 0 |
| B | 0 | 16 | 0 |
| C | 0 | 16 | 0 |
| D | 0 | 16 | 0 |
| Quadrant | Total seconds | Saturated seconds | Saturation percentage |
|---|---|---|---|
| A | 1072 | 4 | 0.373134% |
| B | 1072 | 12 | 1.119403% |
| C | 1072 | 22 | 2.052239% |
| D | 1072 | 68 | 6.343284% |
Noise dominated data is calculated using 1-second bins in cleaned event files. If a bin has >2000 counts, and if more than 50% of those come from <1% of pixels, then it is considered to be noise-dominated and hence unusable.
| Quadrant | # 1 sec bins | Bins with >0 counts | Bins with >2000 counts | High rate bins dominated by noise | Noise dominated (total time) | Noise dominated (detector-on time) | Marked lightcurve |
|---|---|---|---|---|---|---|---|
| A | 2715 | 1073 | 2 | 2 | 0.07% | 0.19% | 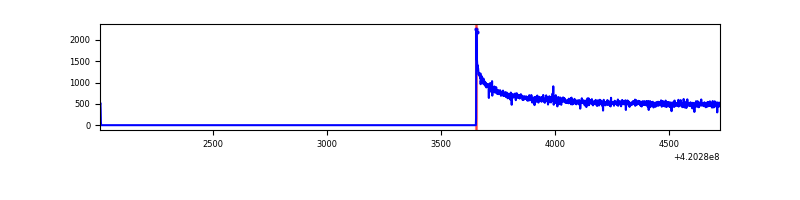 |
| B | 2715 | 1073 | 11 | 11 | 0.41% | 1.03% | 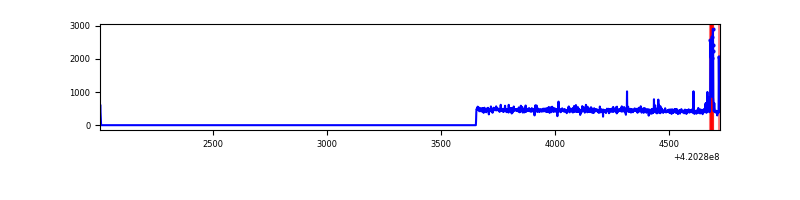 |
| C | 2715 | 1073 | 23 | 23 | 0.85% | 2.14% | 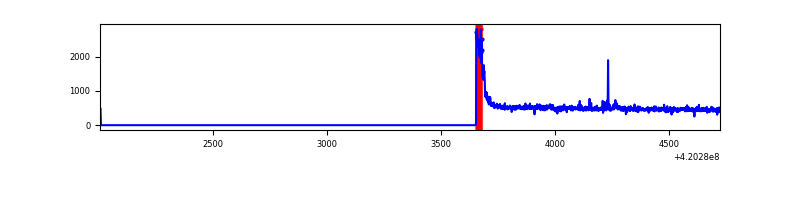 |
| D | 2715 | 1073 | 54 | 54 | 1.99% | 5.03% | 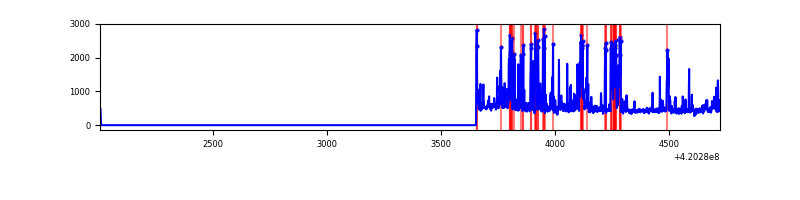 |
Top three noisy pixels from each quadrant. If the there are fewer than three noisy pixels in the level2.evt file, extra rows are filled as -1
| Pixel properties | Quadrant properties | ||||||
|---|---|---|---|---|---|---|---|
| Quadrant | DetID | PixID | Counts | Sigma | Mean | Median | Sigma |
| A | 10 | 83 | 153079 | 5610.2 | 123 | 120 | 27.3 |
| A | 10 | 67 | 1466 | 49.37 | 123 | 120 | 27.3 |
| A | 13 | 254 | 1415 | 47.5 | 123 | 120 | 27.3 |
| B | 5 | 255 | 35578 | 1383.04 | 119 | 116 | 25.6 |
| B | 12 | 111 | 2870 | 107.41 | 119 | 116 | 25.6 |
| B | 11 | 111 | 2787 | 104.17 | 119 | 116 | 25.6 |
| C | 0 | 10 | 74882 | 2555.27 | 118 | 118 | 29.3 |
| C | 15 | 214 | 50846 | 1733.77 | 118 | 118 | 29.3 |
| C | 12 | 249 | 8320 | 280.33 | 118 | 118 | 29.3 |
| D | 13 | 171 | 155341 | 5081.11 | 118 | 114 | 30.5 |
| D | 13 | 249 | 101148 | 3307.19 | 118 | 114 | 30.5 |
| D | 2 | 249 | 18594 | 604.91 | 118 | 114 | 30.5 |
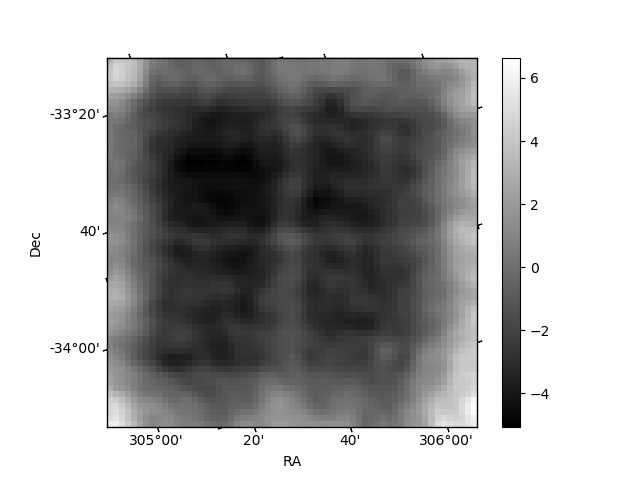
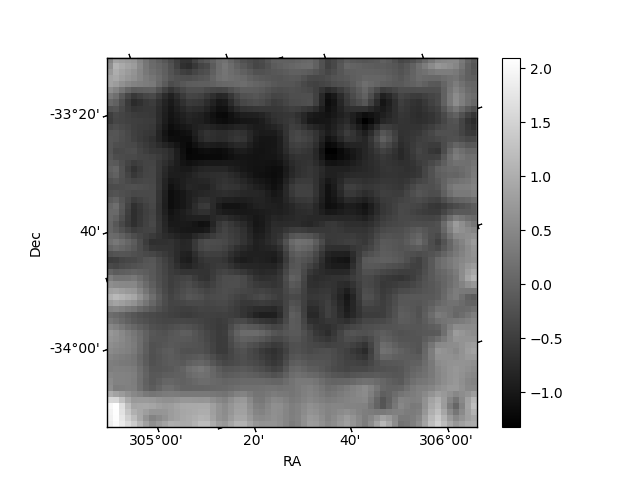
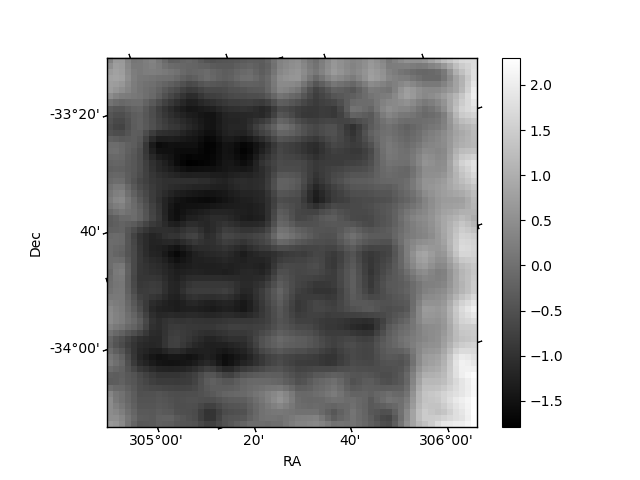
Histogram calculated using DETX and DETY for each event in the final _common_clean file
| Quadrant A | 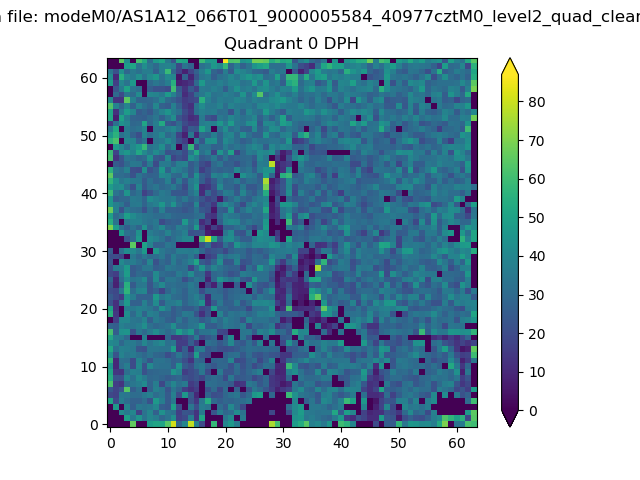 |
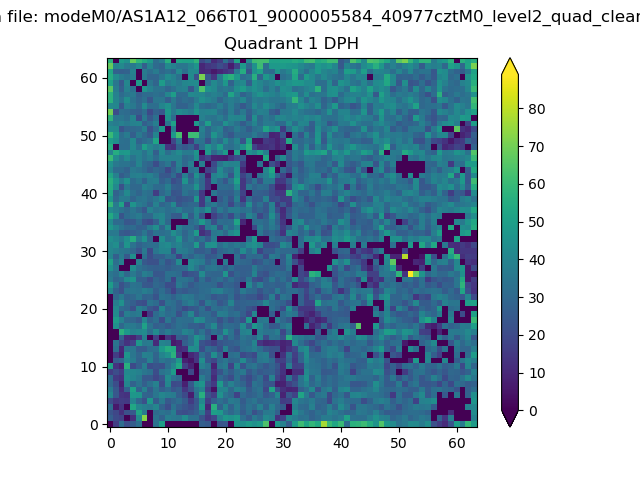 |
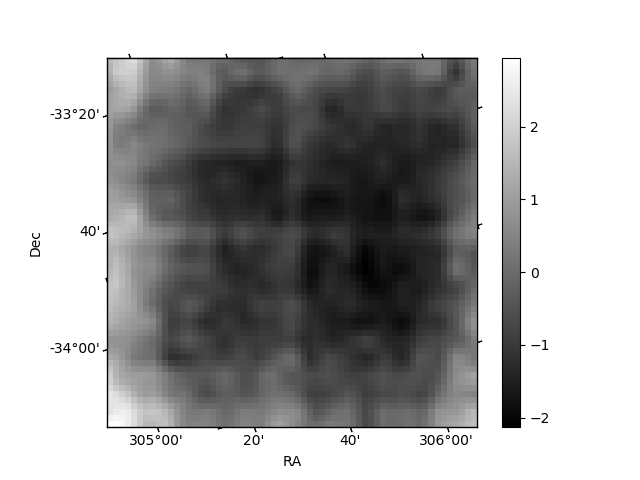
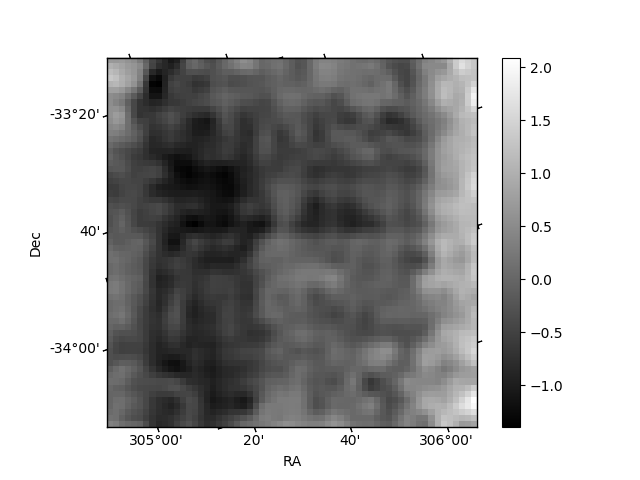
Quadrant B |
|---|---|---|---|
| Quadrant D | 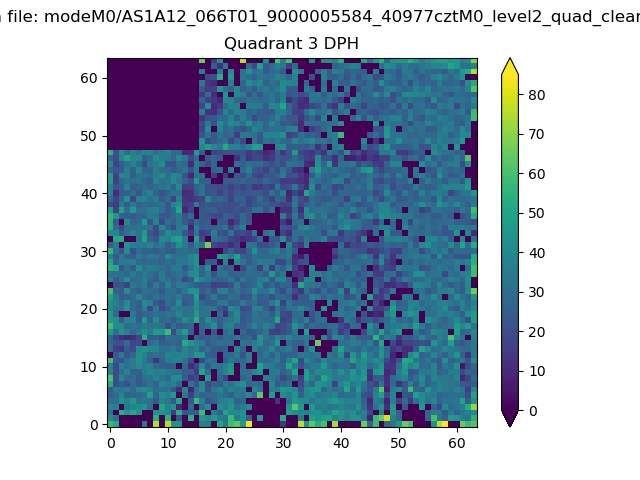 |
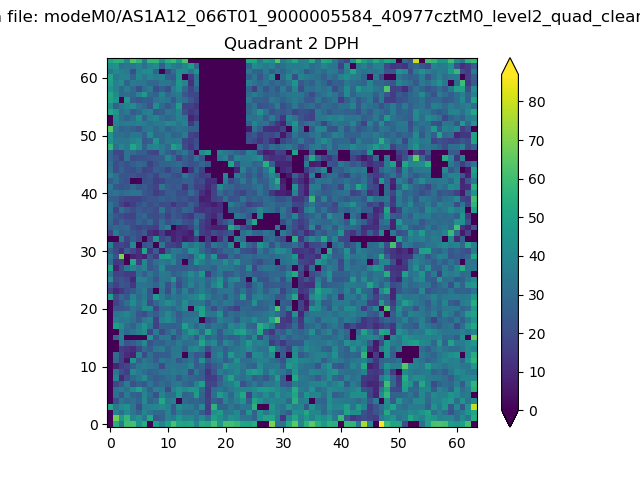 |
Quadrant C |
| Plot type | Count rate plots | Images |
|---|---|---|
| Comparison with Poisson distribution Blue bars denote a histogram of data divided into 1 sec bins. Red curve is a Poisson curve with rate = median count rate of data. |
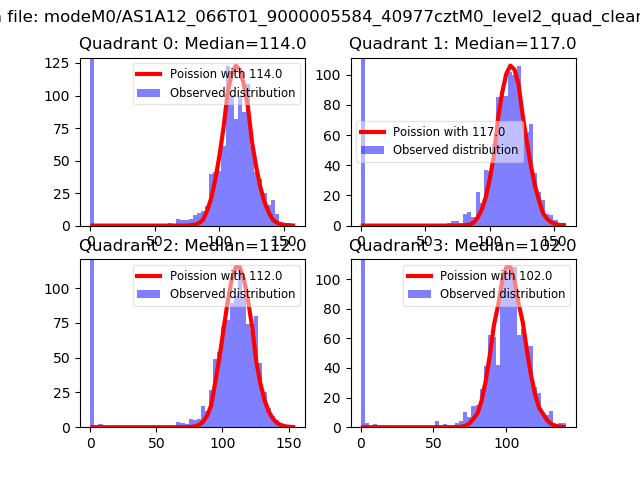 |
 |
| Quadrant-wise count rates Data is divided into 100 sec bins |
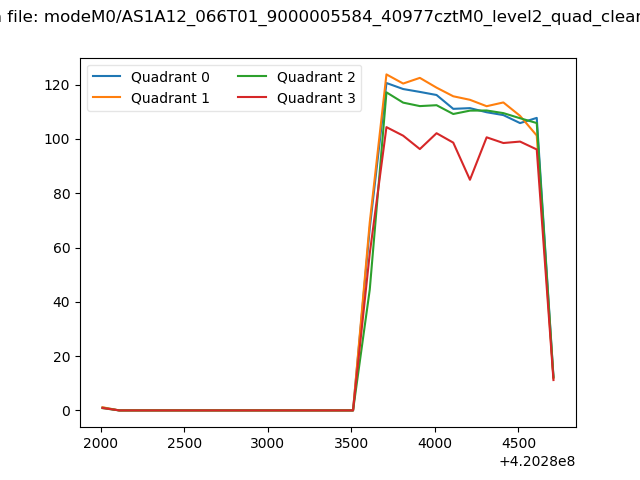 |
|
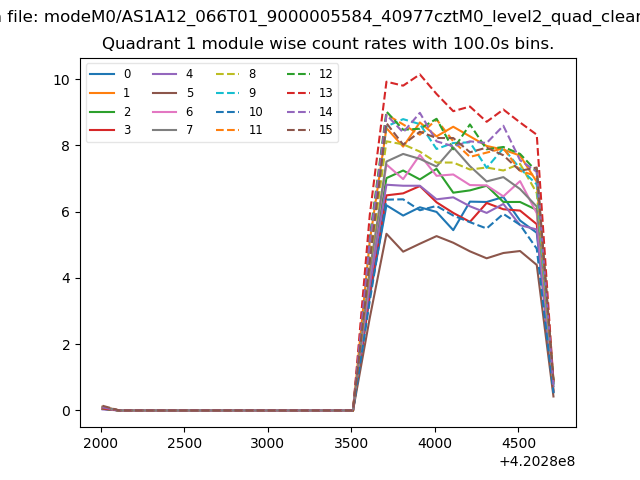
| Module-wise count rates for Quadrant A Data is divided into 100 sec bins |
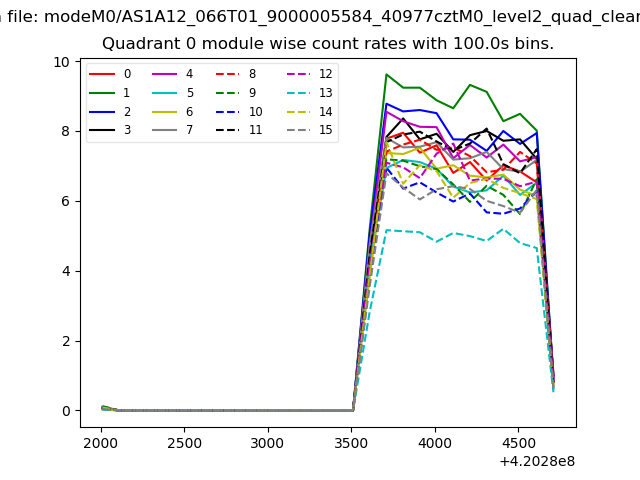 |
 |
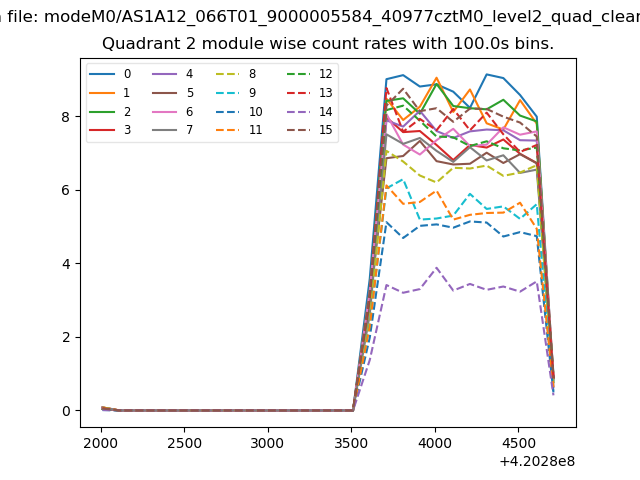
| Module-wise count rates for Quadrant B Data is divided into 100 sec bins |
 |
 |
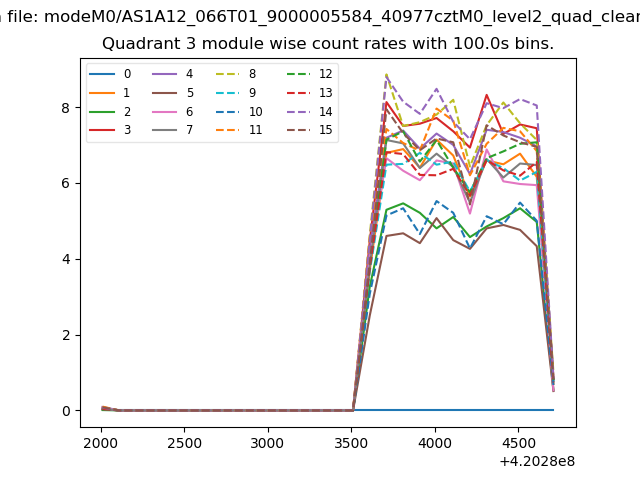
| Module-wise count rates for Quadrant C Data is divided into 100 sec bins |
 |
 |
| Module-wise count rates for Quadrant D Data is divided into 100 sec bins |
 |
 |
| Parameter | Plot |
|---|---|
| CZT HV Monitor | 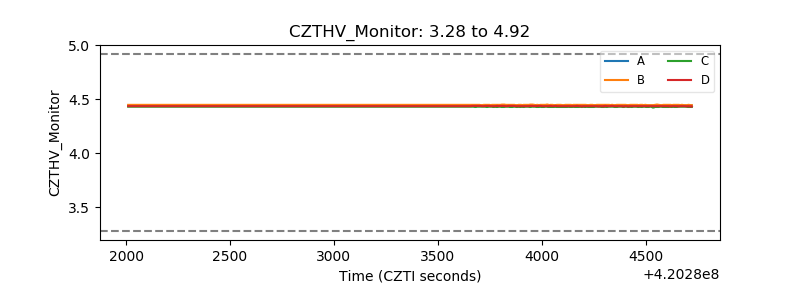 |
| D_VDD | 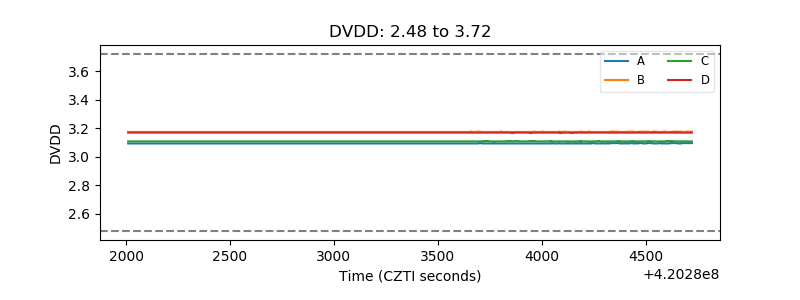 |
| Temperature 1 | 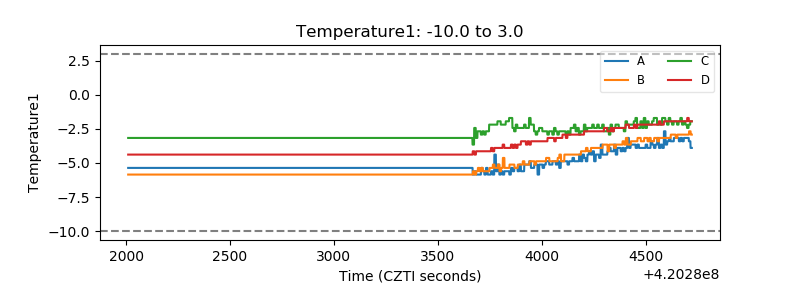 |
| Veto HV Monitor | 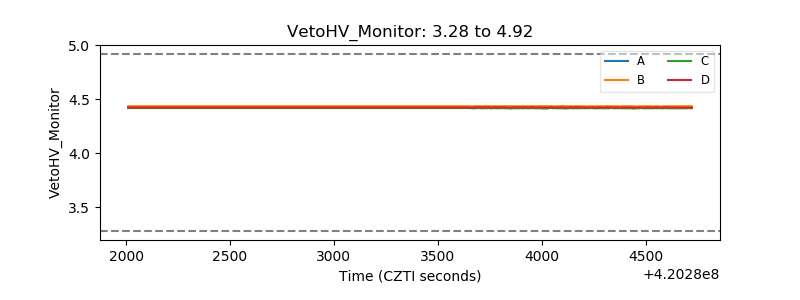 |
| Veto LLD | 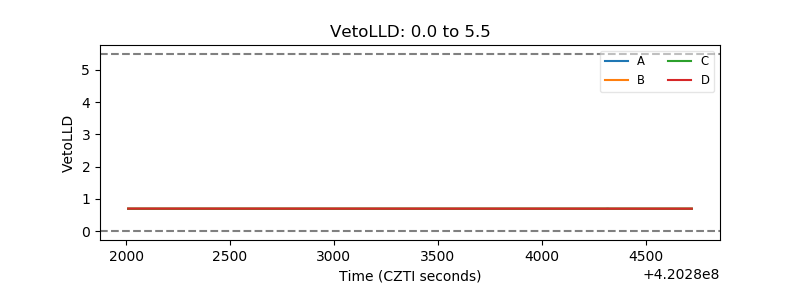 |
| Alpha Counter | 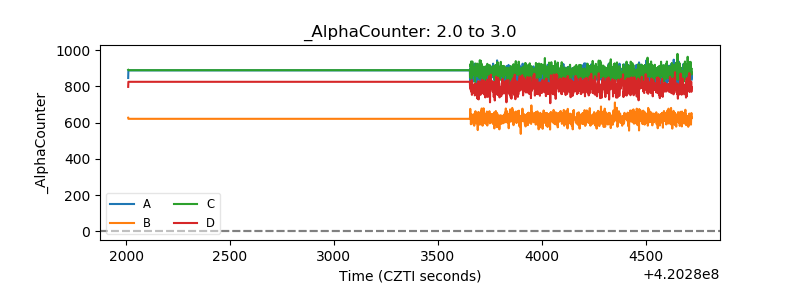 |
| _CPM_Rate | 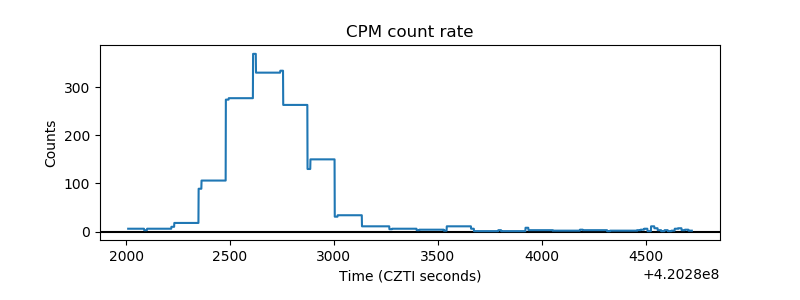 |
| CZT Counter |  |
| +2.5 Volts monitor | 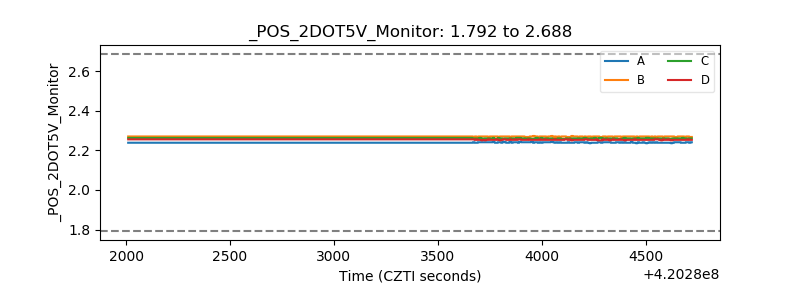 |
| +5 Volts monitor | 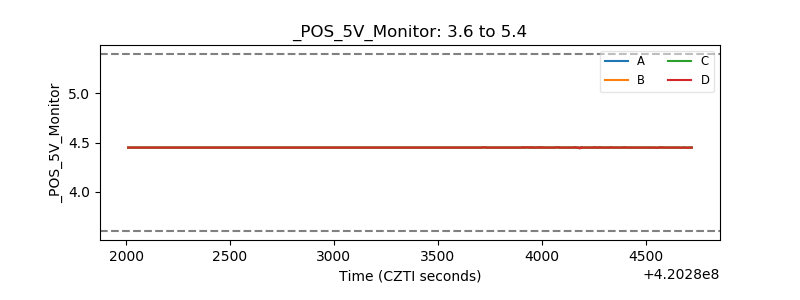 |
| _ROLL_ROT | 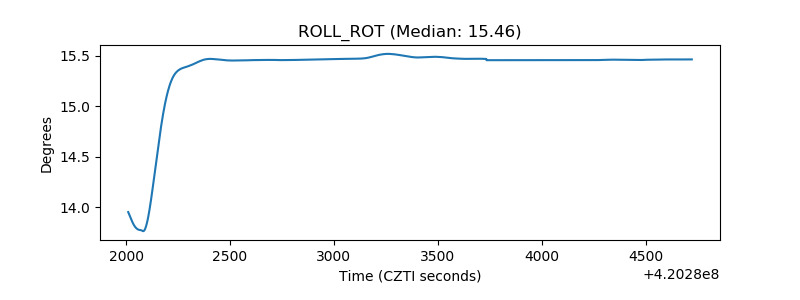 |
| _Roll_DEC | 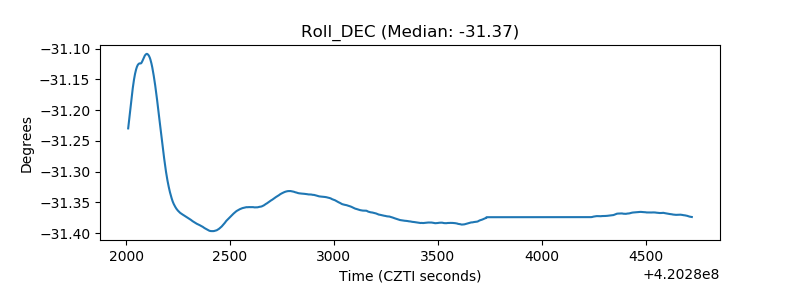 |
| _Roll_RA | 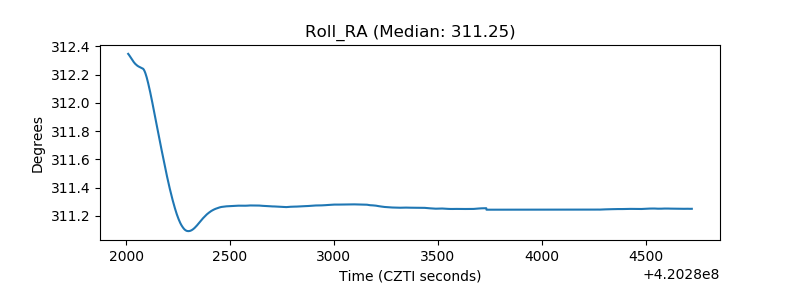 |
| Veto Counter | 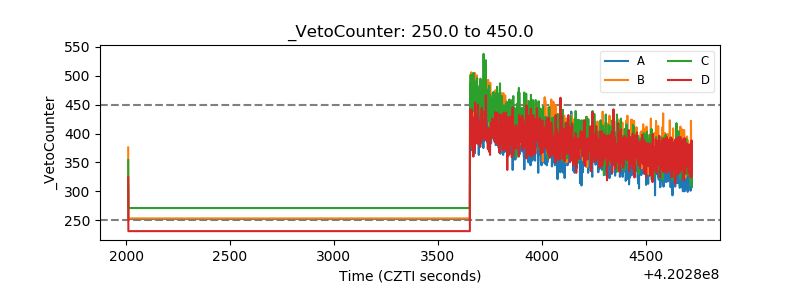 |