| Param | Original file | Final file |
|---|---|---|
| Filename | modeM0/AS1A12_066T01_9000005584_40979cztM0_level2.fits | modeM0/AS1A12_066T01_9000005584_40979cztM0_level2_quad_clean.evt |
| Size (bytes) | 359,193,600 | 92,298,240 |
| Size | 342.6 MB | 88.0 MB |
| Events in quadrant A | 2,987,485 | 630,829 |
| Events in quadrant B | 2,559,110 | 641,681 |
| Events in quadrant C | 2,833,941 | 605,312 |
| Events in quadrant D | 4,479,829 | 525,492 |
| Mode SS | |||
|---|---|---|---|
| Quadrant | BADHDUFLAG | Total packets | Discarded packets |
| A | 0 | 114 | 0 |
| B | 0 | 114 | 0 |
| C | 0 | 114 | 0 |
| D | 0 | 114 | 0 |
| Mode M0 | |||
|---|---|---|---|
| Quadrant | BADHDUFLAG | Total packets | Discarded packets |
| A | 0 | 12116 | 3 |
| B | 0 | 11422 | 2 |
| C | 0 | 11843 | 2 |
| D | 0 | 17132 | 2 |
| Mode M9 | |||
|---|---|---|---|
| Quadrant | BADHDUFLAG | Total packets | Discarded packets |
| A | 0 | 20 | 0 |
| B | 0 | 20 | 0 |
| C | 0 | 20 | 0 |
| D | 0 | 21 | 0 |
| Quadrant | Total seconds | Saturated seconds | Saturation percentage |
|---|---|---|---|
| A | 5595 | 9 | 0.160858% |
| B | 5595 | 14 | 0.250223% |
| C | 5595 | 63 | 1.126005% |
| D | 5595 | 568 | 10.151921% |
Noise dominated data is calculated using 1-second bins in cleaned event files. If a bin has >2000 counts, and if more than 50% of those come from <1% of pixels, then it is considered to be noise-dominated and hence unusable.
| Quadrant | # 1 sec bins | Bins with >0 counts | Bins with >2000 counts | High rate bins dominated by noise | Noise dominated (total time) | Noise dominated (detector-on time) | Marked lightcurve |
|---|---|---|---|---|---|---|---|
| A | 7388 | 5596 | 4 | 4 | 0.05% | 0.07% | 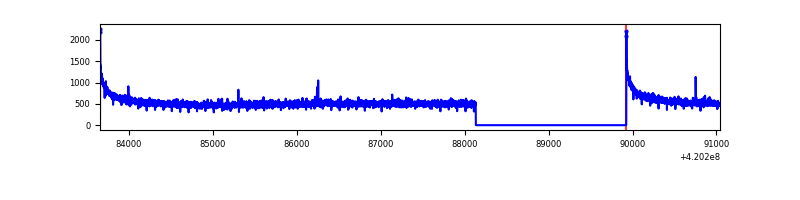 |
| B | 7388 | 5596 | 12 | 12 | 0.16% | 0.21% | 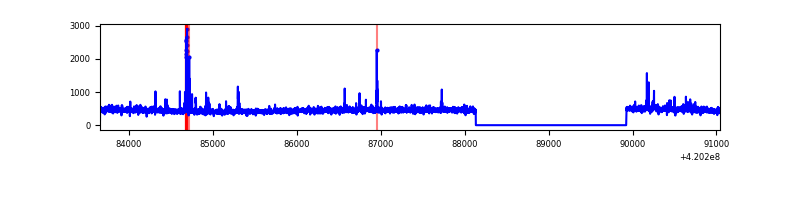 |
| C | 7388 | 5596 | 58 | 58 | 0.79% | 1.04% | 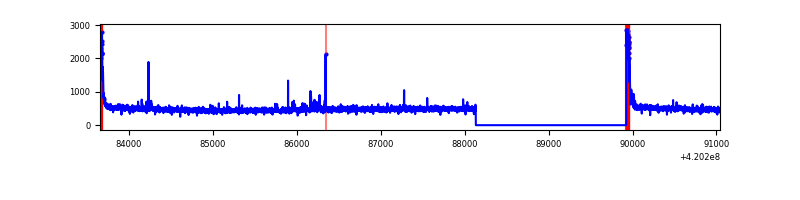 |
| D | 7388 | 5596 | 551 | 551 | 7.46% | 9.85% | 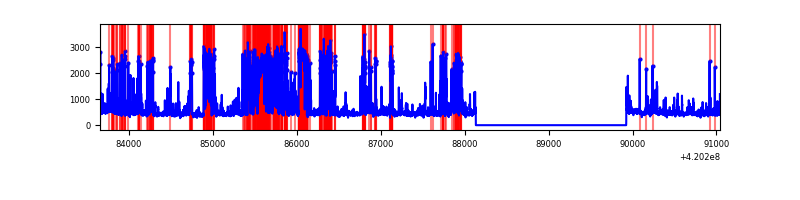 |
Top three noisy pixels from each quadrant. If the there are fewer than three noisy pixels in the level2.evt file, extra rows are filled as -1
| Pixel properties | Quadrant properties | ||||||
|---|---|---|---|---|---|---|---|
| Quadrant | DetID | PixID | Counts | Sigma | Mean | Median | Sigma |
| A | 10 | 83 | 512620 | 3937.06 | 635 | 620 | 130.0 |
| A | 2 | 79 | 14071 | 103.43 | 635 | 620 | 130.0 |
| A | 13 | 254 | 8385 | 59.71 | 635 | 620 | 130.0 |
| B | 5 | 255 | 78819 | 636.11 | 626 | 610 | 122.9 |
| B | 0 | 229 | 16256 | 127.26 | 626 | 610 | 122.9 |
| B | 12 | 111 | 15349 | 119.88 | 626 | 610 | 122.9 |
| C | 15 | 214 | 239968 | 1674.89 | 612 | 615 | 142.9 |
| C | 0 | 10 | 176726 | 1232.35 | 612 | 615 | 142.9 |
| C | 12 | 249 | 31539 | 216.39 | 612 | 615 | 142.9 |
| D | 1 | 47 | 1059625 | 7348.4 | 592 | 575 | 144.1 |
| D | 13 | 249 | 353204 | 2446.78 | 592 | 575 | 144.1 |
| D | 12 | 233 | 335250 | 2322.2 | 592 | 575 | 144.1 |
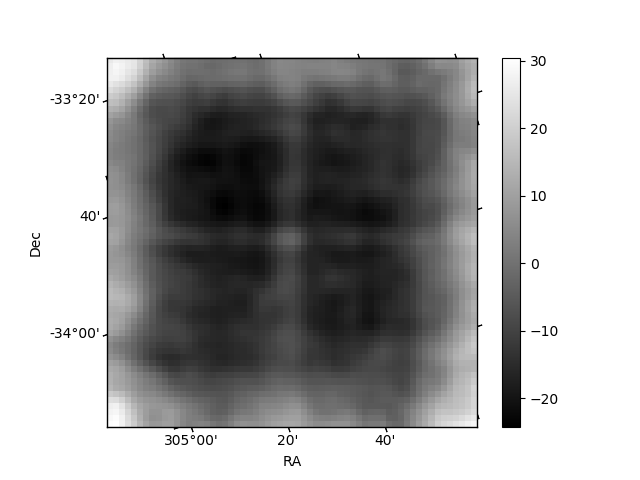
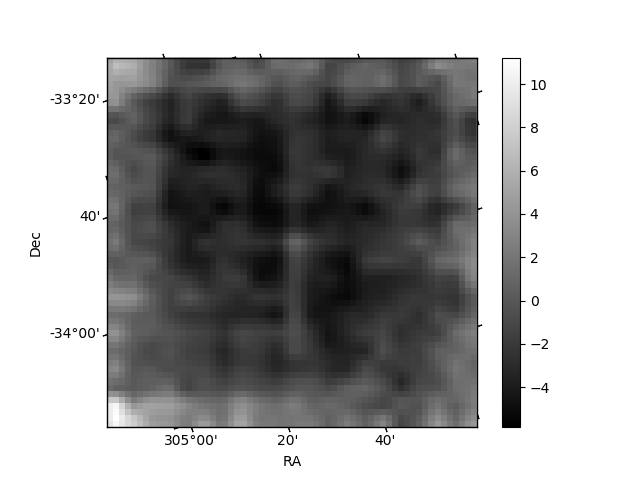
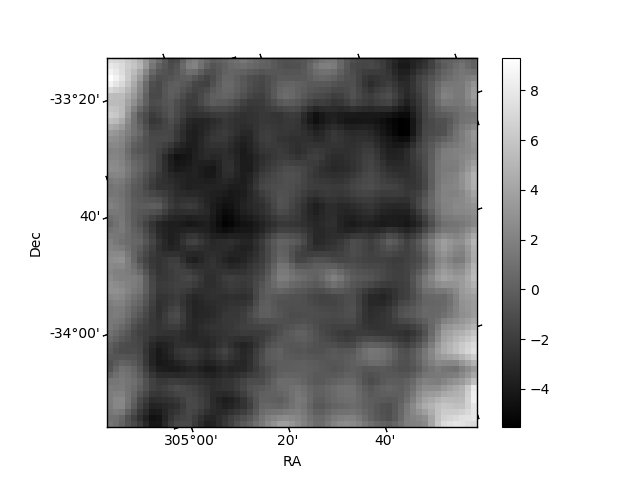
Histogram calculated using DETX and DETY for each event in the final _common_clean file
| Quadrant A | 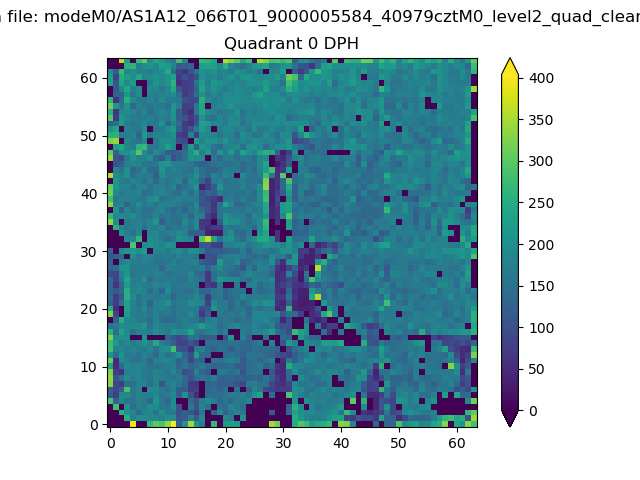 |
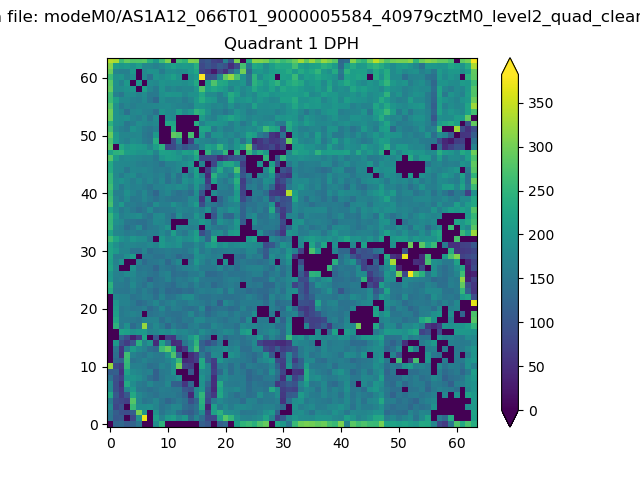 |
Quadrant B |
|---|---|---|---|
| Quadrant D | 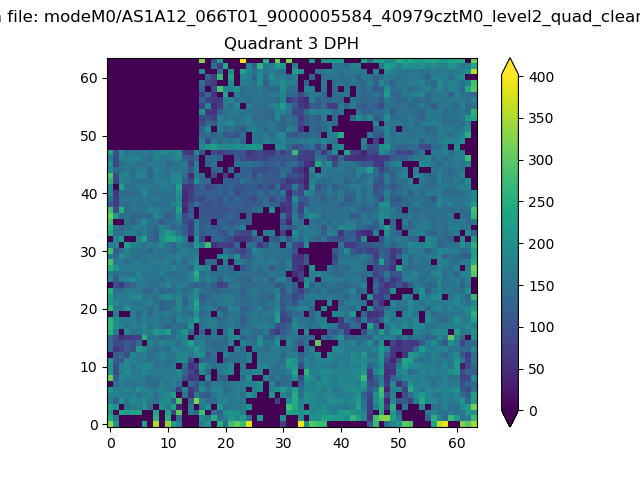 |
 |
Quadrant C |
| Plot type | Count rate plots | Images |
|---|---|---|
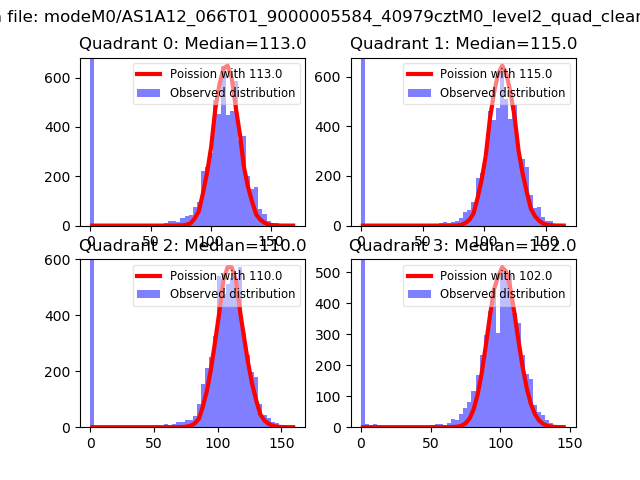
| Comparison with Poisson distribution Blue bars denote a histogram of data divided into 1 sec bins. Red curve is a Poisson curve with rate = median count rate of data. |
 |
 |
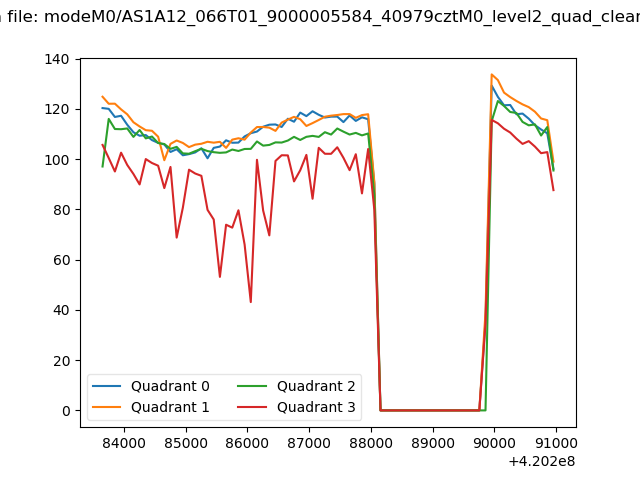
| Quadrant-wise count rates Data is divided into 100 sec bins |
 |
|
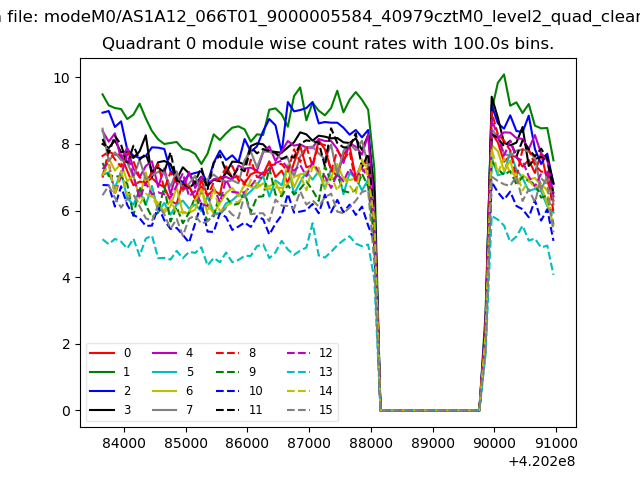
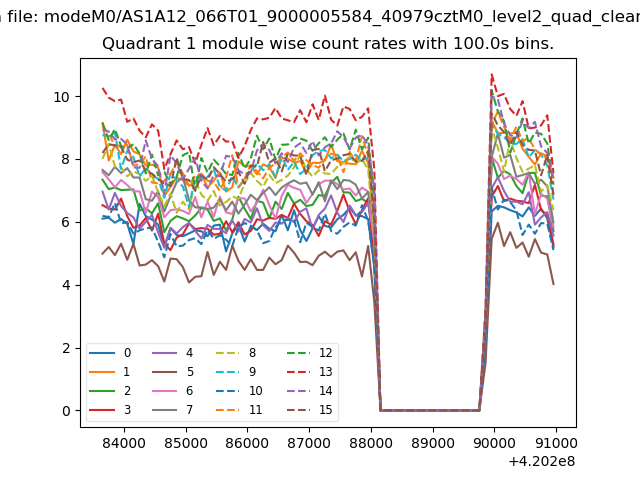
| Module-wise count rates for Quadrant A Data is divided into 100 sec bins |
 |
 |
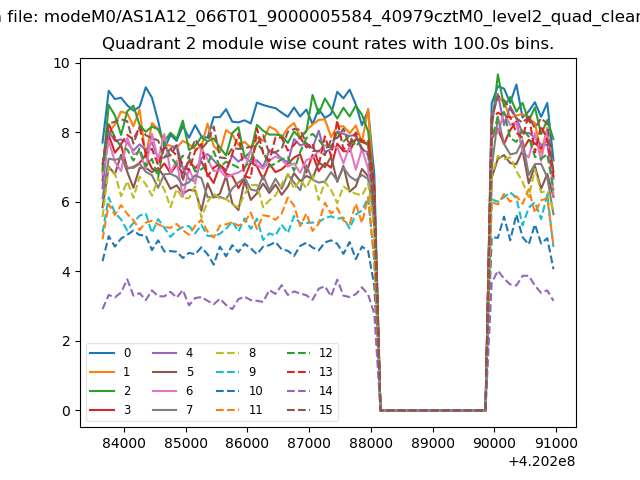
| Module-wise count rates for Quadrant B Data is divided into 100 sec bins |
 |
 |
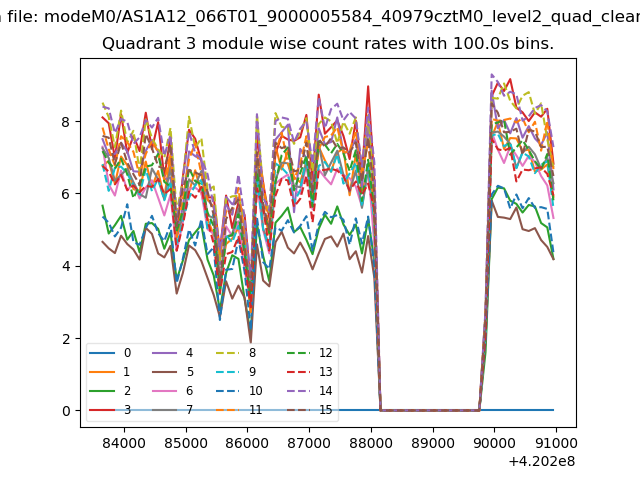
| Module-wise count rates for Quadrant C Data is divided into 100 sec bins |
 |
 |
| Module-wise count rates for Quadrant D Data is divided into 100 sec bins |
 |
 |
| Parameter | Plot |
|---|---|
| CZT HV Monitor | 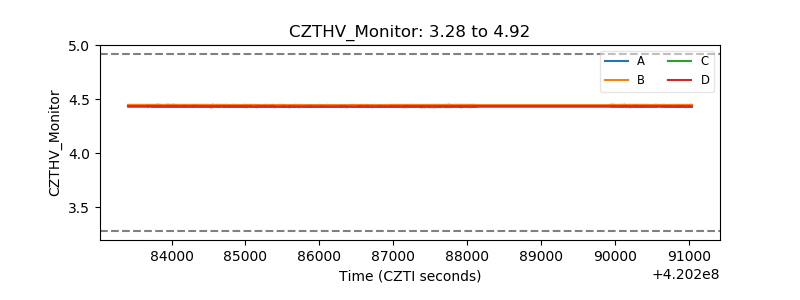 |
| D_VDD | 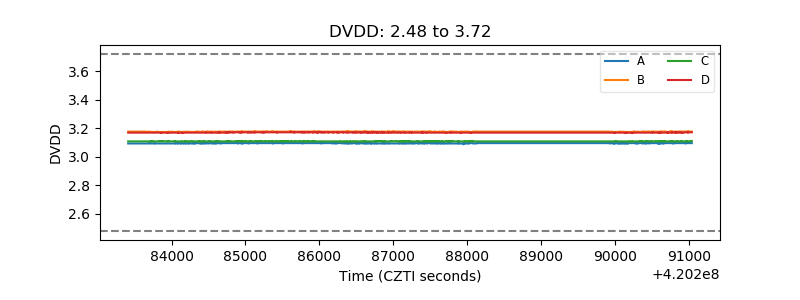 |
| Temperature 1 | 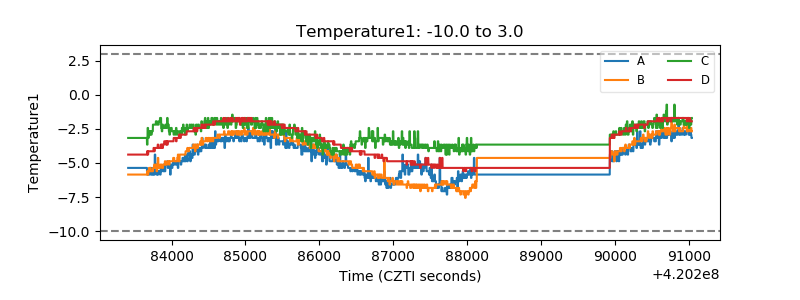 |
| Veto HV Monitor | 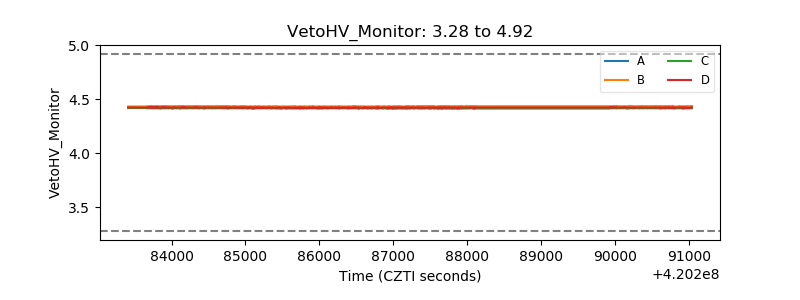 |
| Veto LLD | 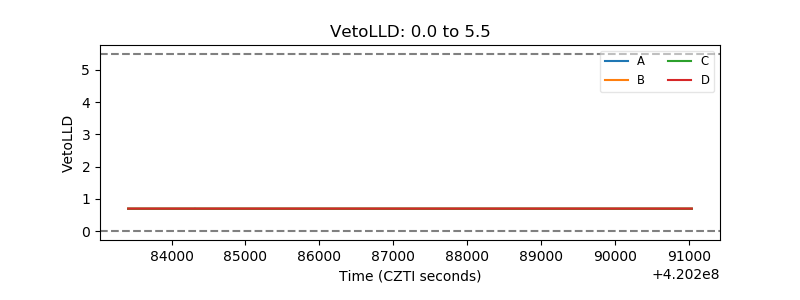 |
| Alpha Counter | 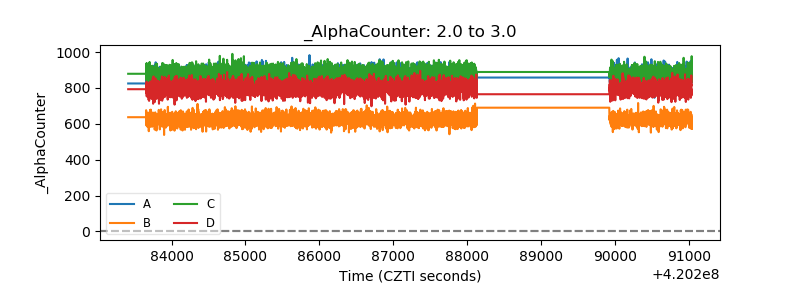 |
| _CPM_Rate | 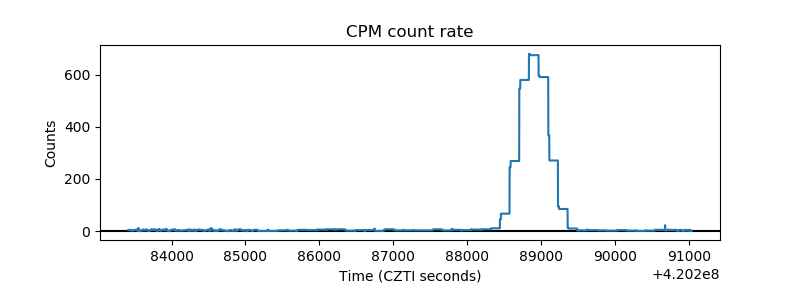 |
| CZT Counter | 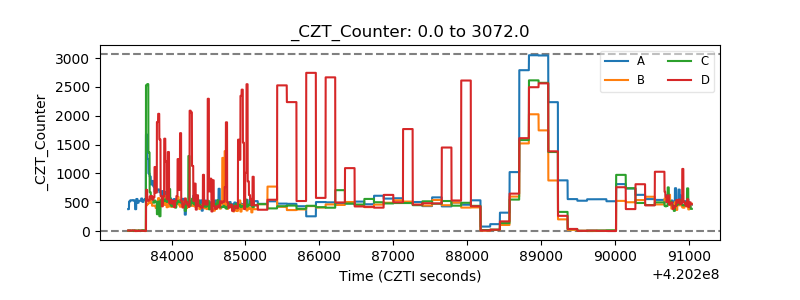 |
| +2.5 Volts monitor | 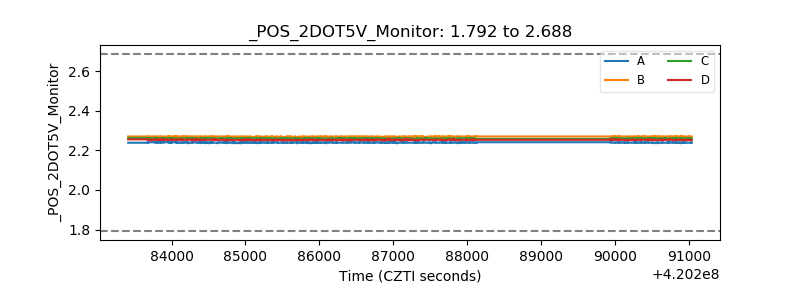 |
| +5 Volts monitor |  |
| _ROLL_ROT | 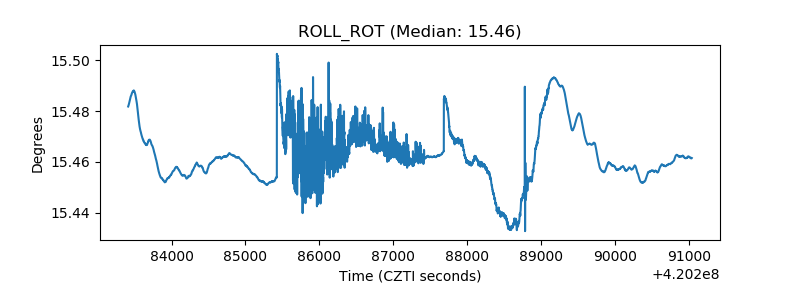 |
| _Roll_DEC | 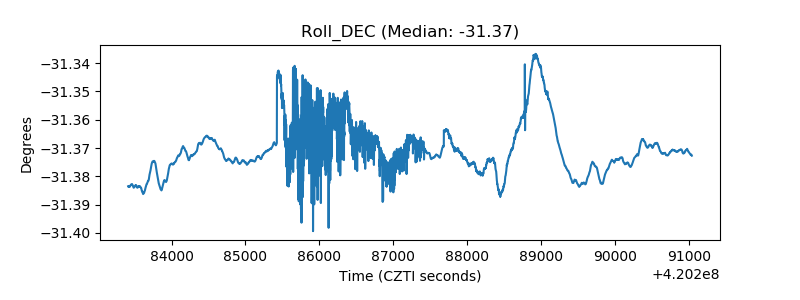 |
| _Roll_RA | 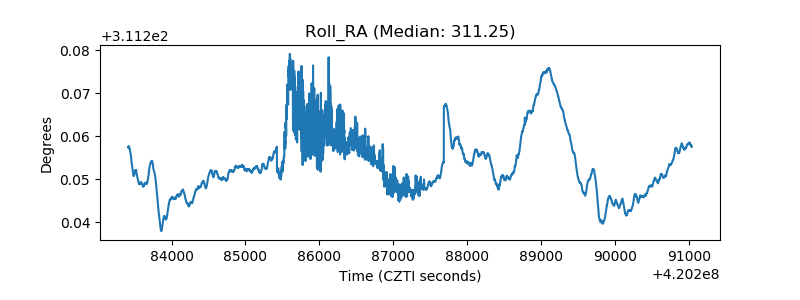 |
| Veto Counter | 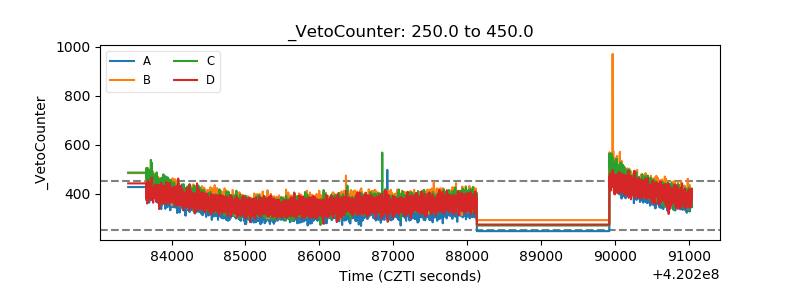 |