| Param | Original file | Final file |
|---|---|---|
| Filename | modeM0/AS1A12_066T01_9000005584_40980cztM0_level2.fits | modeM0/AS1A12_066T01_9000005584_40980cztM0_level2_quad_clean.evt |
| Size (bytes) | 323,870,400 | 94,628,160 |
| Size | 308.9 MB | 90.2 MB |
| Events in quadrant A | 3,063,413 | 644,878 |
| Events in quadrant B | 2,554,292 | 655,767 |
| Events in quadrant C | 2,793,768 | 611,115 |
| Events in quadrant D | 3,153,005 | 572,943 |
| Mode SS | |||
|---|---|---|---|
| Quadrant | BADHDUFLAG | Total packets | Discarded packets |
| A | 0 | 110 | 0 |
| B | 0 | 110 | 0 |
| C | 0 | 110 | 0 |
| D | 0 | 110 | 0 |
| Mode M0 | |||
|---|---|---|---|
| Quadrant | BADHDUFLAG | Total packets | Discarded packets |
| A | 0 | 12310 | 3 |
| B | 0 | 11082 | 2 |
| C | 0 | 11529 | 2 |
| D | 0 | 12965 | 2 |
| Mode M9 | |||
|---|---|---|---|
| Quadrant | BADHDUFLAG | Total packets | Discarded packets |
| A | 0 | 25 | 0 |
| B | 0 | 25 | 0 |
| C | 0 | 25 | 0 |
| D | 0 | 26 | 0 |
| Quadrant | Total seconds | Saturated seconds | Saturation percentage |
|---|---|---|---|
| A | 5444 | 17 | 0.312270% |
| B | 5444 | 6 | 0.110213% |
| C | 5444 | 65 | 1.193975% |
| D | 5444 | 106 | 1.947098% |
Noise dominated data is calculated using 1-second bins in cleaned event files. If a bin has >2000 counts, and if more than 50% of those come from <1% of pixels, then it is considered to be noise-dominated and hence unusable.
| Quadrant | # 1 sec bins | Bins with >0 counts | Bins with >2000 counts | High rate bins dominated by noise | Noise dominated (total time) | Noise dominated (detector-on time) | Marked lightcurve |
|---|---|---|---|---|---|---|---|
| A | 7327 | 5445 | 5 | 5 | 0.07% | 0.09% | 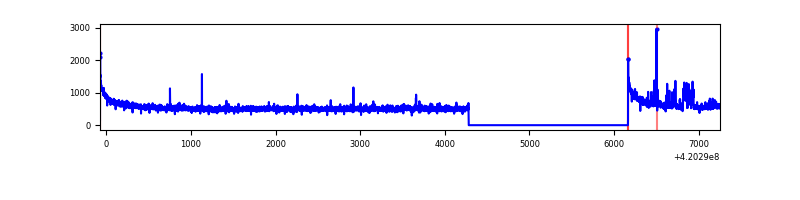 |
| B | 7327 | 5445 | 0 | 0 | 0.00% | 0.00% | 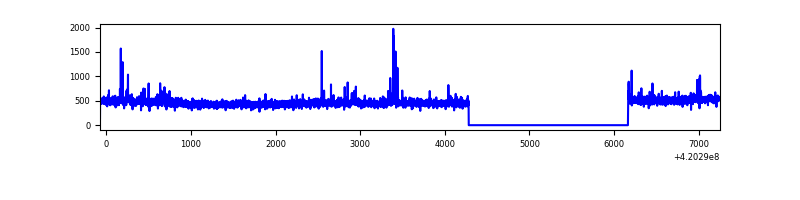 |
| C | 7327 | 5445 | 57 | 57 | 0.78% | 1.05% | 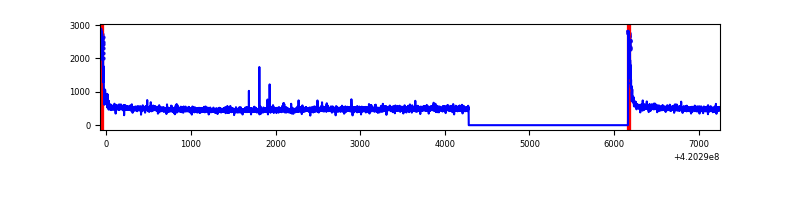 |
| D | 7327 | 5444 | 102 | 102 | 1.39% | 1.87% | 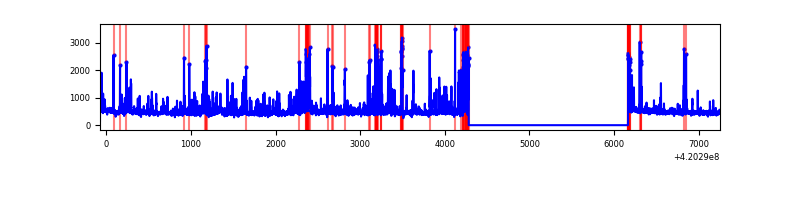 |
Top three noisy pixels from each quadrant. If the there are fewer than three noisy pixels in the level2.evt file, extra rows are filled as -1
| Pixel properties | Quadrant properties | ||||||
|---|---|---|---|---|---|---|---|
| Quadrant | DetID | PixID | Counts | Sigma | Mean | Median | Sigma |
| A | 10 | 83 | 507920 | 3931.84 | 634 | 622 | 129.0 |
| A | 12 | 189 | 67257 | 516.46 | 634 | 622 | 129.0 |
| A | 13 | 248 | 28387 | 215.19 | 634 | 622 | 129.0 |
| B | 0 | 229 | 48023 | 393.16 | 625 | 608 | 120.6 |
| B | 5 | 255 | 47379 | 387.82 | 625 | 608 | 120.6 |
| B | 12 | 111 | 15215 | 121.12 | 625 | 608 | 120.6 |
| C | 15 | 214 | 233431 | 1634.51 | 607 | 611 | 142.4 |
| C | 0 | 10 | 179800 | 1258.0 | 607 | 611 | 142.4 |
| C | 12 | 249 | 11630 | 77.36 | 607 | 611 | 142.4 |
| D | 2 | 249 | 351972 | 2346.05 | 614 | 596 | 149.8 |
| D | 12 | 233 | 172358 | 1146.81 | 614 | 596 | 149.8 |
| D | 1 | 47 | 106402 | 706.44 | 614 | 596 | 149.8 |
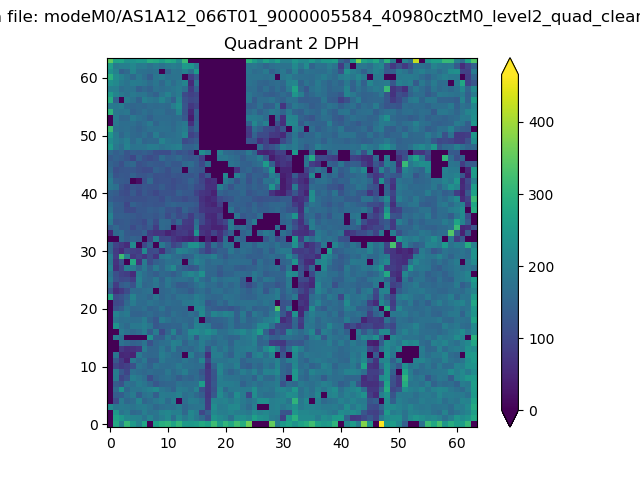
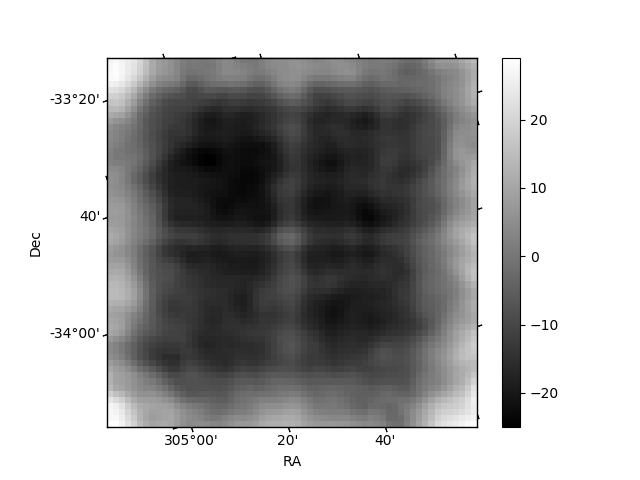
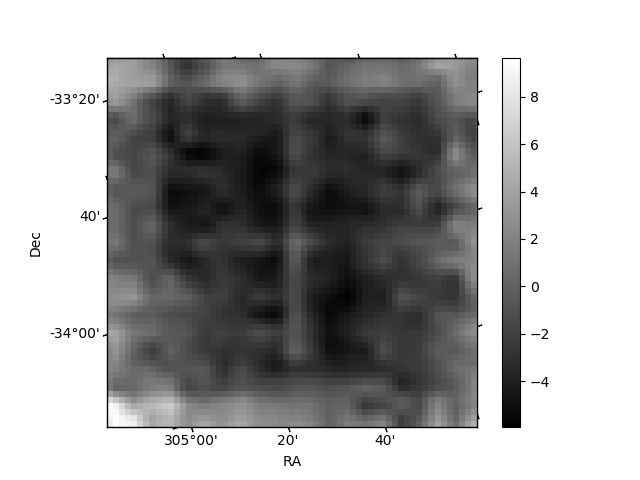
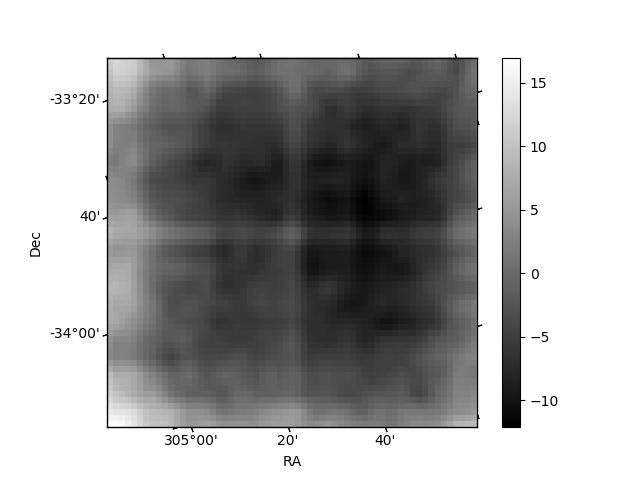
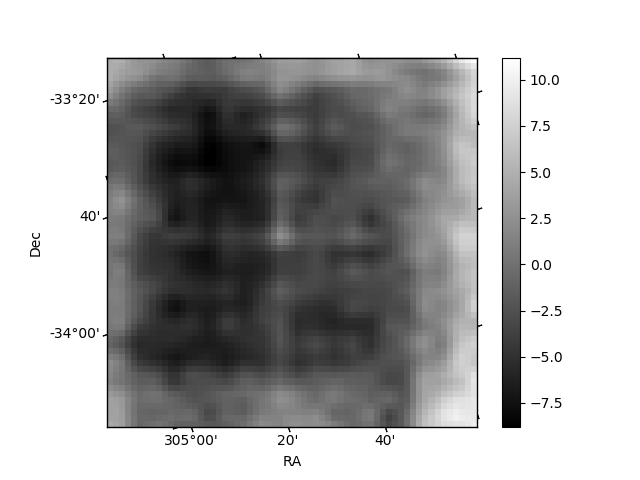
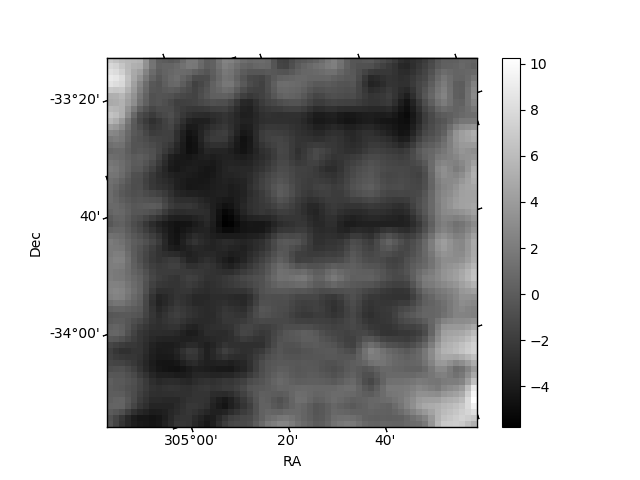
Histogram calculated using DETX and DETY for each event in the final _common_clean file
| Quadrant A | 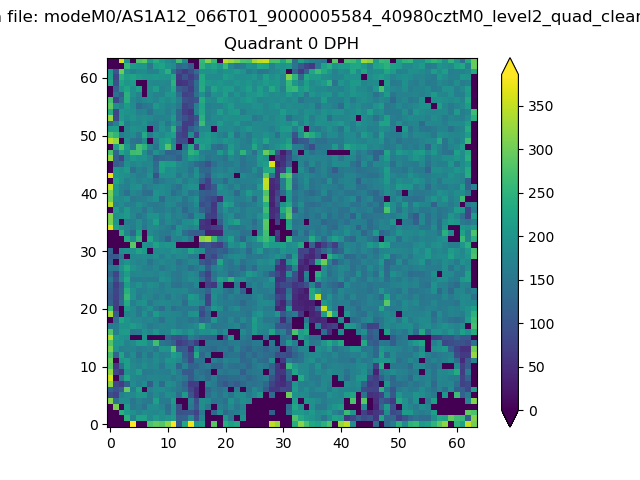 |
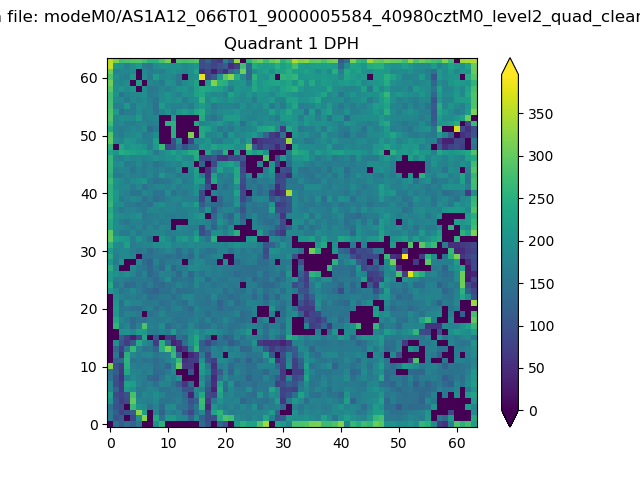 |
Quadrant B |
|---|---|---|---|
| Quadrant D | 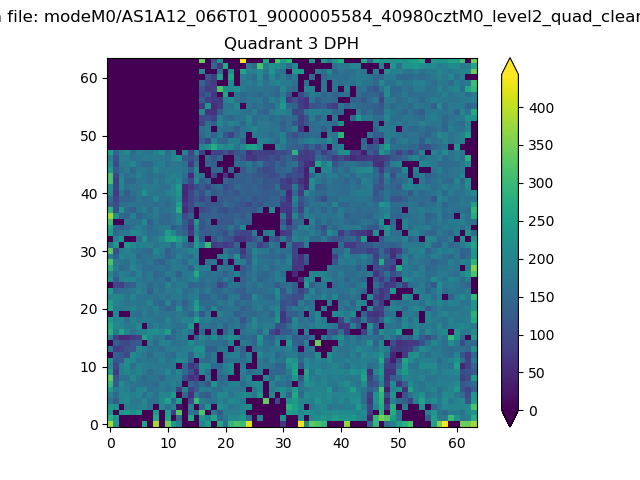 |
 |
Quadrant C |
| Plot type | Count rate plots | Images |
|---|---|---|
| Comparison with Poisson distribution Blue bars denote a histogram of data divided into 1 sec bins. Red curve is a Poisson curve with rate = median count rate of data. |
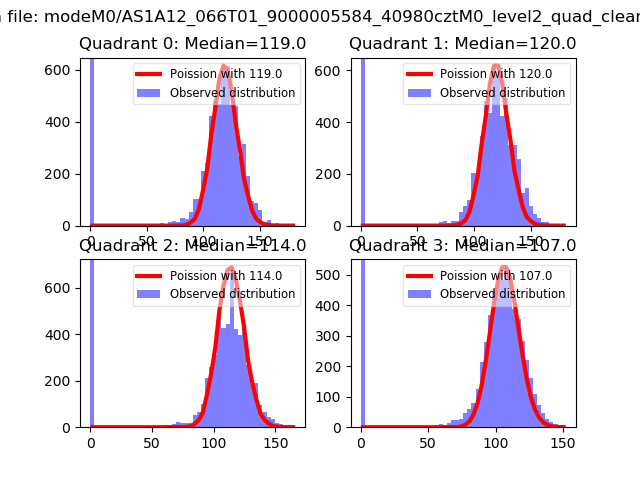 |
 |
| Quadrant-wise count rates Data is divided into 100 sec bins |
 |
|
| Module-wise count rates for Quadrant A Data is divided into 100 sec bins |
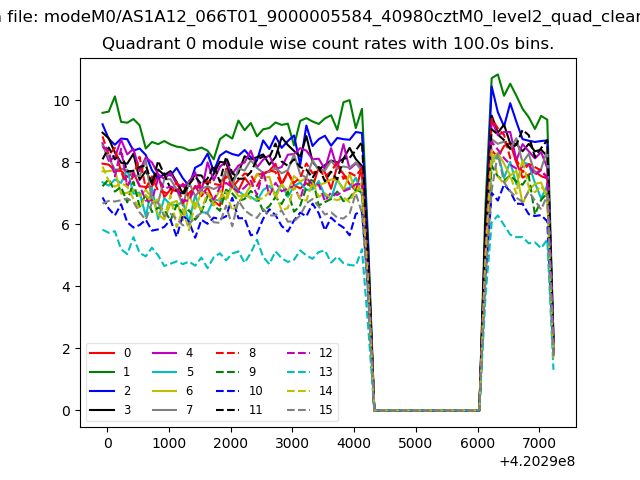 |
 |
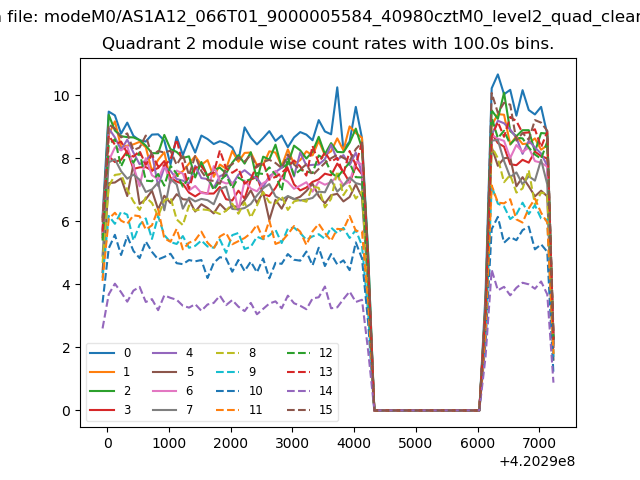
| Module-wise count rates for Quadrant B Data is divided into 100 sec bins |
 |
 |
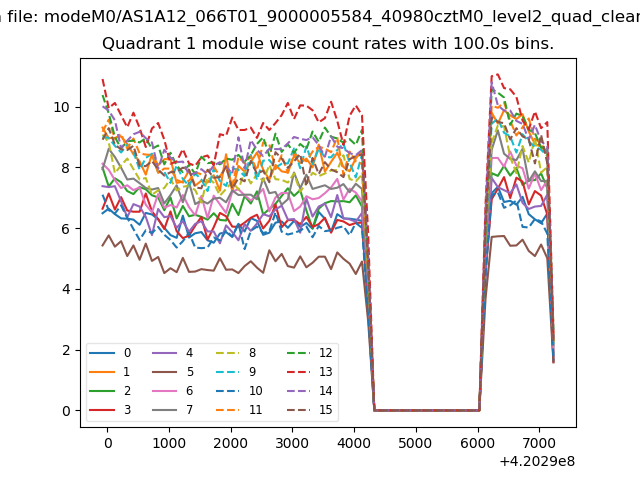
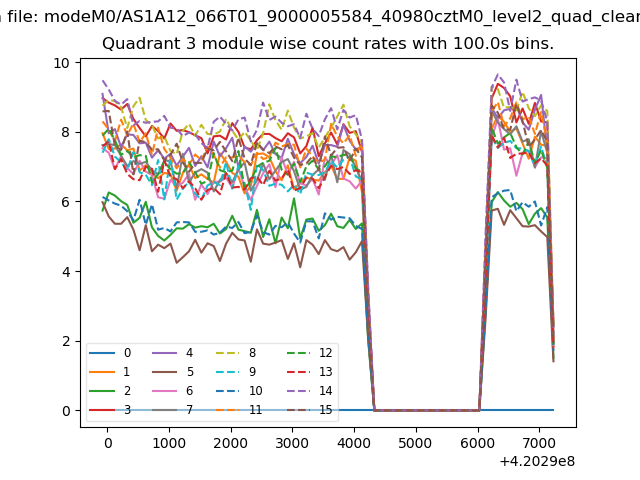
| Module-wise count rates for Quadrant C Data is divided into 100 sec bins |
 |
 |
| Module-wise count rates for Quadrant D Data is divided into 100 sec bins |
 |
 |
| Parameter | Plot |
|---|---|
| CZT HV Monitor | 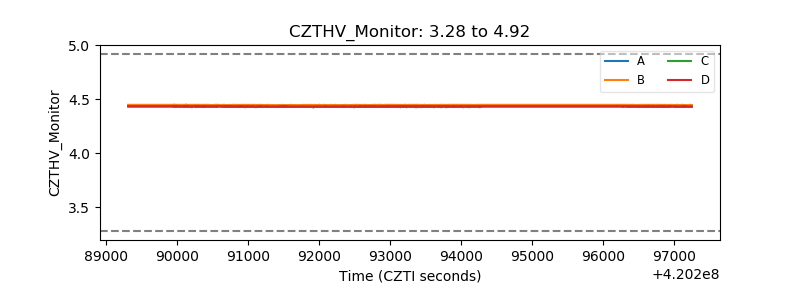 |
| D_VDD | 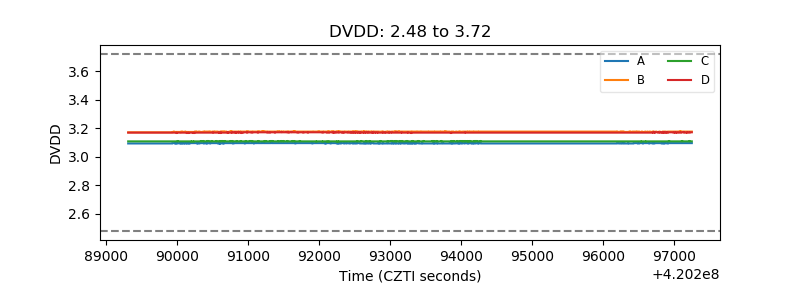 |
| Temperature 1 | 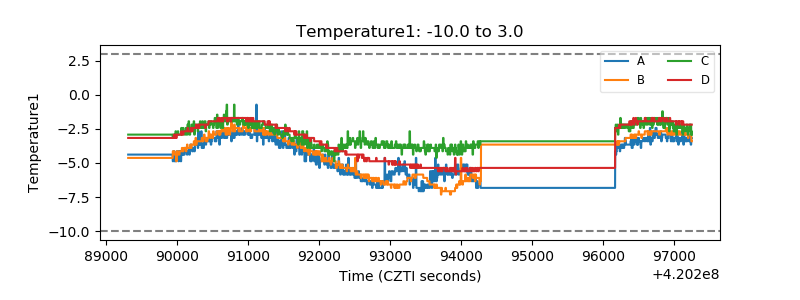 |
| Veto HV Monitor | 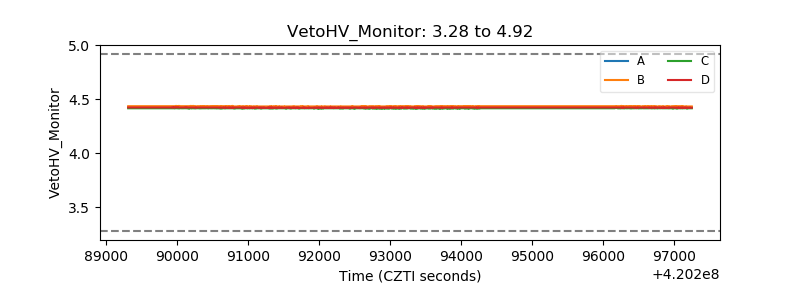 |
| Veto LLD | 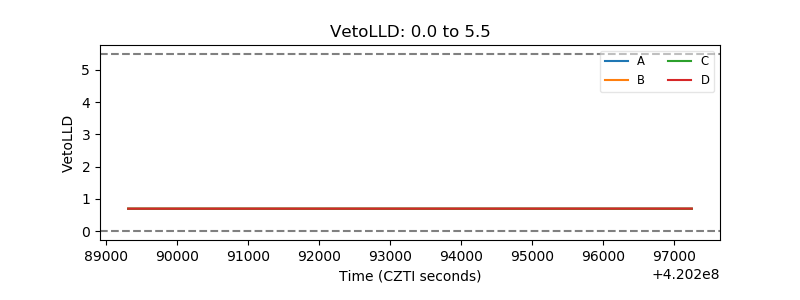 |
| Alpha Counter | 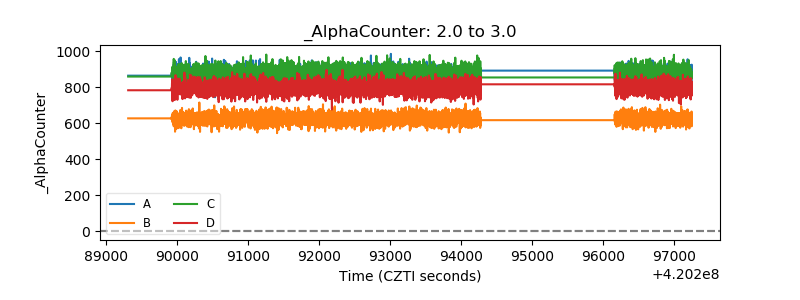 |
| _CPM_Rate | 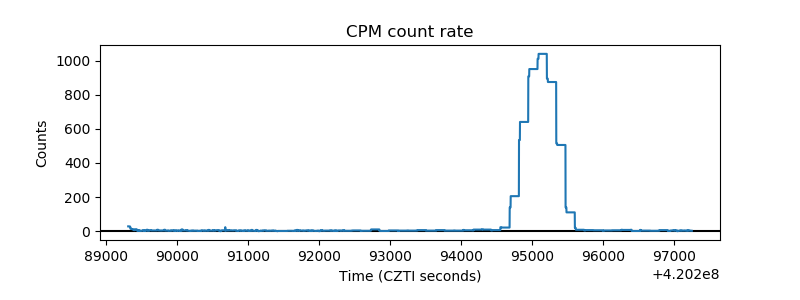 |
| CZT Counter | 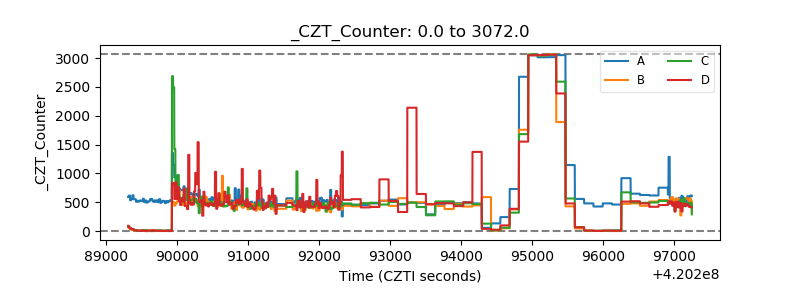 |
| +2.5 Volts monitor | 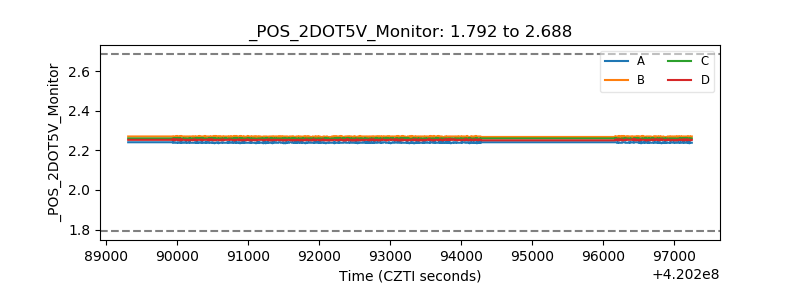 |
| +5 Volts monitor |  |
| _ROLL_ROT | 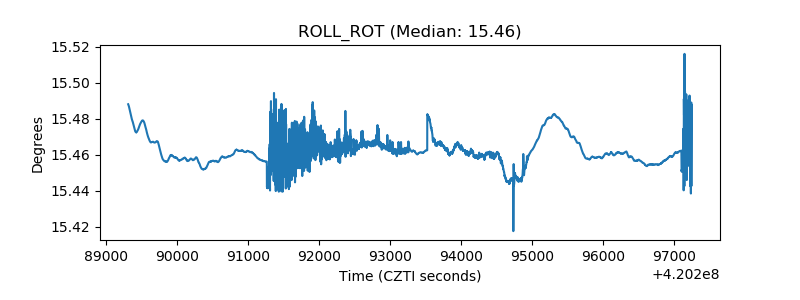 |
| _Roll_DEC | 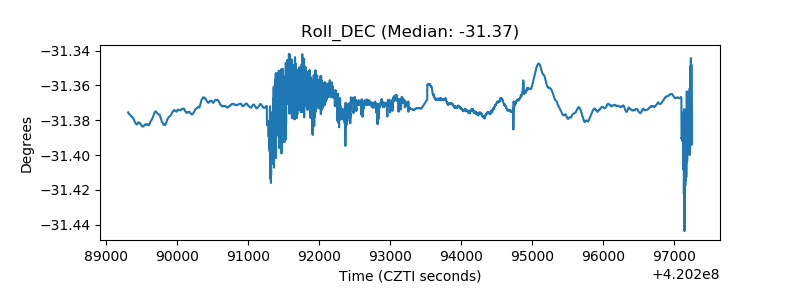 |
| _Roll_RA | 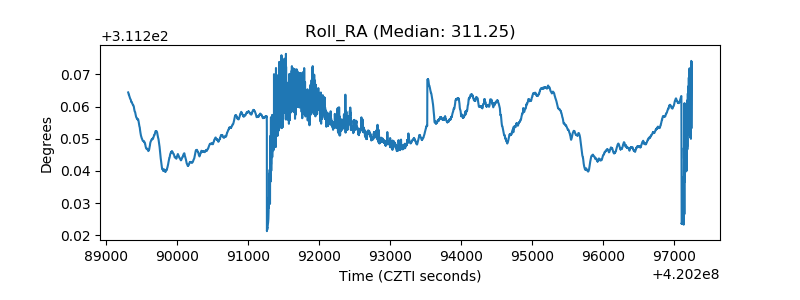 |
| Veto Counter | 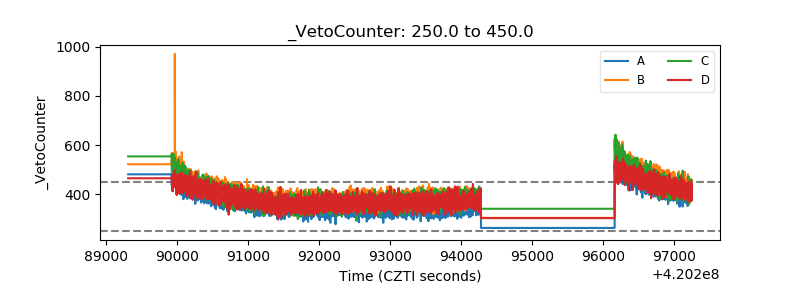 |