| Param | Original file | Final file |
|---|---|---|
| Filename | modeM0/AS1A12_066T01_9000005584_40981cztM0_level2.fits | modeM0/AS1A12_066T01_9000005584_40981cztM0_level2_quad_clean.evt |
| Size (bytes) | 317,350,080 | 92,900,160 |
| Size | 302.6 MB | 88.6 MB |
| Events in quadrant A | 3,004,783 | 641,196 |
| Events in quadrant B | 2,575,359 | 653,404 |
| Events in quadrant C | 2,736,250 | 604,747 |
| Events in quadrant D | 3,028,125 | 551,637 |
| Mode SS | |||
|---|---|---|---|
| Quadrant | BADHDUFLAG | Total packets | Discarded packets |
| A | 0 | 106 | 0 |
| B | 0 | 106 | 0 |
| C | 0 | 106 | 0 |
| D | 0 | 106 | 0 |
| Mode M0 | |||
|---|---|---|---|
| Quadrant | BADHDUFLAG | Total packets | Discarded packets |
| A | 0 | 12065 | 3 |
| B | 0 | 10724 | 2 |
| C | 0 | 11096 | 2 |
| D | 0 | 12388 | 2 |
| Mode M9 | |||
|---|---|---|---|
| Quadrant | BADHDUFLAG | Total packets | Discarded packets |
| A | 0 | 27 | 0 |
| B | 0 | 27 | 0 |
| C | 0 | 27 | 0 |
| D | 0 | 28 | 0 |
| Quadrant | Total seconds | Saturated seconds | Saturation percentage |
|---|---|---|---|
| A | 5168 | 18 | 0.348297% |
| B | 5168 | 12 | 0.232198% |
| C | 5168 | 67 | 1.296440% |
| D | 5168 | 207 | 4.005418% |
Noise dominated data is calculated using 1-second bins in cleaned event files. If a bin has >2000 counts, and if more than 50% of those come from <1% of pixels, then it is considered to be noise-dominated and hence unusable.
| Quadrant | # 1 sec bins | Bins with >0 counts | Bins with >2000 counts | High rate bins dominated by noise | Noise dominated (total time) | Noise dominated (detector-on time) | Marked lightcurve |
|---|---|---|---|---|---|---|---|
| A | 7171 | 5169 | 5 | 5 | 0.07% | 0.10% | 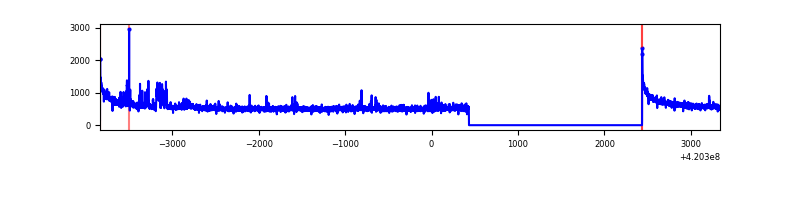 |
| B | 7171 | 5169 | 4 | 4 | 0.06% | 0.08% | 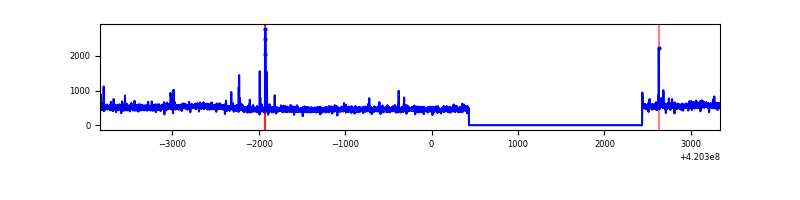 |
| C | 7171 | 5169 | 61 | 61 | 0.85% | 1.18% | 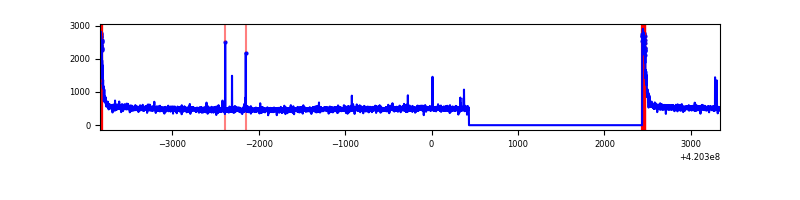 |
| D | 7171 | 5169 | 193 | 193 | 2.69% | 3.73% | 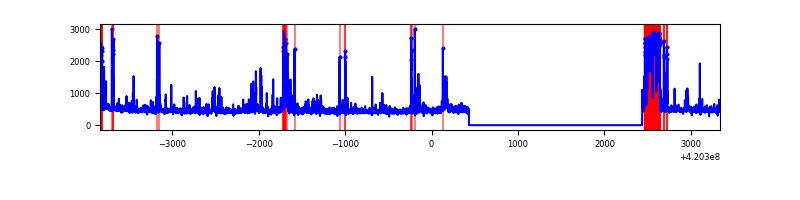 |
Top three noisy pixels from each quadrant. If the there are fewer than three noisy pixels in the level2.evt file, extra rows are filled as -1
| Pixel properties | Quadrant properties | ||||||
|---|---|---|---|---|---|---|---|
| Quadrant | DetID | PixID | Counts | Sigma | Mean | Median | Sigma |
| A | 10 | 83 | 493415 | 3929.43 | 618 | 606 | 125.4 |
| A | 12 | 189 | 73037 | 577.53 | 618 | 606 | 125.4 |
| A | 13 | 248 | 35470 | 277.99 | 618 | 606 | 125.4 |
| B | 0 | 229 | 133960 | 1136.43 | 611 | 595 | 117.4 |
| B | 5 | 255 | 43732 | 367.58 | 611 | 595 | 117.4 |
| B | 12 | 111 | 14477 | 118.29 | 611 | 595 | 117.4 |
| C | 15 | 214 | 222090 | 1614.26 | 590 | 594 | 137.2 |
| C | 0 | 10 | 190933 | 1387.19 | 590 | 594 | 137.2 |
| C | 12 | 249 | 21641 | 153.39 | 590 | 594 | 137.2 |
| D | 13 | 249 | 432672 | 3024.07 | 584 | 567 | 142.9 |
| D | 2 | 249 | 153246 | 1068.52 | 584 | 567 | 142.9 |
| D | 12 | 233 | 74254 | 515.7 | 584 | 567 | 142.9 |
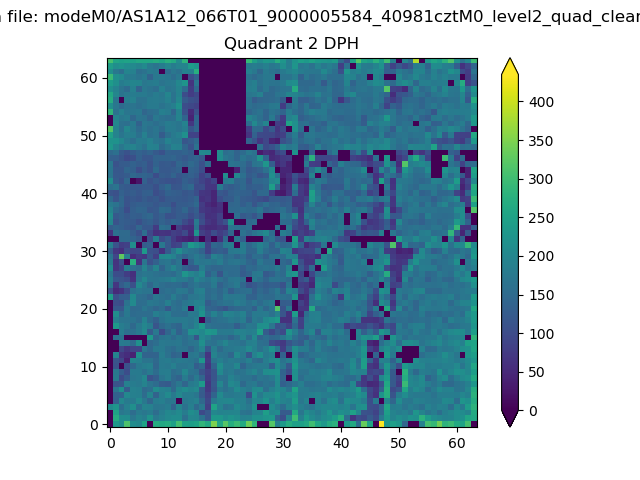
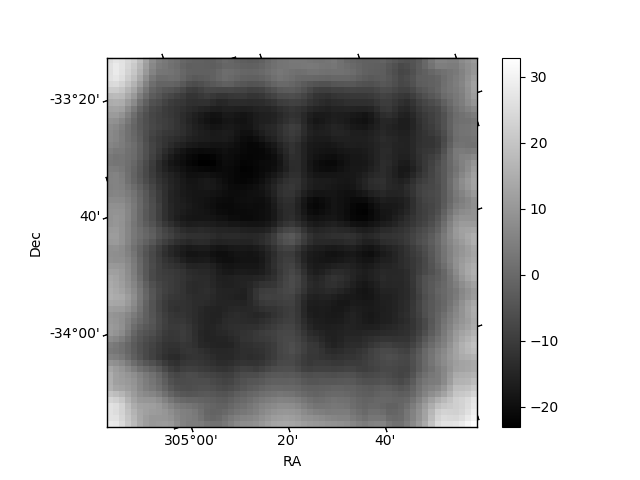
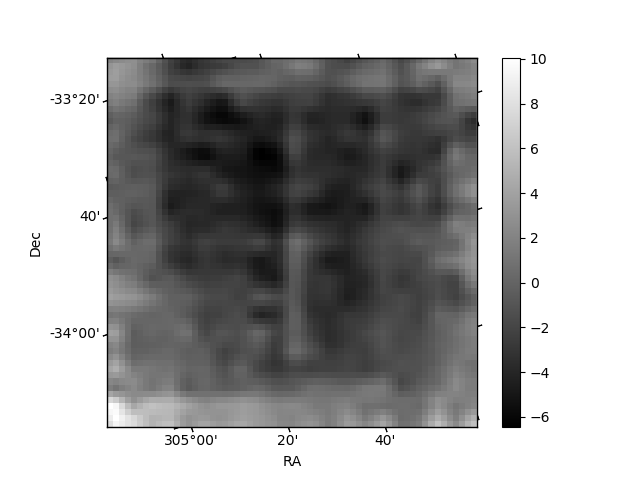
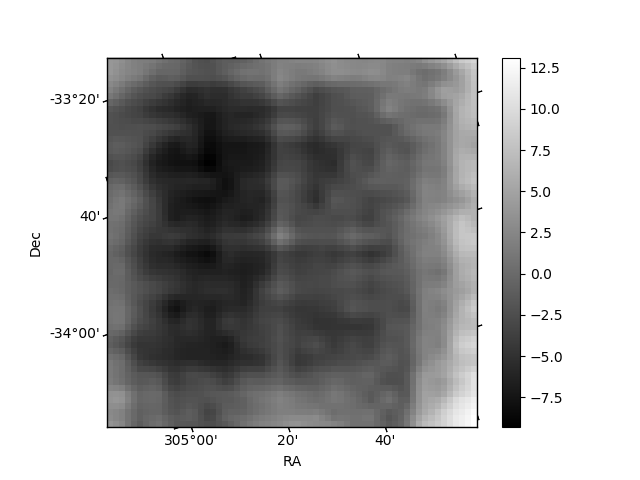
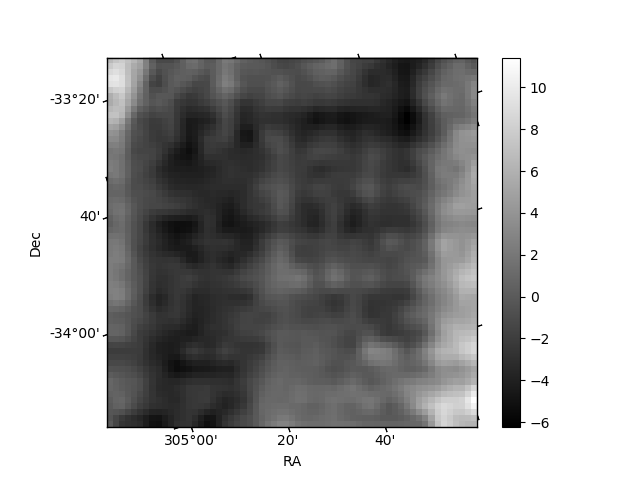
Histogram calculated using DETX and DETY for each event in the final _common_clean file
| Quadrant A | 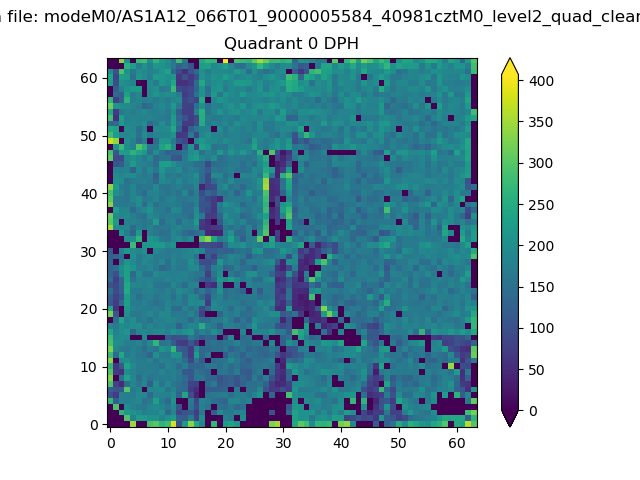 |
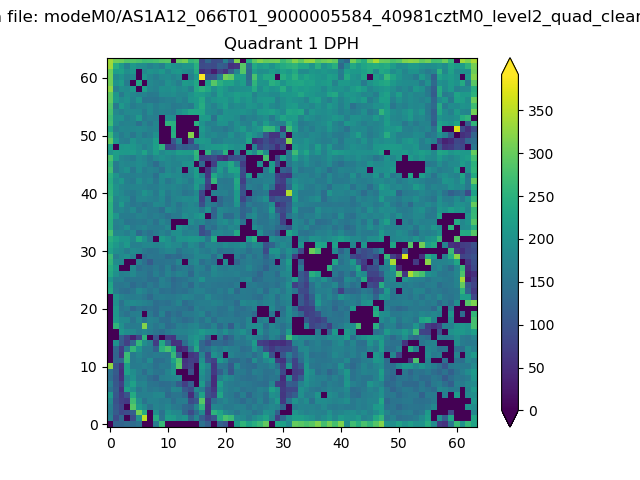 |
Quadrant B |
|---|---|---|---|
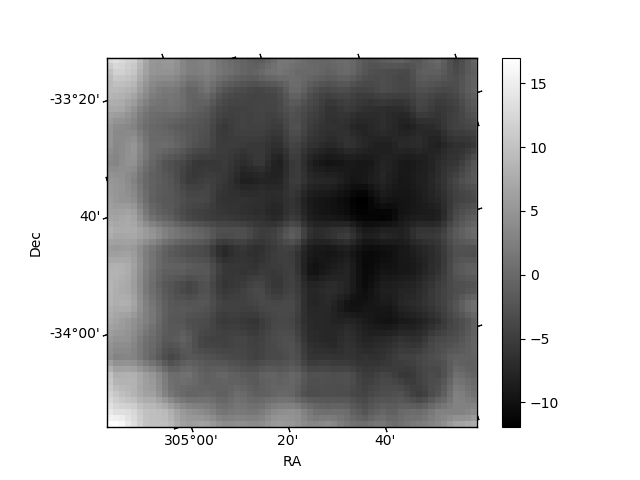
| Quadrant D | 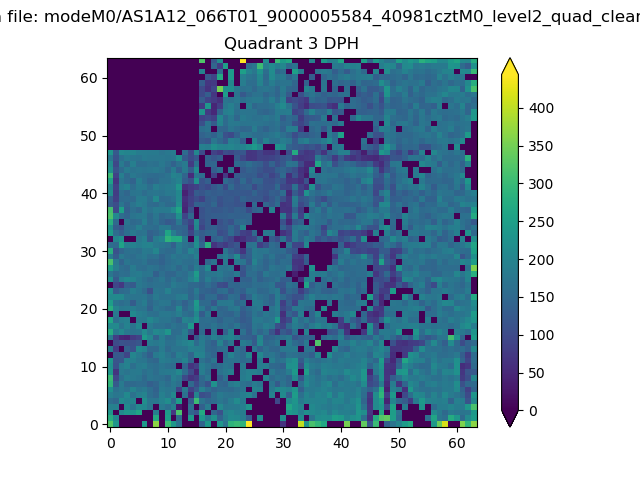 |
 |
Quadrant C |
| Plot type | Count rate plots | Images |
|---|---|---|
| Comparison with Poisson distribution Blue bars denote a histogram of data divided into 1 sec bins. Red curve is a Poisson curve with rate = median count rate of data. |
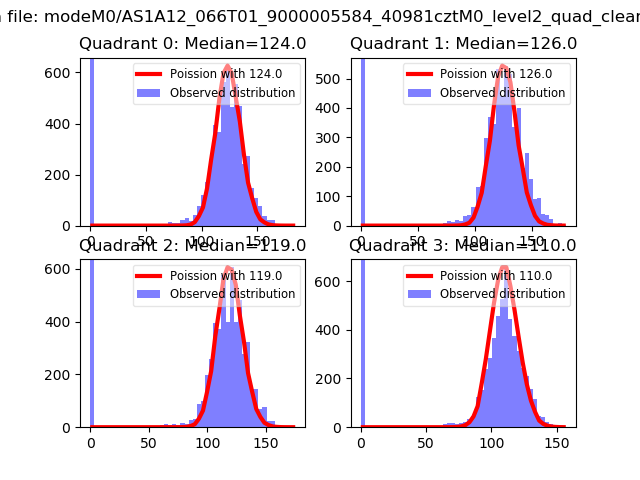 |
 |
| Quadrant-wise count rates Data is divided into 100 sec bins |
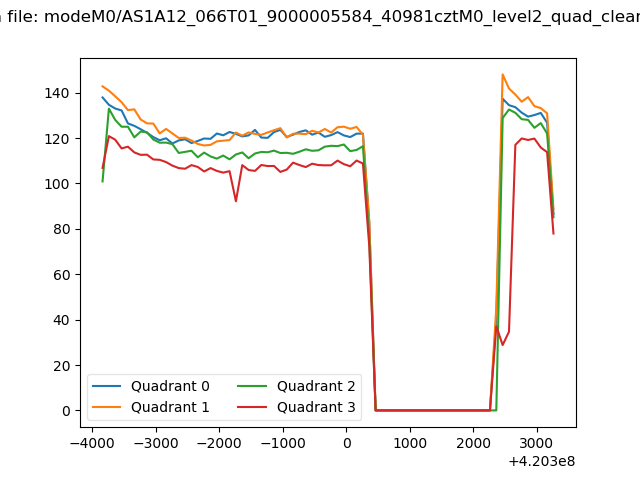 |
|
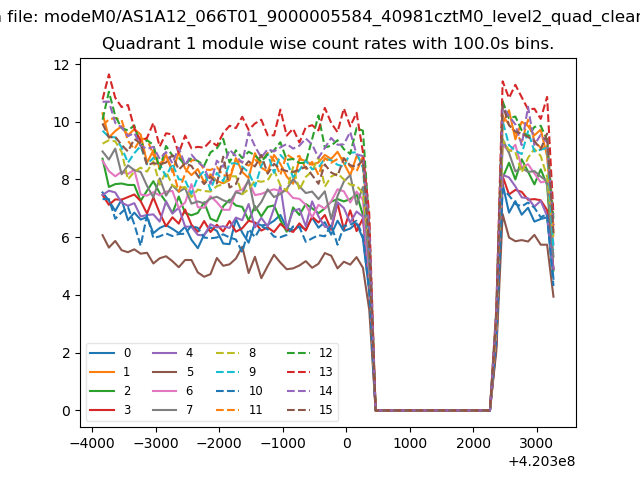
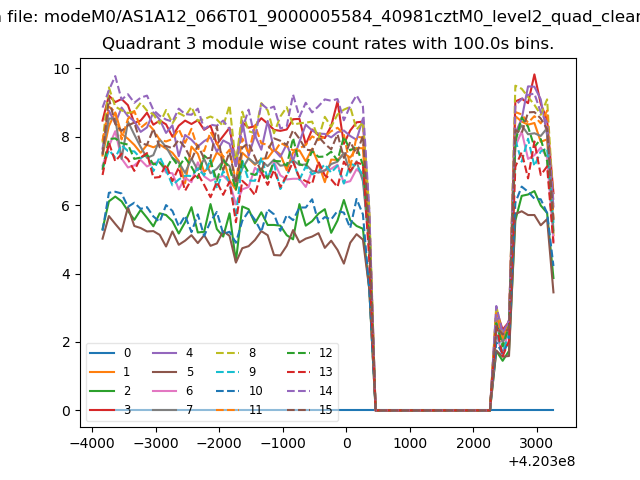
| Module-wise count rates for Quadrant A Data is divided into 100 sec bins |
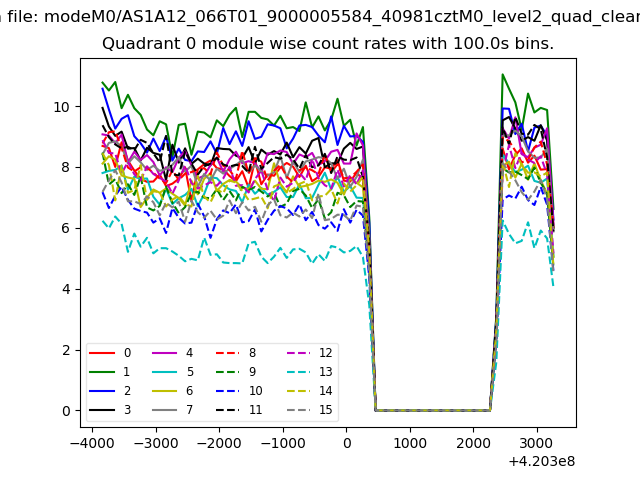 |
 |
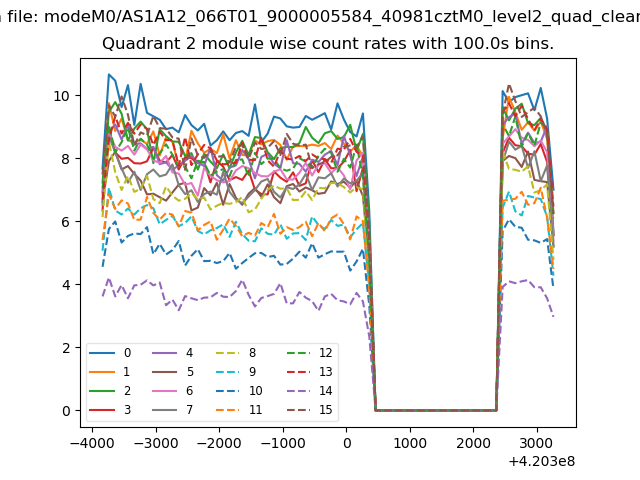
| Module-wise count rates for Quadrant B Data is divided into 100 sec bins |
 |
 |
| Module-wise count rates for Quadrant C Data is divided into 100 sec bins |
 |
 |
| Module-wise count rates for Quadrant D Data is divided into 100 sec bins |
 |
 |
| Parameter | Plot |
|---|---|
| CZT HV Monitor |  |
| D_VDD | 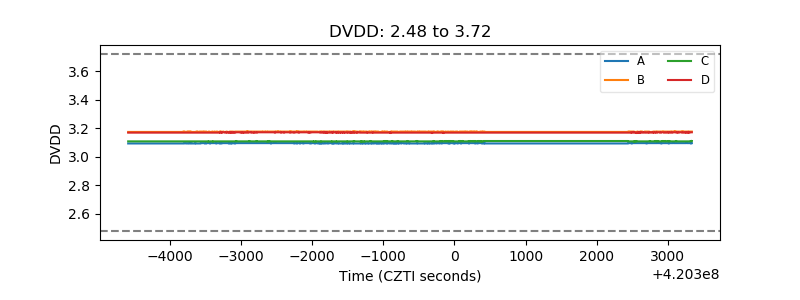 |
| Temperature 1 | 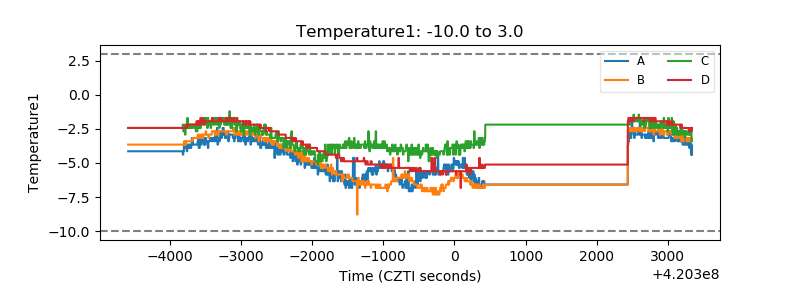 |
| Veto HV Monitor | 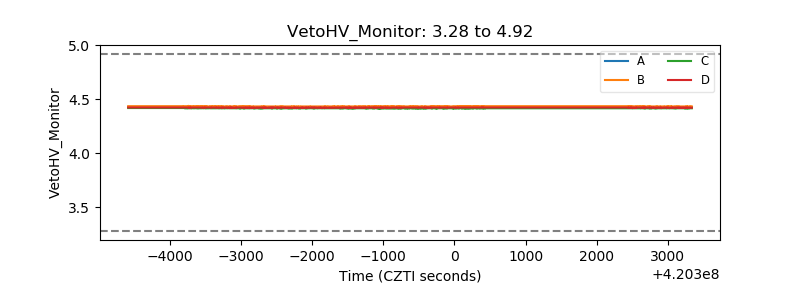 |
| Veto LLD | 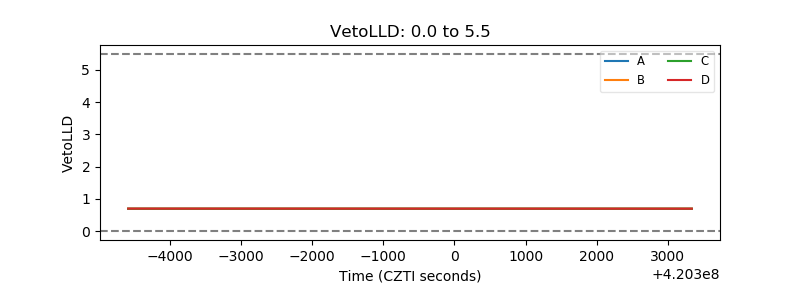 |
| Alpha Counter | 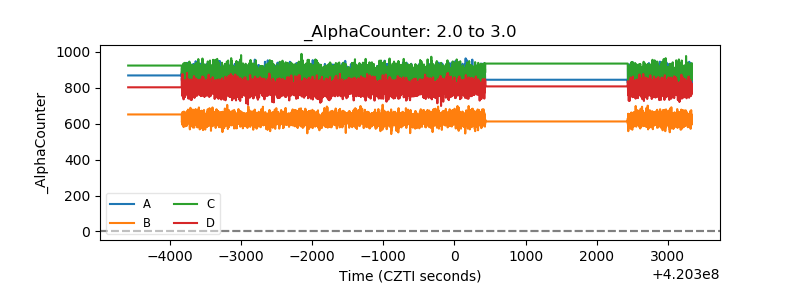 |
| _CPM_Rate |  |
| CZT Counter | 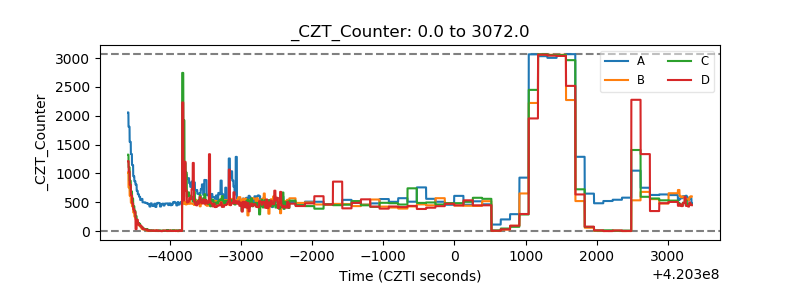 |
| +2.5 Volts monitor | 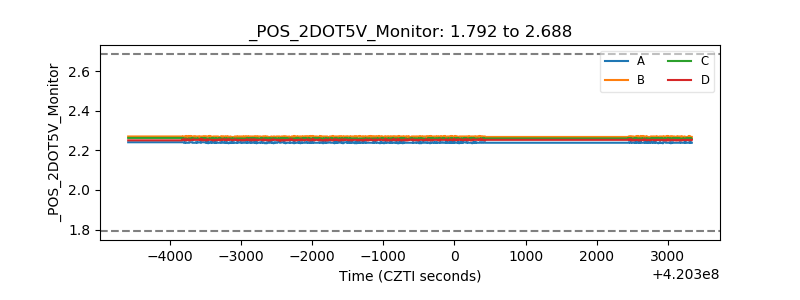 |
| +5 Volts monitor | 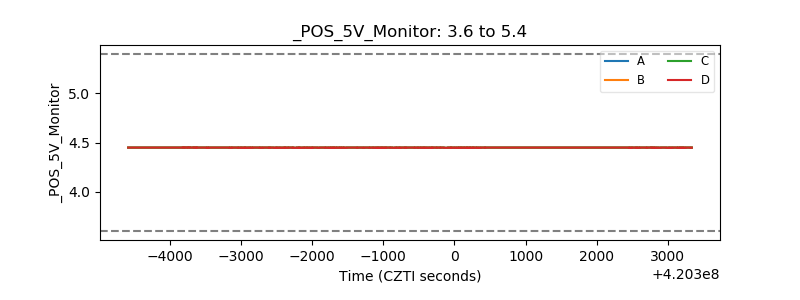 |
| _ROLL_ROT | 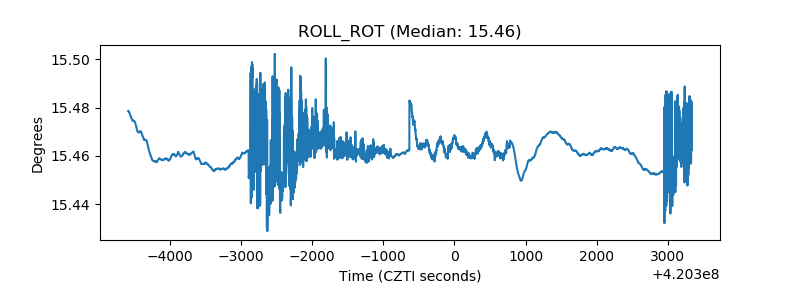 |
| _Roll_DEC | 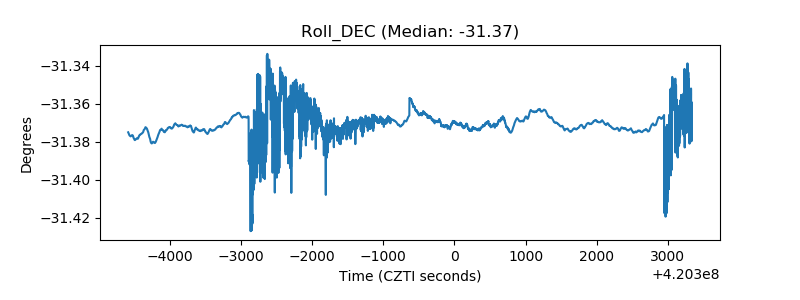 |
| _Roll_RA | 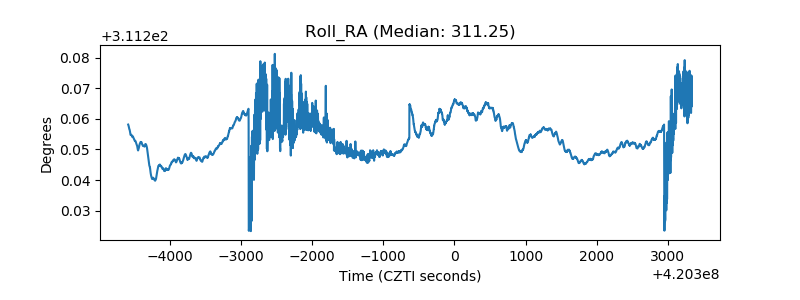 |
| Veto Counter | 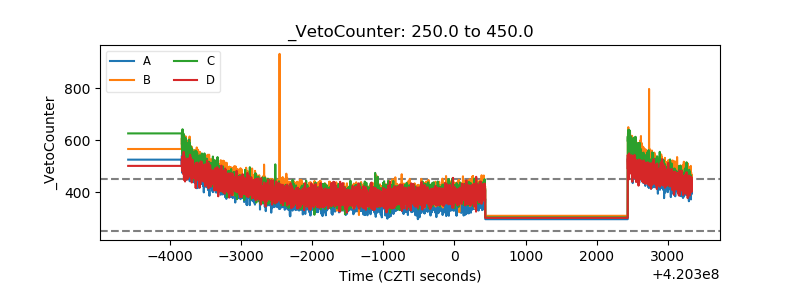 |