| Param | Original file | Final file |
|---|---|---|
| Filename | modeM0/AS1A12_066T01_9000005584_40982cztM0_level2.fits | modeM0/AS1A12_066T01_9000005584_40982cztM0_level2_quad_clean.evt |
| Size (bytes) | 327,683,520 | 90,872,640 |
| Size | 312.5 MB | 86.7 MB |
| Events in quadrant A | 2,910,174 | 637,419 |
| Events in quadrant B | 2,538,171 | 646,848 |
| Events in quadrant C | 2,764,820 | 593,058 |
| Events in quadrant D | 3,522,024 | 519,477 |
| Mode SS | |||
|---|---|---|---|
| Quadrant | BADHDUFLAG | Total packets | Discarded packets |
| A | 0 | 104 | 0 |
| B | 0 | 104 | 0 |
| C | 0 | 104 | 0 |
| D | 0 | 104 | 0 |
| Mode M0 | |||
|---|---|---|---|
| Quadrant | BADHDUFLAG | Total packets | Discarded packets |
| A | 0 | 11681 | 3 |
| B | 0 | 10748 | 2 |
| C | 0 | 11102 | 2 |
| D | 0 | 13821 | 2 |
| Mode M9 | |||
|---|---|---|---|
| Quadrant | BADHDUFLAG | Total packets | Discarded packets |
| A | 0 | 28 | 0 |
| B | 0 | 28 | 0 |
| C | 0 | 28 | 0 |
| D | 0 | 29 | 0 |
| Quadrant | Total seconds | Saturated seconds | Saturation percentage |
|---|---|---|---|
| A | 5062 | 16 | 0.316081% |
| B | 5062 | 20 | 0.395101% |
| C | 5062 | 94 | 1.856974% |
| D | 5062 | 440 | 8.692217% |
Noise dominated data is calculated using 1-second bins in cleaned event files. If a bin has >2000 counts, and if more than 50% of those come from <1% of pixels, then it is considered to be noise-dominated and hence unusable.
| Quadrant | # 1 sec bins | Bins with >0 counts | Bins with >2000 counts | High rate bins dominated by noise | Noise dominated (total time) | Noise dominated (detector-on time) | Marked lightcurve |
|---|---|---|---|---|---|---|---|
| A | 7155 | 5063 | 5 | 5 | 0.07% | 0.10% | 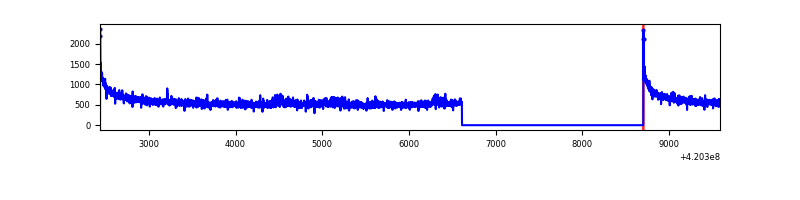 |
| B | 7155 | 5063 | 8 | 8 | 0.11% | 0.16% | 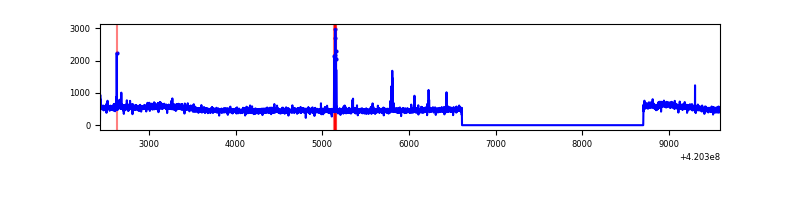 |
| C | 7155 | 5063 | 95 | 95 | 1.33% | 1.88% | 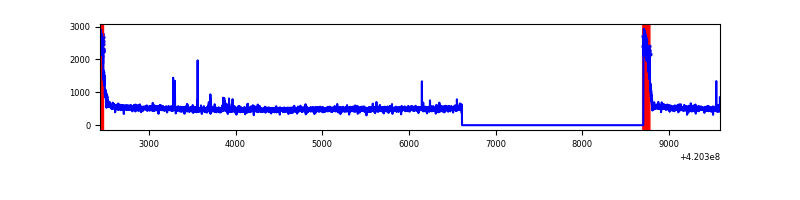 |
| D | 7155 | 5062 | 430 | 430 | 6.01% | 8.49% | 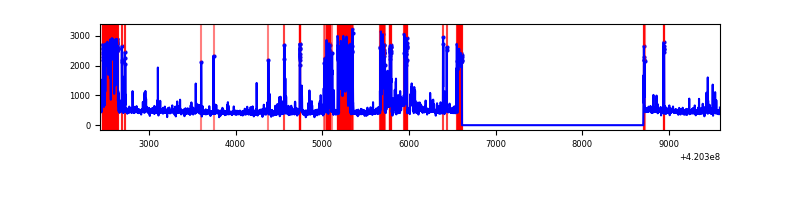 |
Top three noisy pixels from each quadrant. If the there are fewer than three noisy pixels in the level2.evt file, extra rows are filled as -1
| Pixel properties | Quadrant properties | ||||||
|---|---|---|---|---|---|---|---|
| Quadrant | DetID | PixID | Counts | Sigma | Mean | Median | Sigma |
| A | 10 | 83 | 497148 | 4032.25 | 606 | 594 | 123.1 |
| A | 12 | 189 | 53306 | 428.05 | 606 | 594 | 123.1 |
| A | 3 | 1 | 9649 | 73.53 | 606 | 594 | 123.1 |
| B | 0 | 229 | 125389 | 1075.35 | 602 | 585 | 116.1 |
| B | 5 | 255 | 52828 | 450.14 | 602 | 585 | 116.1 |
| B | 12 | 111 | 14163 | 116.99 | 602 | 585 | 116.1 |
| C | 0 | 10 | 271838 | 2019.13 | 578 | 580 | 134.3 |
| C | 15 | 214 | 215737 | 1601.54 | 578 | 580 | 134.3 |
| C | 12 | 249 | 18284 | 131.78 | 578 | 580 | 134.3 |
| D | 13 | 249 | 580171 | 4232.11 | 558 | 541 | 137.0 |
| D | 2 | 249 | 507378 | 3700.62 | 558 | 541 | 137.0 |
| D | 12 | 233 | 168061 | 1223.13 | 558 | 541 | 137.0 |
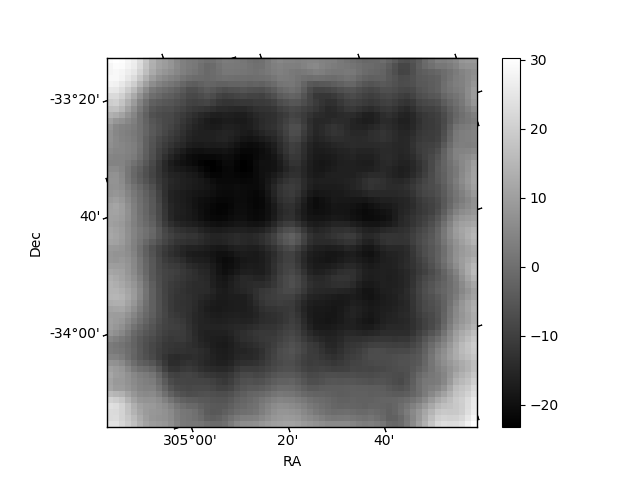
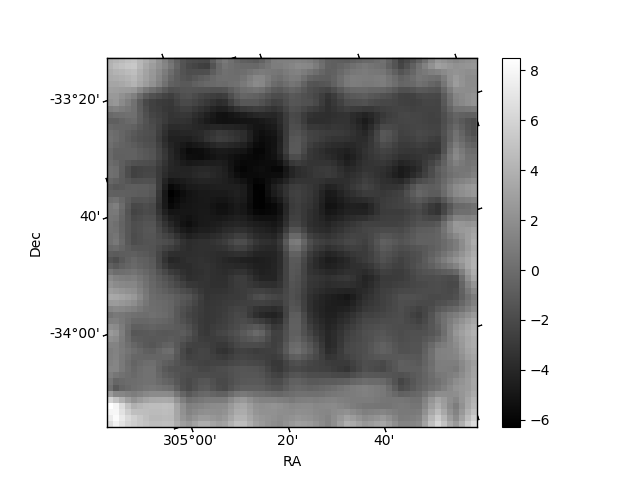
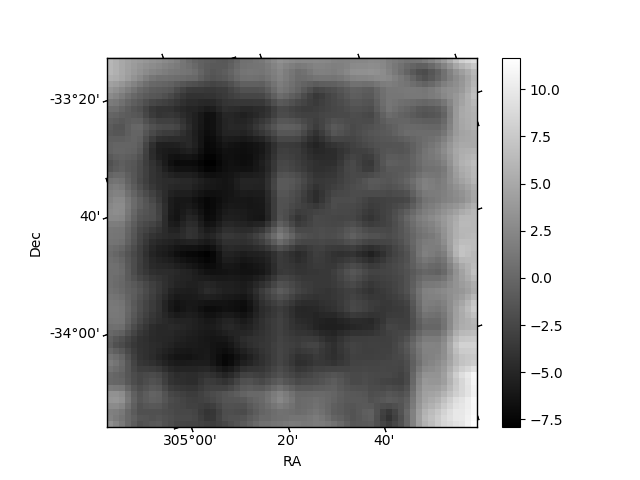
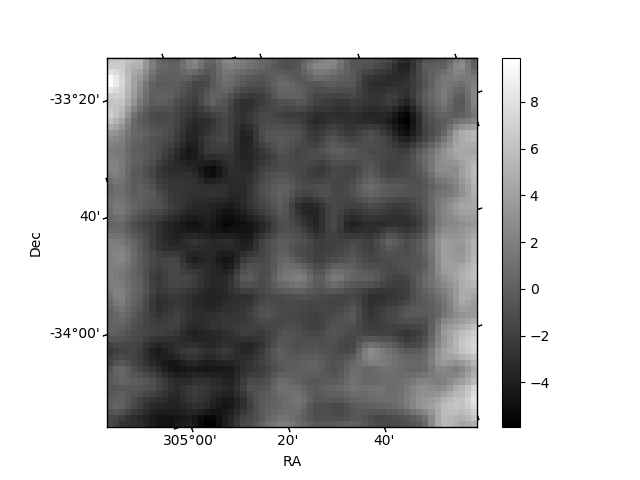
Histogram calculated using DETX and DETY for each event in the final _common_clean file
| Quadrant A | 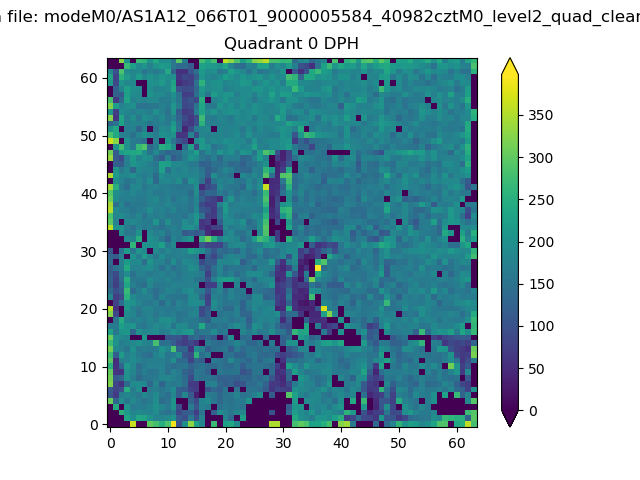 |
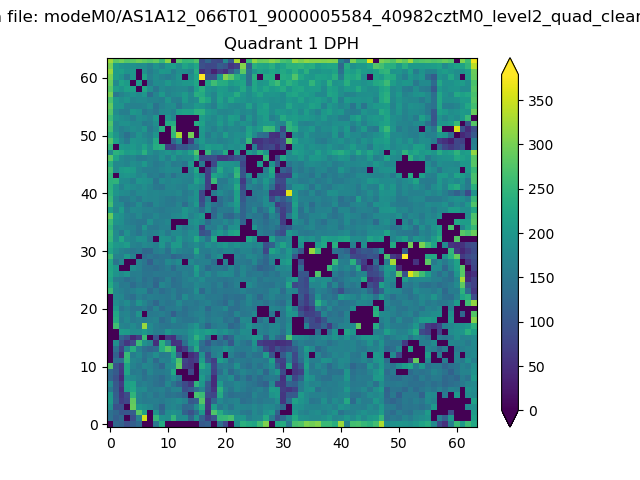 |
Quadrant B |
|---|---|---|---|
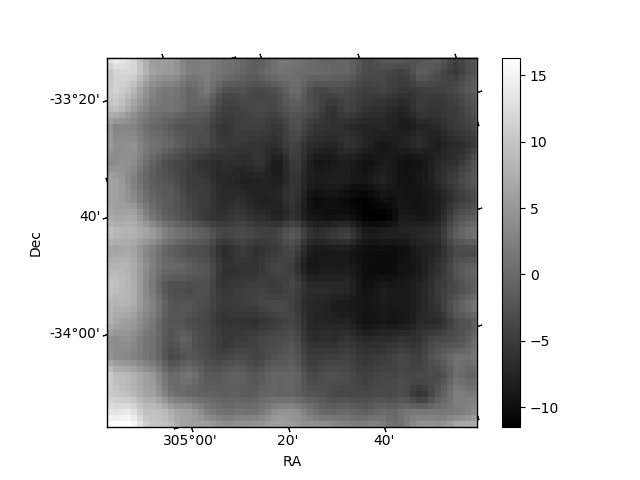
| Quadrant D | 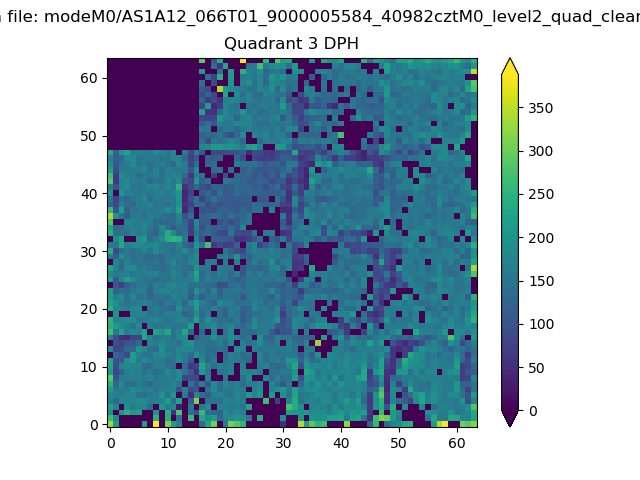 |
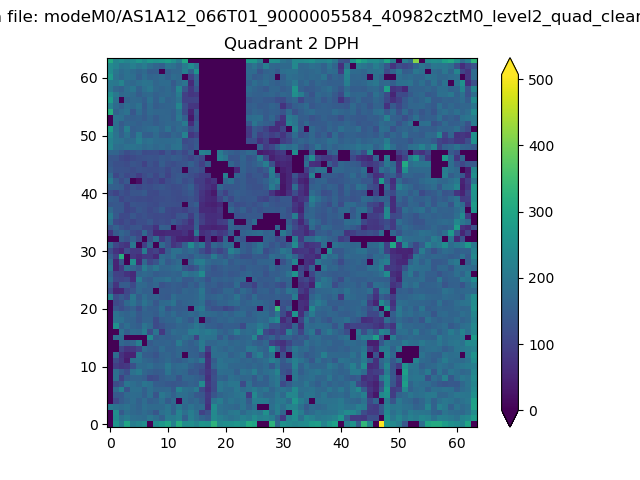 |
Quadrant C |
| Plot type | Count rate plots | Images |
|---|---|---|
| Comparison with Poisson distribution Blue bars denote a histogram of data divided into 1 sec bins. Red curve is a Poisson curve with rate = median count rate of data. |
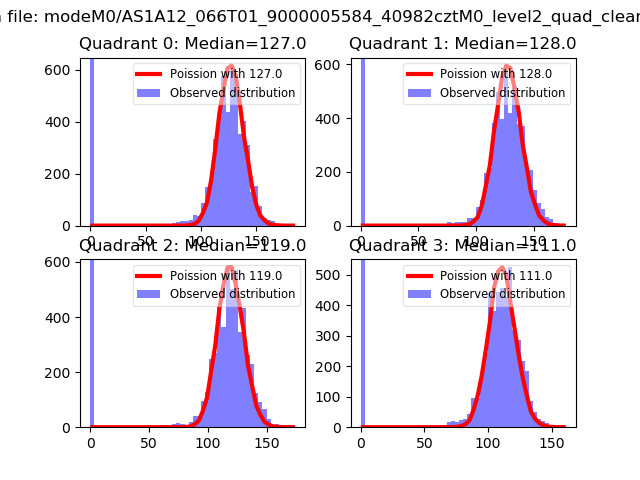 |
 |
| Quadrant-wise count rates Data is divided into 100 sec bins |
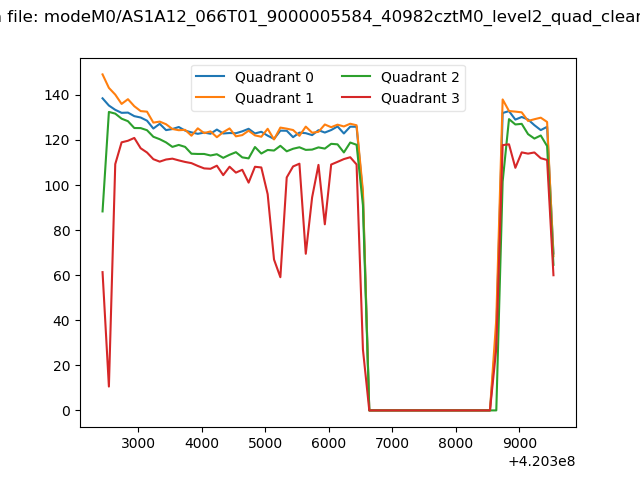 |
|
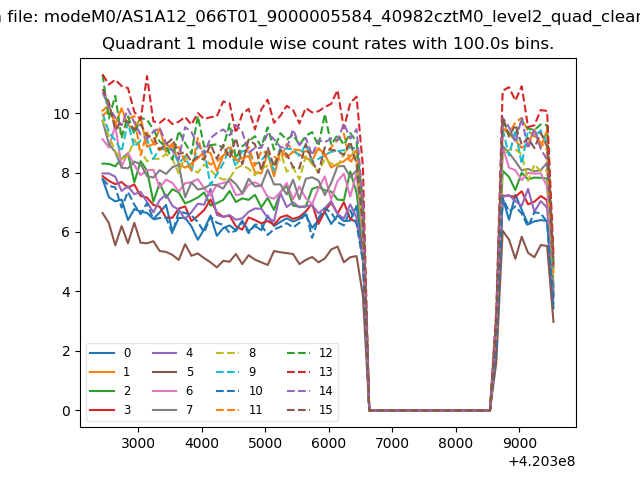
| Module-wise count rates for Quadrant A Data is divided into 100 sec bins |
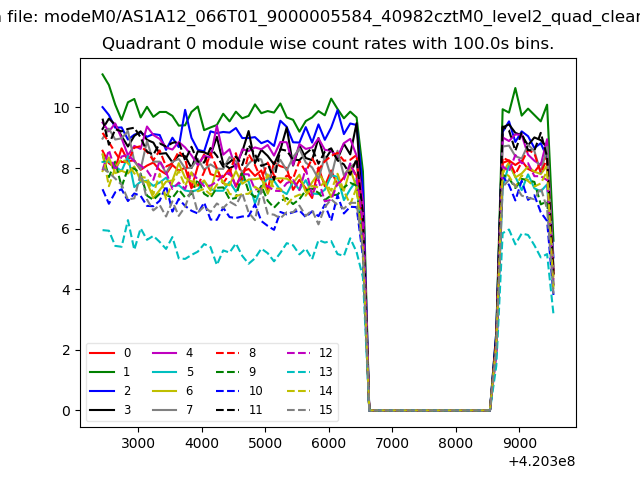 |
 |
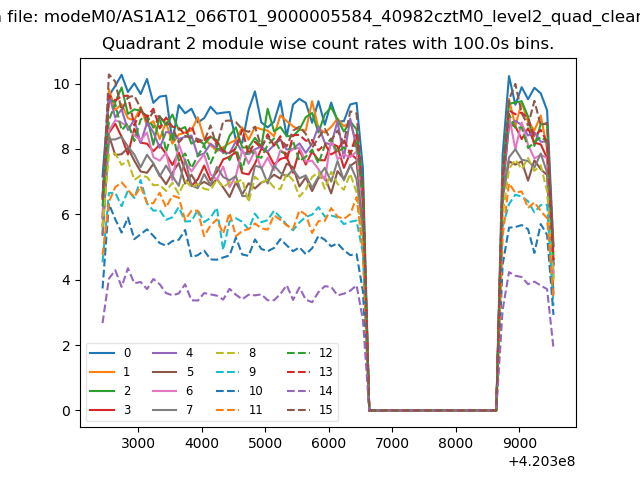
| Module-wise count rates for Quadrant B Data is divided into 100 sec bins |
 |
 |
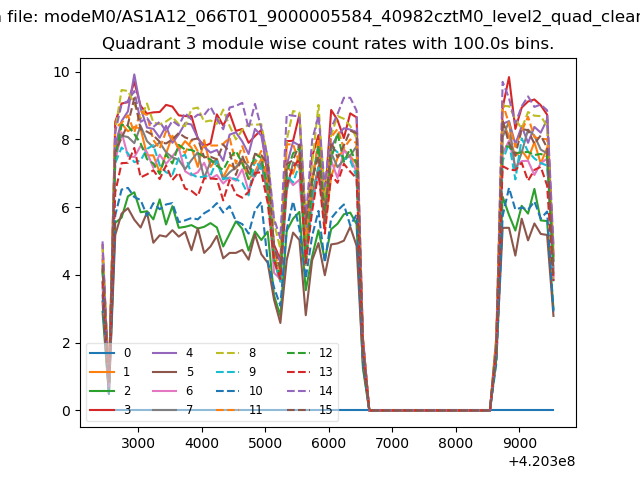
| Module-wise count rates for Quadrant C Data is divided into 100 sec bins |
 |
 |
| Module-wise count rates for Quadrant D Data is divided into 100 sec bins |
 |
 |
| Parameter | Plot |
|---|---|
| CZT HV Monitor | 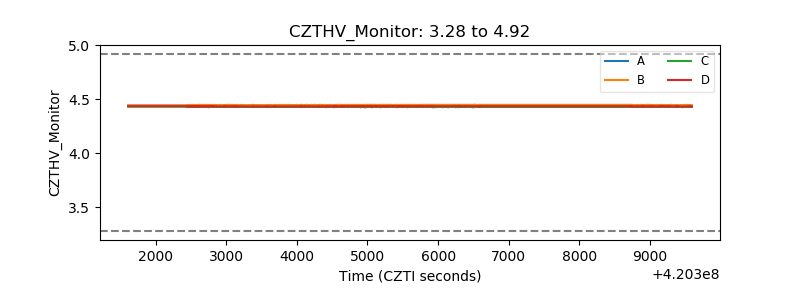 |
| D_VDD | 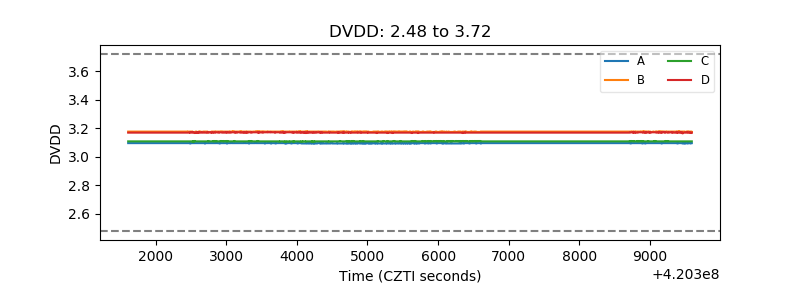 |
| Temperature 1 | 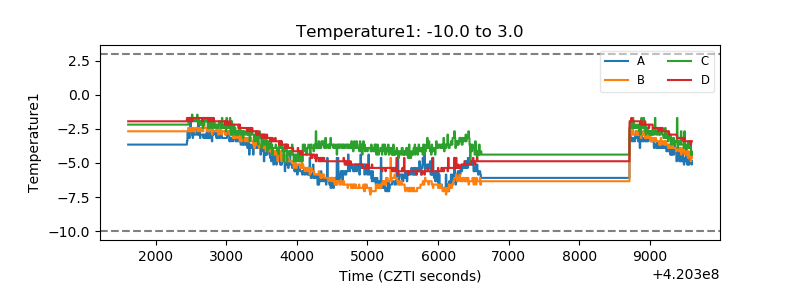 |
| Veto HV Monitor | 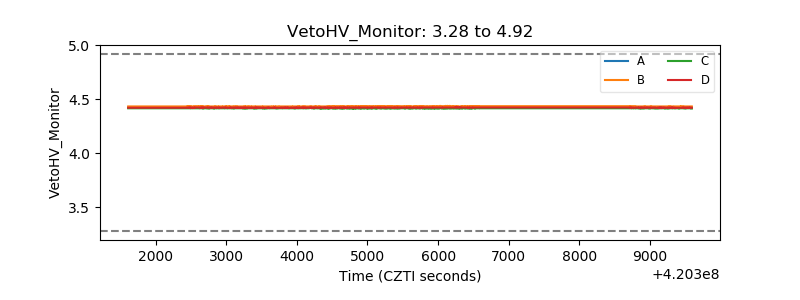 |
| Veto LLD | 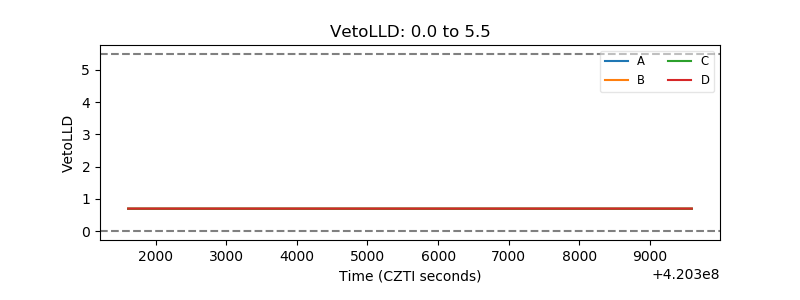 |
| Alpha Counter | 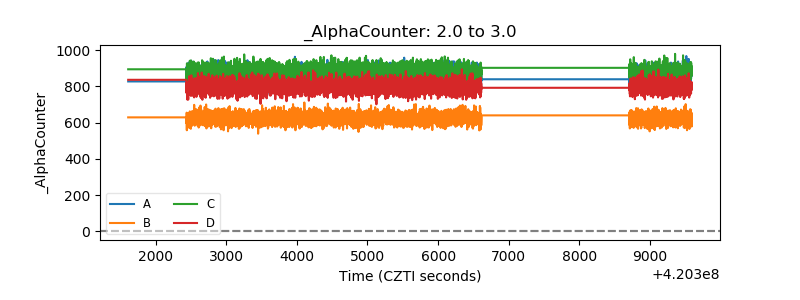 |
| _CPM_Rate | 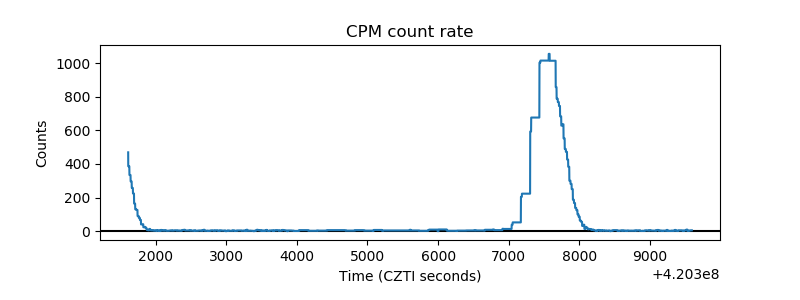 |
| CZT Counter |  |
| +2.5 Volts monitor | 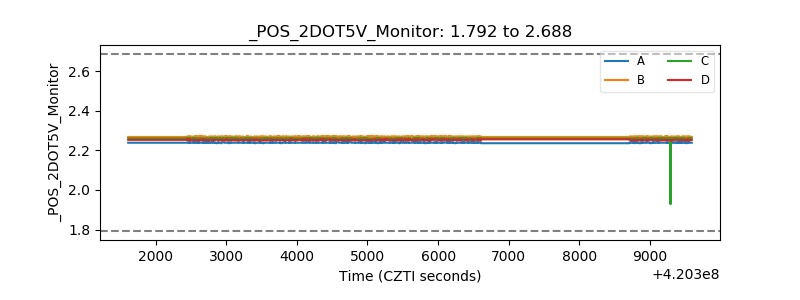 |
| +5 Volts monitor | 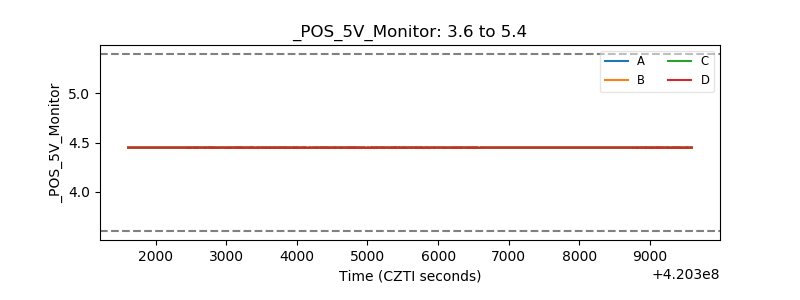 |
| _ROLL_ROT | 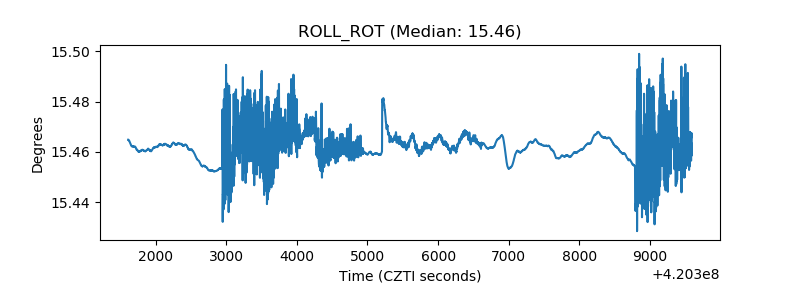 |
| _Roll_DEC | 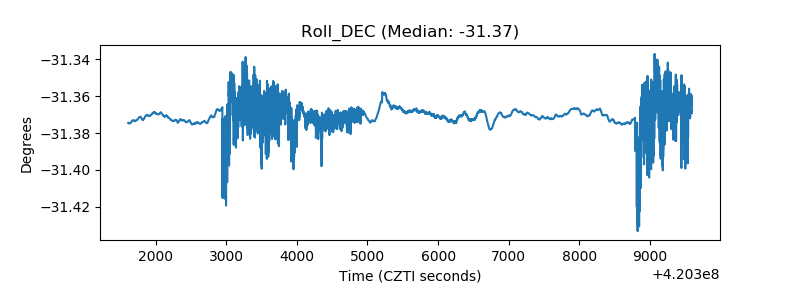 |
| _Roll_RA | 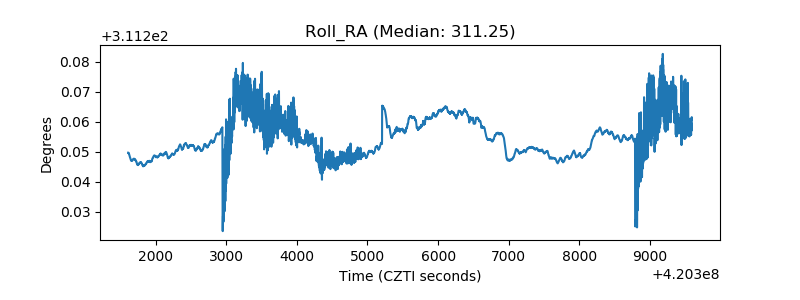 |
| Veto Counter | 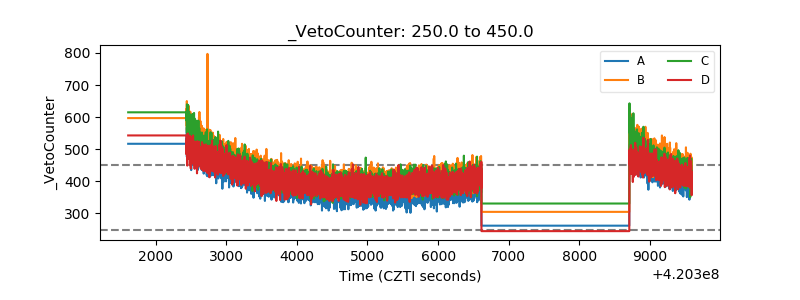 |