| Param | Original file | Final file |
|---|---|---|
| Filename | modeM0/AS1A12_066T01_9000005584_40983cztM0_level2.fits | modeM0/AS1A12_066T01_9000005584_40983cztM0_level2_quad_clean.evt |
| Size (bytes) | 312,851,520 | 85,348,800 |
| Size | 298.4 MB | 81.4 MB |
| Events in quadrant A | 2,708,623 | 596,391 |
| Events in quadrant B | 2,519,976 | 598,755 |
| Events in quadrant C | 2,621,595 | 554,004 |
| Events in quadrant D | 3,352,780 | 495,384 |
| Mode SS | |||
|---|---|---|---|
| Quadrant | BADHDUFLAG | Total packets | Discarded packets |
| A | 0 | 100 | 0 |
| B | 0 | 100 | 0 |
| C | 0 | 100 | 0 |
| D | 0 | 100 | 0 |
| Mode M0 | |||
|---|---|---|---|
| Quadrant | BADHDUFLAG | Total packets | Discarded packets |
| A | 0 | 10993 | 3 |
| B | 0 | 10704 | 2 |
| C | 0 | 10626 | 2 |
| D | 0 | 13235 | 2 |
| Mode M9 | |||
|---|---|---|---|
| Quadrant | BADHDUFLAG | Total packets | Discarded packets |
| A | 0 | 30 | 0 |
| B | 0 | 30 | 0 |
| C | 0 | 30 | 0 |
| D | 0 | 31 | 0 |
| Quadrant | Total seconds | Saturated seconds | Saturation percentage |
|---|---|---|---|
| A | 4844 | 10 | 0.206441% |
| B | 4844 | 48 | 0.990917% |
| C | 4844 | 96 | 1.981833% |
| D | 4844 | 370 | 7.638315% |
Noise dominated data is calculated using 1-second bins in cleaned event files. If a bin has >2000 counts, and if more than 50% of those come from <1% of pixels, then it is considered to be noise-dominated and hence unusable.
| Quadrant | # 1 sec bins | Bins with >0 counts | Bins with >2000 counts | High rate bins dominated by noise | Noise dominated (total time) | Noise dominated (detector-on time) | Marked lightcurve |
|---|---|---|---|---|---|---|---|
| A | 6967 | 4845 | 6 | 6 | 0.09% | 0.12% | 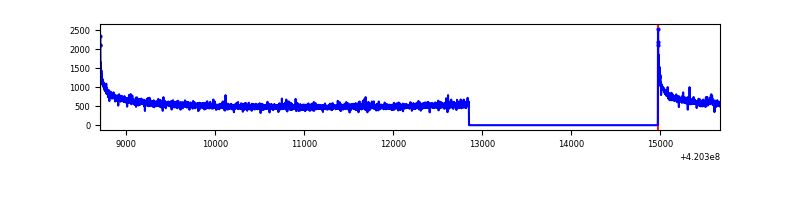 |
| B | 6967 | 4845 | 29 | 29 | 0.42% | 0.60% | 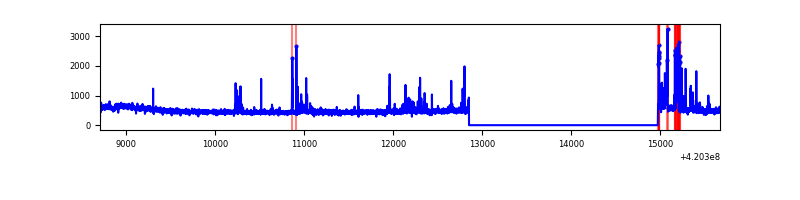 |
| C | 6967 | 4845 | 98 | 98 | 1.41% | 2.02% | 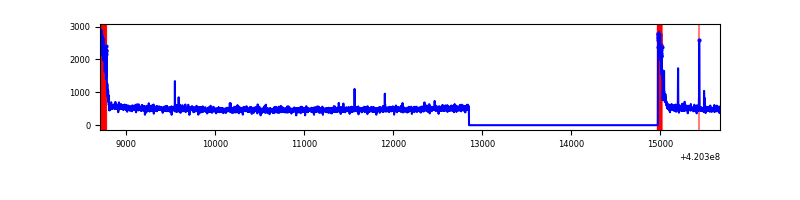 |
| D | 6967 | 4844 | 374 | 374 | 5.37% | 7.72% | 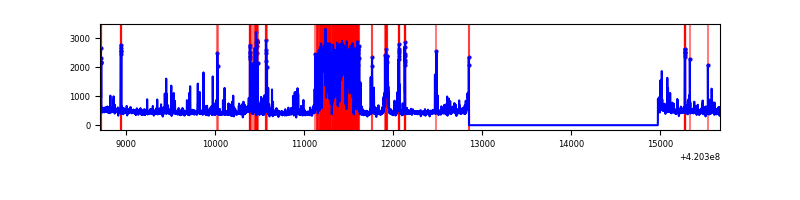 |
Top three noisy pixels from each quadrant. If the there are fewer than three noisy pixels in the level2.evt file, extra rows are filled as -1
| Pixel properties | Quadrant properties | ||||||
|---|---|---|---|---|---|---|---|
| Quadrant | DetID | PixID | Counts | Sigma | Mean | Median | Sigma |
| A | 10 | 83 | 475057 | 4101.23 | 567 | 557 | 115.7 |
| A | 12 | 189 | 33184 | 282.0 | 567 | 557 | 115.7 |
| A | 13 | 254 | 7527 | 60.24 | 567 | 557 | 115.7 |
| B | 5 | 255 | 225925 | 2067.05 | 562 | 546 | 109.0 |
| B | 0 | 229 | 79876 | 727.57 | 562 | 546 | 109.0 |
| B | 12 | 111 | 13408 | 117.96 | 562 | 546 | 109.0 |
| C | 0 | 10 | 280252 | 2220.22 | 542 | 545 | 126.0 |
| C | 15 | 214 | 208159 | 1647.97 | 542 | 545 | 126.0 |
| C | 12 | 249 | 13619 | 103.78 | 542 | 545 | 126.0 |
| D | 2 | 249 | 855020 | 6545.3 | 533 | 519 | 130.6 |
| D | 13 | 249 | 167871 | 1281.88 | 533 | 519 | 130.6 |
| D | 5 | 32 | 130558 | 996.07 | 533 | 519 | 130.6 |
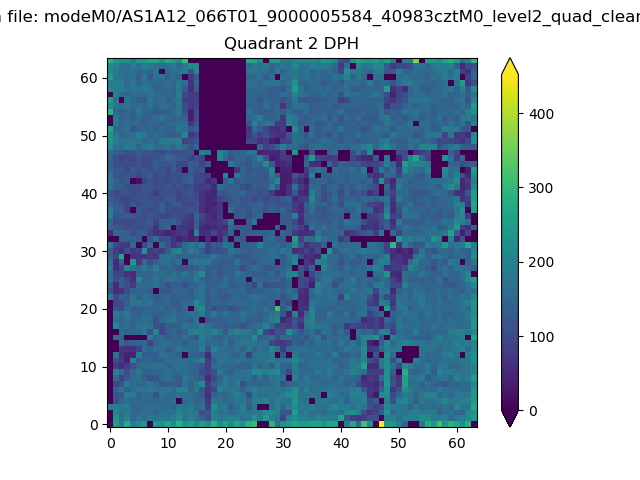
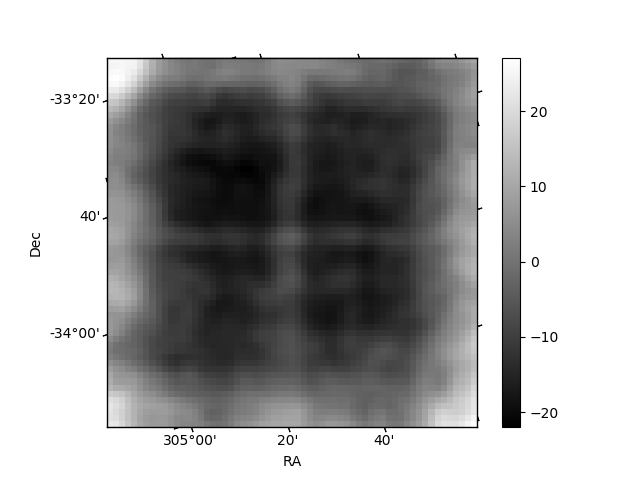
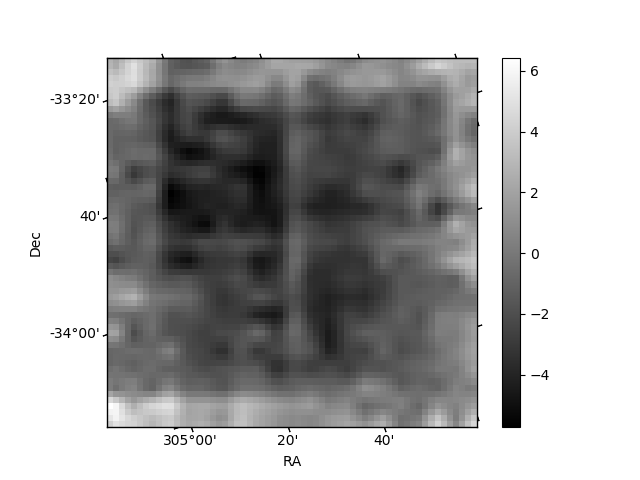
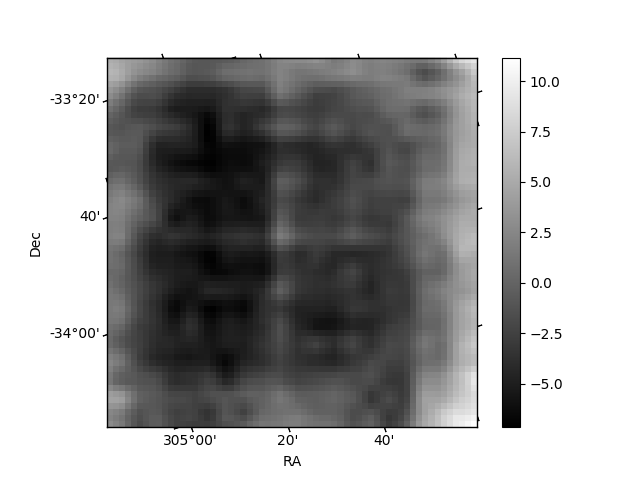
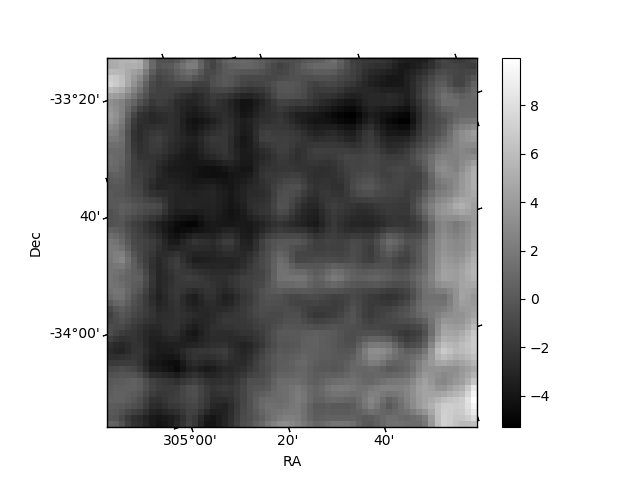
Histogram calculated using DETX and DETY for each event in the final _common_clean file
| Quadrant A | 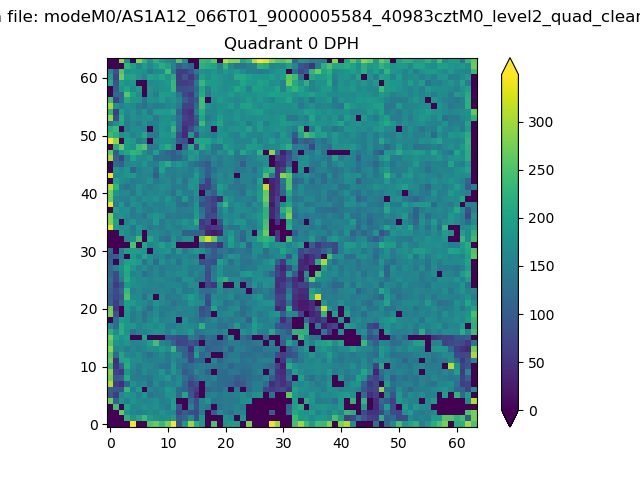 |
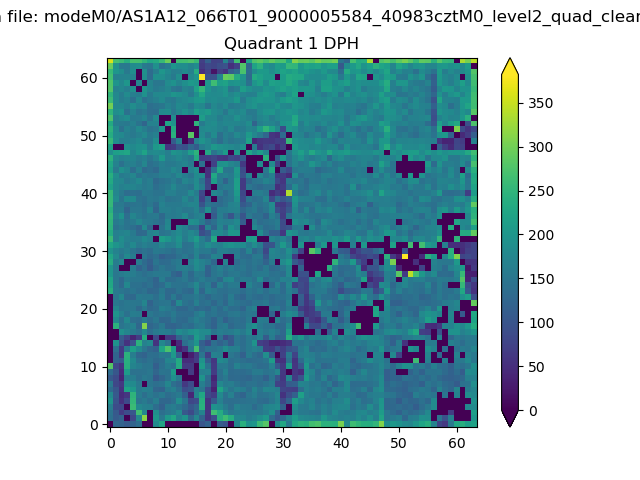 |
Quadrant B |
|---|---|---|---|
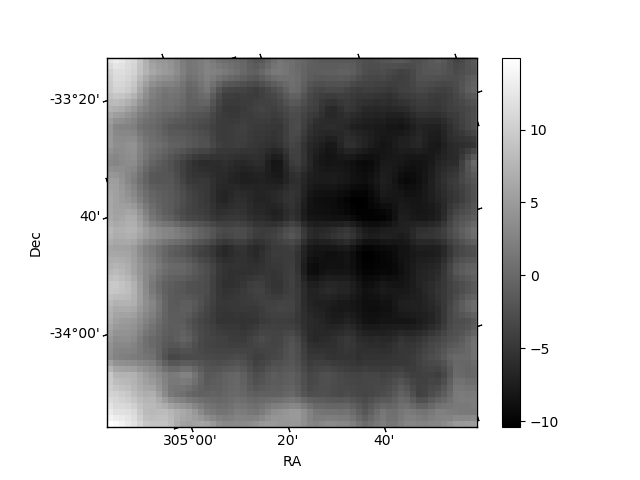
| Quadrant D | 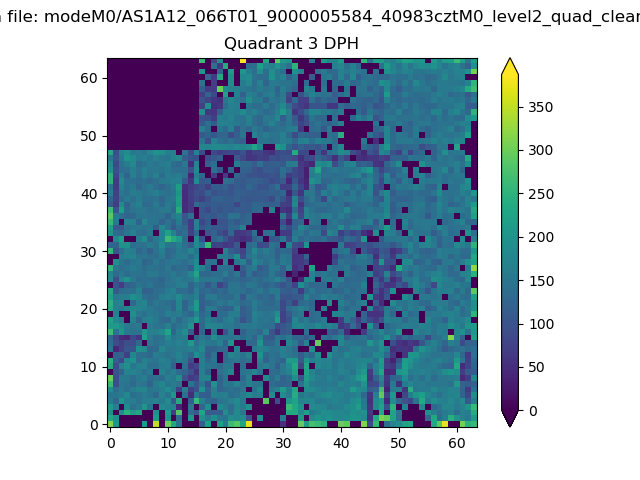 |
 |
Quadrant C |
| Plot type | Count rate plots | Images |
|---|---|---|
| Comparison with Poisson distribution Blue bars denote a histogram of data divided into 1 sec bins. Red curve is a Poisson curve with rate = median count rate of data. |
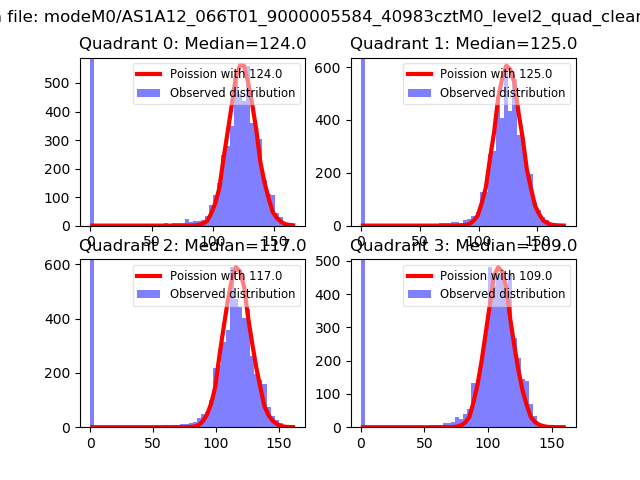 |
 |
| Quadrant-wise count rates Data is divided into 100 sec bins |
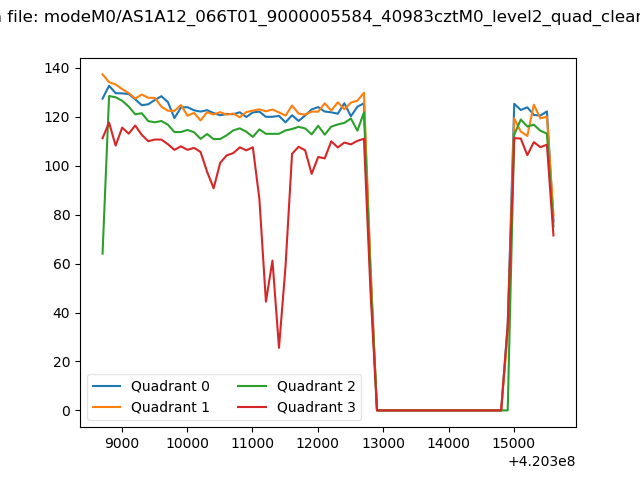 |
|
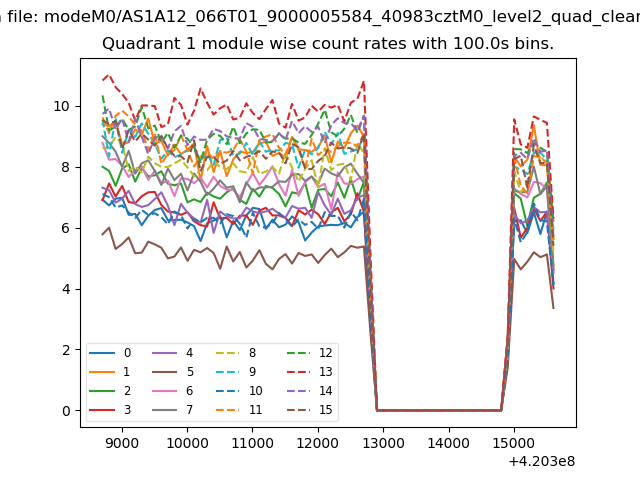
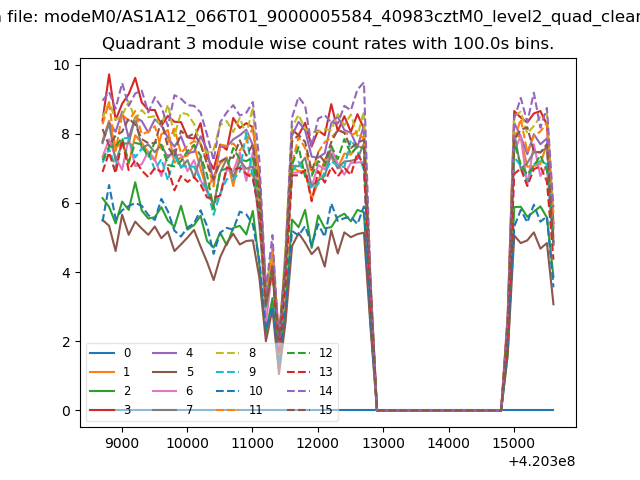
| Module-wise count rates for Quadrant A Data is divided into 100 sec bins |
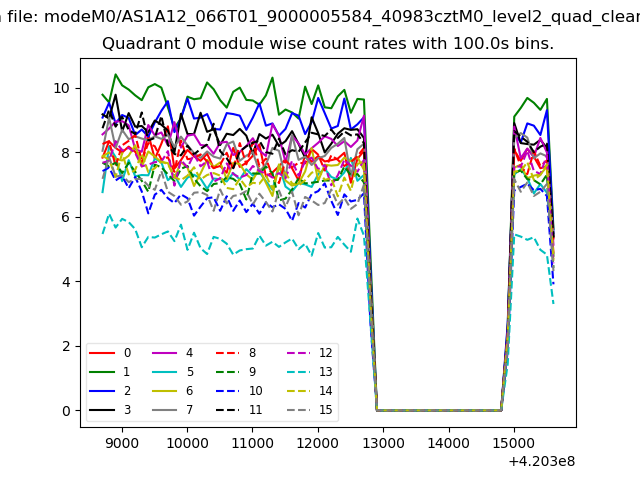 |
 |
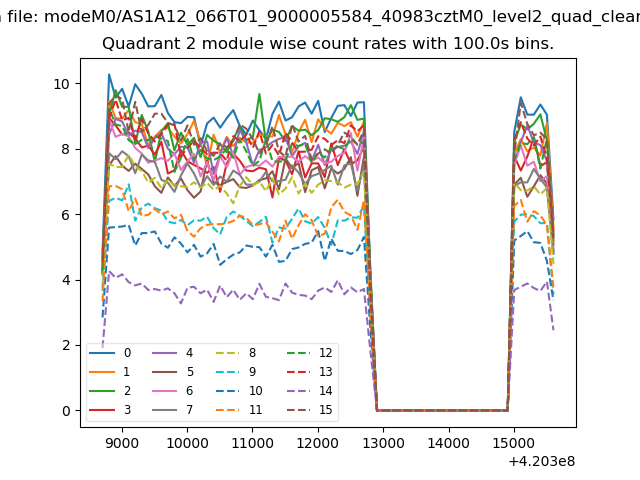
| Module-wise count rates for Quadrant B Data is divided into 100 sec bins |
 |
 |
| Module-wise count rates for Quadrant C Data is divided into 100 sec bins |
 |
 |
| Module-wise count rates for Quadrant D Data is divided into 100 sec bins |
 |
 |
| Parameter | Plot |
|---|---|
| CZT HV Monitor | 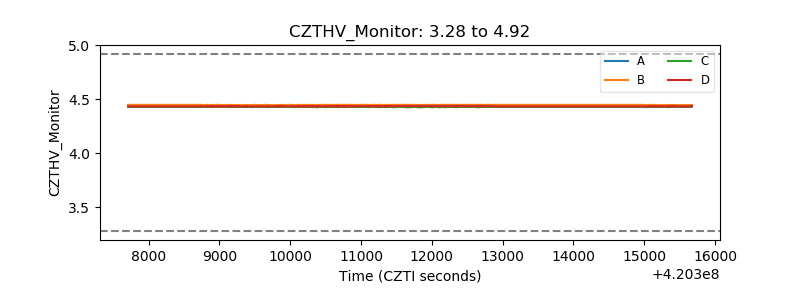 |
| D_VDD | 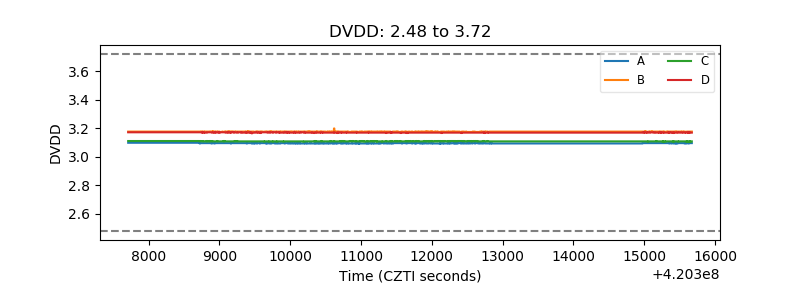 |
| Temperature 1 | 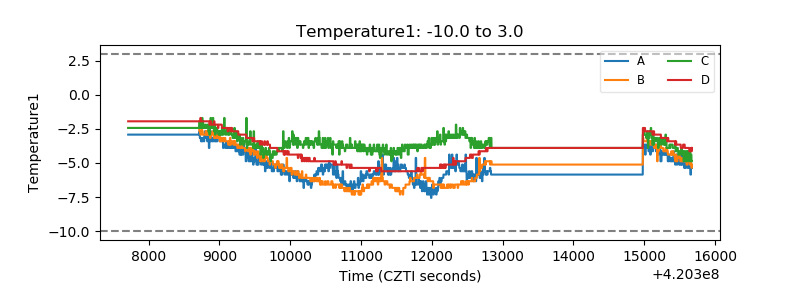 |
| Veto HV Monitor | 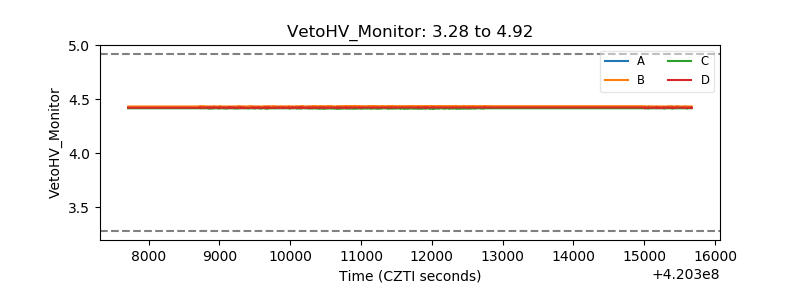 |
| Veto LLD | 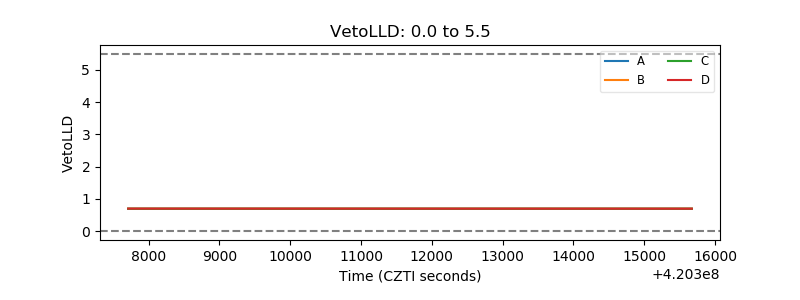 |
| Alpha Counter | 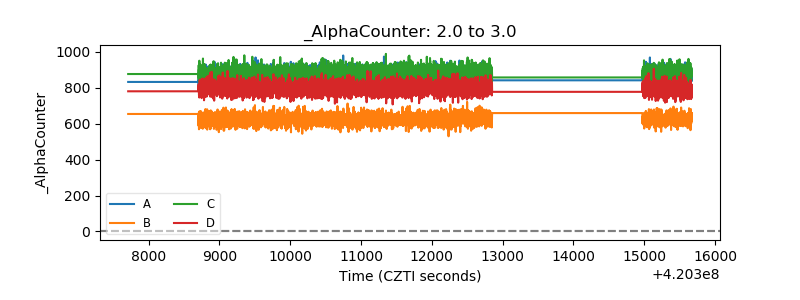 |
| _CPM_Rate | 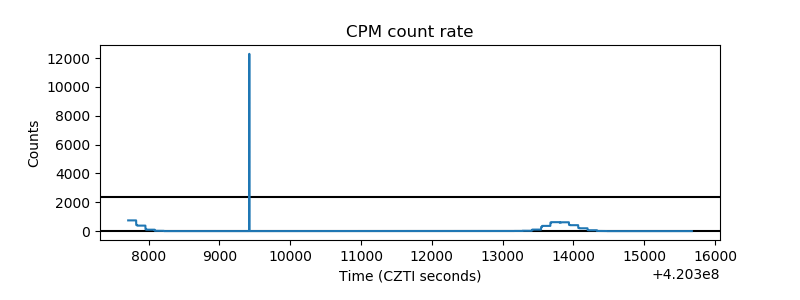 |
| CZT Counter | 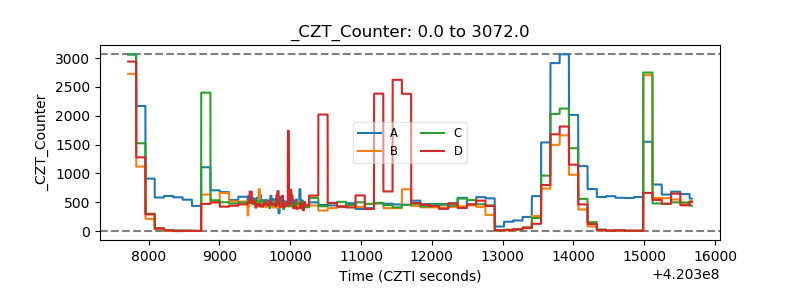 |
| +2.5 Volts monitor | 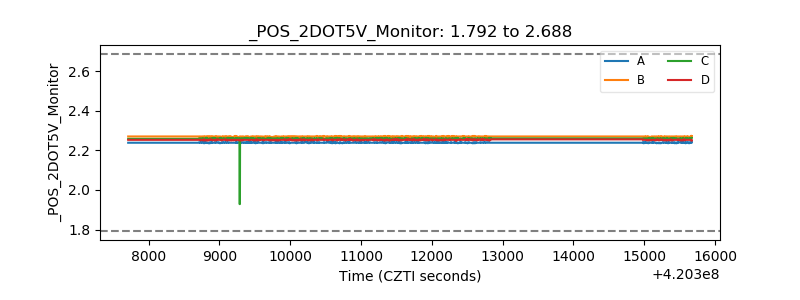 |
| +5 Volts monitor | 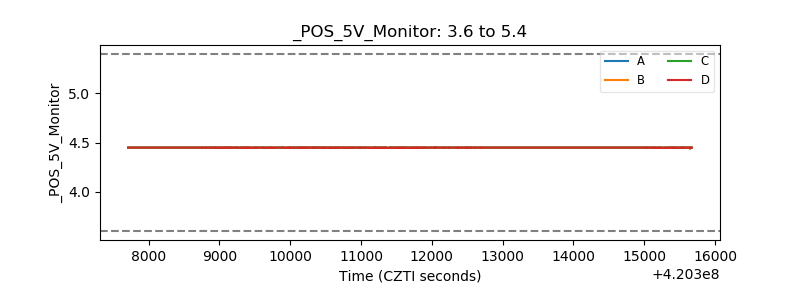 |
| _ROLL_ROT | 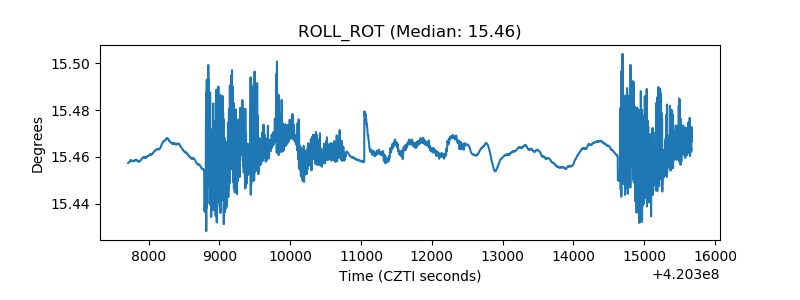 |
| _Roll_DEC | 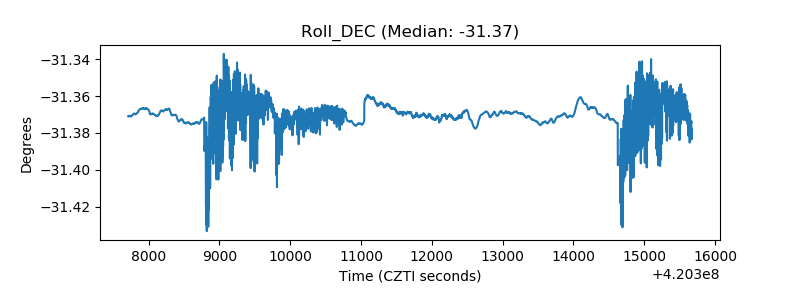 |
| _Roll_RA | 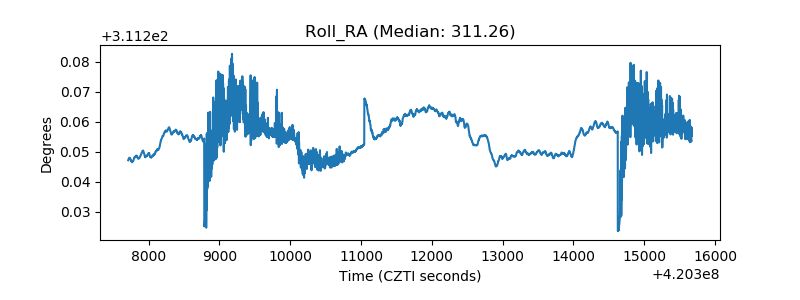 |
| Veto Counter | 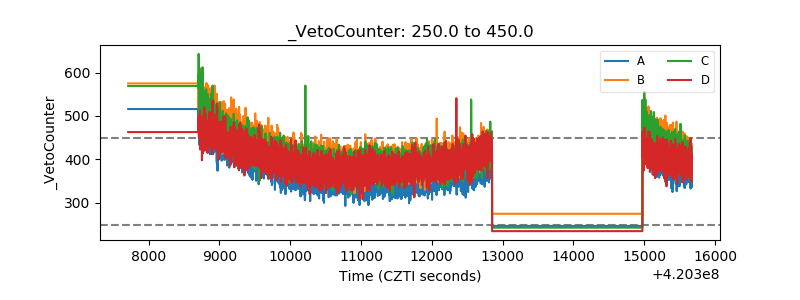 |