| Param | Original file | Final file |
|---|---|---|
| Filename | modeM0/AS1A12_066T01_9000005584_40984cztM0_level2.fits | modeM0/AS1A12_066T01_9000005584_40984cztM0_level2_quad_clean.evt |
| Size (bytes) | 291,919,680 | 84,274,560 |
| Size | 278.4 MB | 80.4 MB |
| Events in quadrant A | 2,685,656 | 578,022 |
| Events in quadrant B | 2,370,961 | 581,517 |
| Events in quadrant C | 2,563,969 | 540,607 |
| Events in quadrant D | 2,802,280 | 507,357 |
| Mode SS | |||
|---|---|---|---|
| Quadrant | BADHDUFLAG | Total packets | Discarded packets |
| A | 0 | 100 | 0 |
| B | 0 | 100 | 0 |
| C | 0 | 100 | 0 |
| D | 0 | 100 | 0 |
| Mode M0 | |||
|---|---|---|---|
| Quadrant | BADHDUFLAG | Total packets | Discarded packets |
| A | 0 | 10955 | 3 |
| B | 0 | 10426 | 2 |
| C | 0 | 10635 | 2 |
| D | 0 | 11716 | 2 |
| Mode M9 | |||
|---|---|---|---|
| Quadrant | BADHDUFLAG | Total packets | Discarded packets |
| A | 0 | 32 | 0 |
| B | 0 | 32 | 0 |
| C | 0 | 32 | 0 |
| D | 0 | 33 | 0 |
| Quadrant | Total seconds | Saturated seconds | Saturation percentage |
|---|---|---|---|
| A | 4910 | 10 | 0.203666% |
| B | 4910 | 44 | 0.896130% |
| C | 4910 | 85 | 1.731161% |
| D | 4910 | 106 | 2.158859% |
Noise dominated data is calculated using 1-second bins in cleaned event files. If a bin has >2000 counts, and if more than 50% of those come from <1% of pixels, then it is considered to be noise-dominated and hence unusable.
| Quadrant | # 1 sec bins | Bins with >0 counts | Bins with >2000 counts | High rate bins dominated by noise | Noise dominated (total time) | Noise dominated (detector-on time) | Marked lightcurve |
|---|---|---|---|---|---|---|---|
| A | 7003 | 4911 | 6 | 6 | 0.09% | 0.12% | 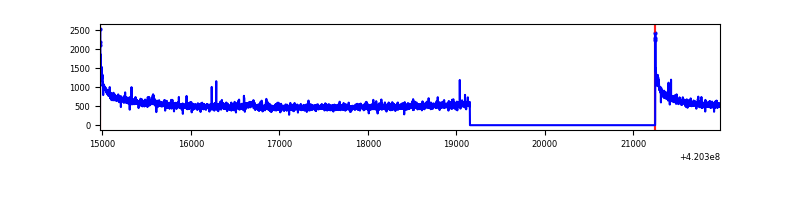 |
| B | 7003 | 4911 | 29 | 29 | 0.41% | 0.59% | 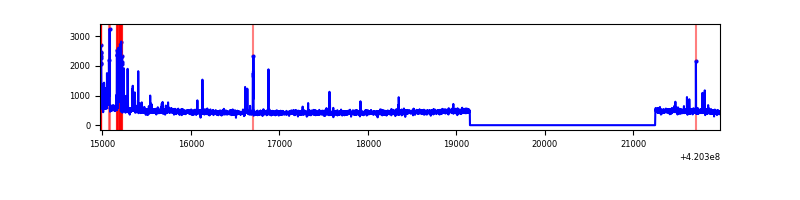 |
| C | 7003 | 4911 | 81 | 81 | 1.16% | 1.65% | 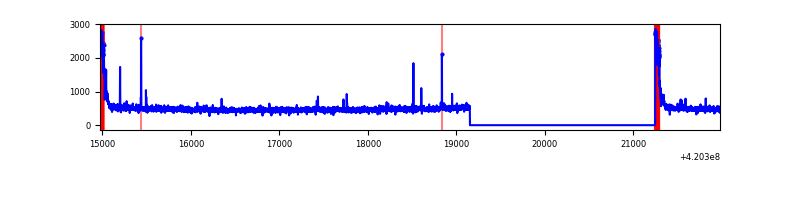 |
| D | 7003 | 4911 | 116 | 116 | 1.66% | 2.36% | 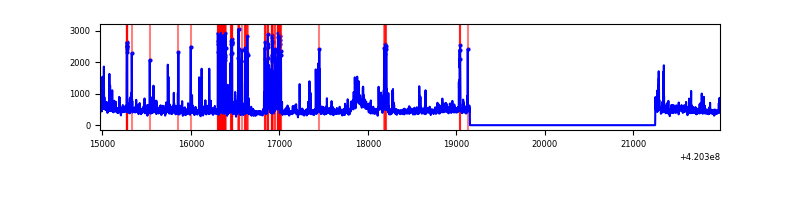 |
Top three noisy pixels from each quadrant. If the there are fewer than three noisy pixels in the level2.evt file, extra rows are filled as -1
| Pixel properties | Quadrant properties | ||||||
|---|---|---|---|---|---|---|---|
| Quadrant | DetID | PixID | Counts | Sigma | Mean | Median | Sigma |
| A | 10 | 83 | 472644 | 4121.4 | 555 | 544 | 114.5 |
| A | 12 | 189 | 56807 | 491.17 | 555 | 544 | 114.5 |
| A | 13 | 254 | 7651 | 62.04 | 555 | 544 | 114.5 |
| B | 5 | 255 | 180545 | 1675.59 | 550 | 536 | 107.4 |
| B | 0 | 229 | 25195 | 229.53 | 550 | 536 | 107.4 |
| B | 12 | 111 | 13491 | 120.59 | 550 | 536 | 107.4 |
| C | 0 | 10 | 236239 | 1886.85 | 536 | 541 | 124.9 |
| C | 15 | 214 | 210230 | 1678.63 | 536 | 541 | 124.9 |
| C | 12 | 249 | 16506 | 127.8 | 536 | 541 | 124.9 |
| D | 13 | 249 | 437804 | 3349.33 | 538 | 524 | 130.6 |
| D | 1 | 47 | 106726 | 813.45 | 538 | 524 | 130.6 |
| D | 2 | 249 | 61242 | 465.07 | 538 | 524 | 130.6 |
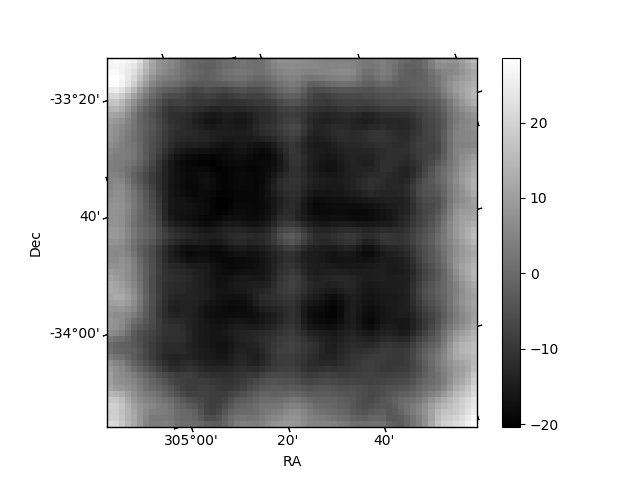
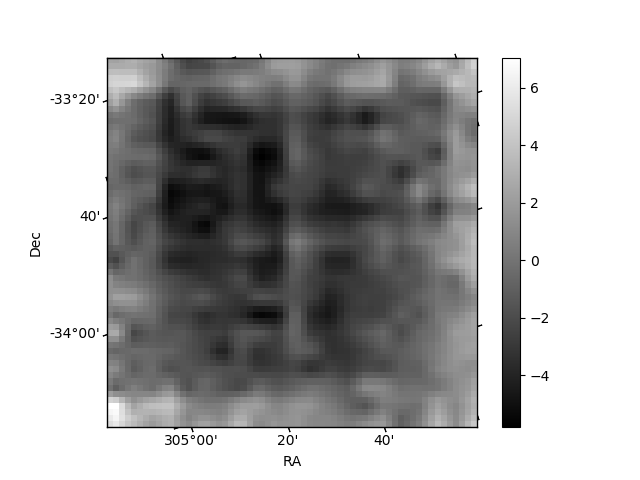
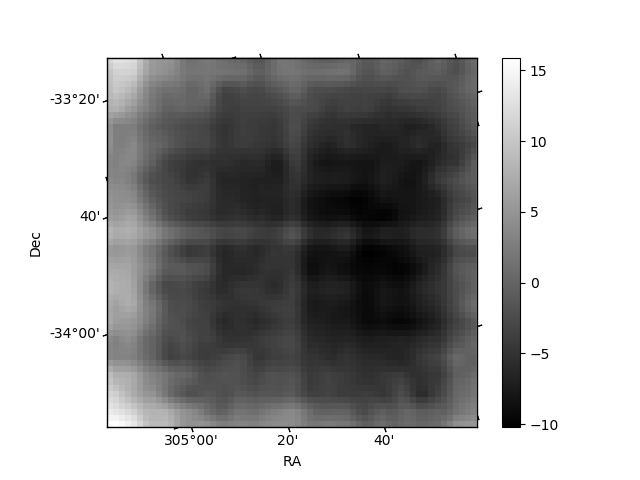
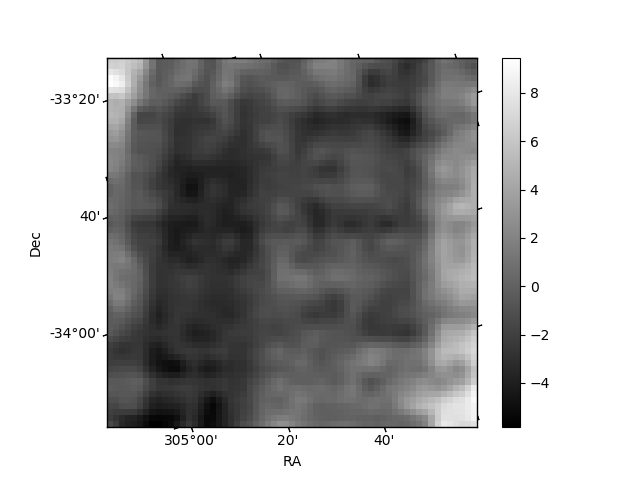
Histogram calculated using DETX and DETY for each event in the final _common_clean file
| Quadrant A | 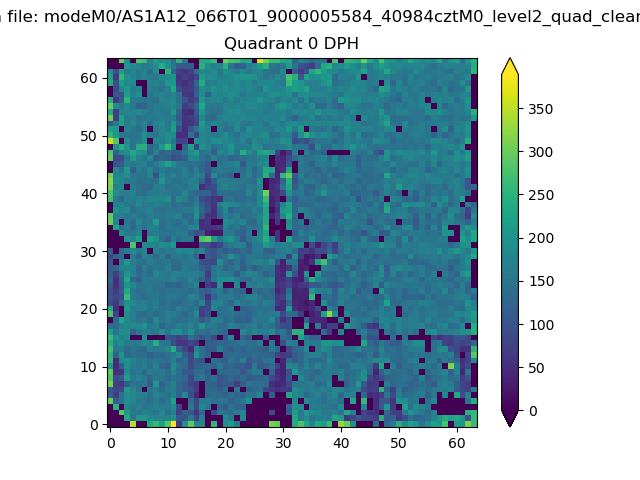 |
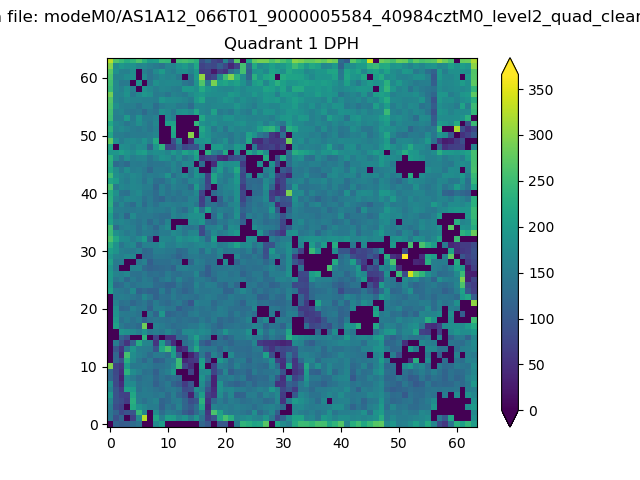 |
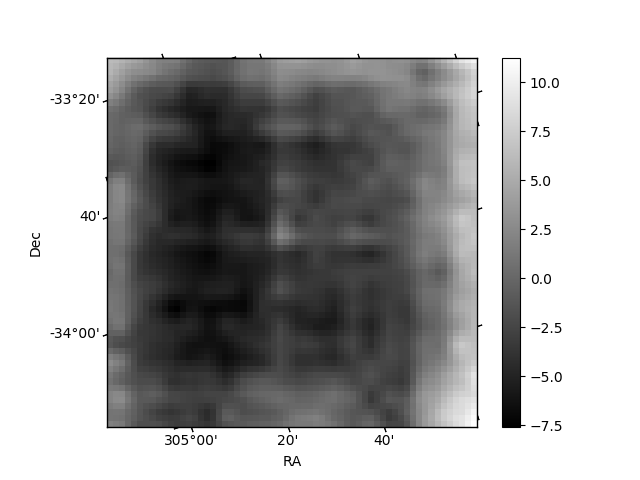
Quadrant B |
|---|---|---|---|
| Quadrant D | 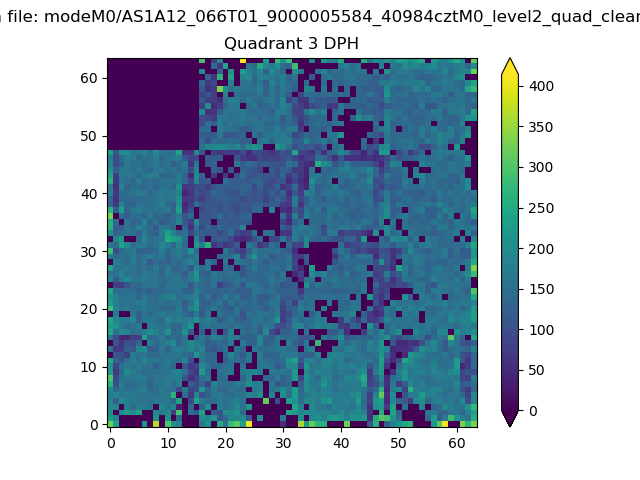 |
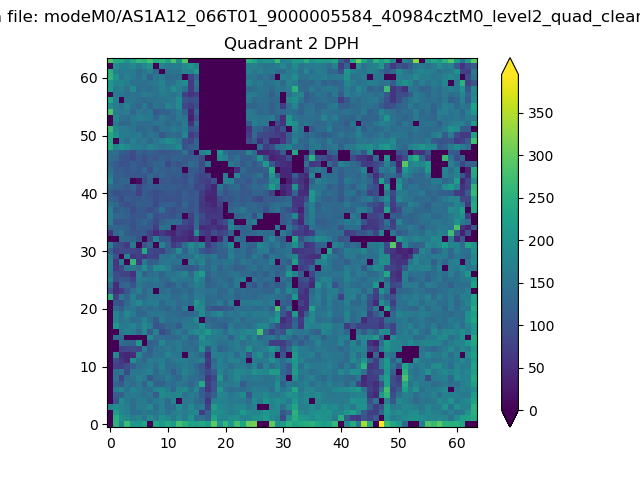 |
Quadrant C |
| Plot type | Count rate plots | Images |
|---|---|---|
| Comparison with Poisson distribution Blue bars denote a histogram of data divided into 1 sec bins. Red curve is a Poisson curve with rate = median count rate of data. |
 |
 |
| Quadrant-wise count rates Data is divided into 100 sec bins |
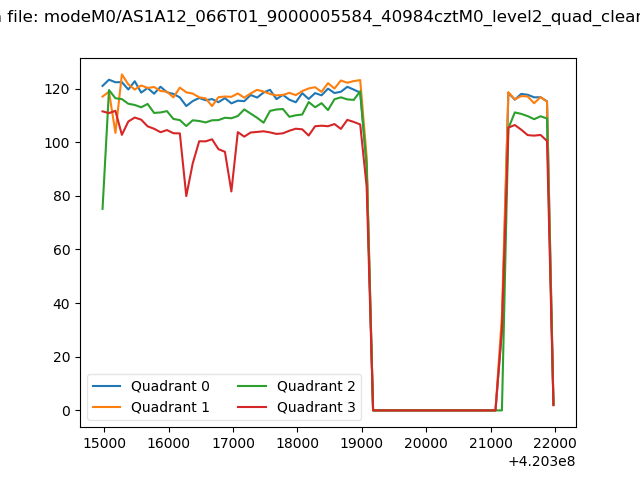 |
|
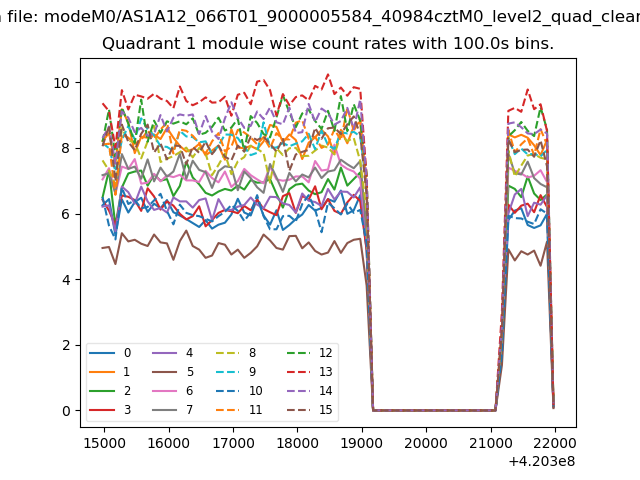
| Module-wise count rates for Quadrant A Data is divided into 100 sec bins |
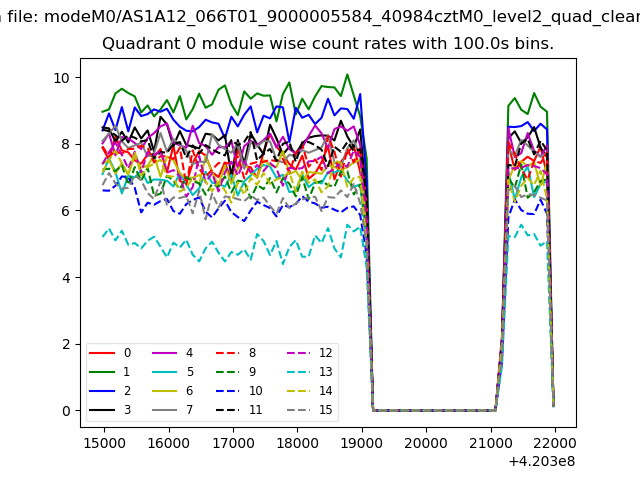 |
 |
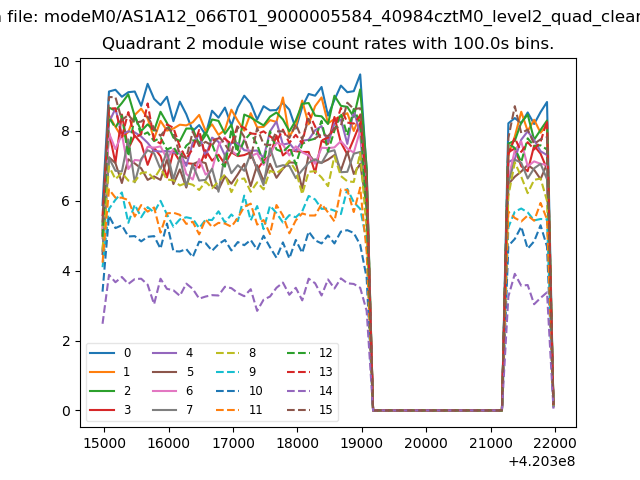
| Module-wise count rates for Quadrant B Data is divided into 100 sec bins |
 |
 |
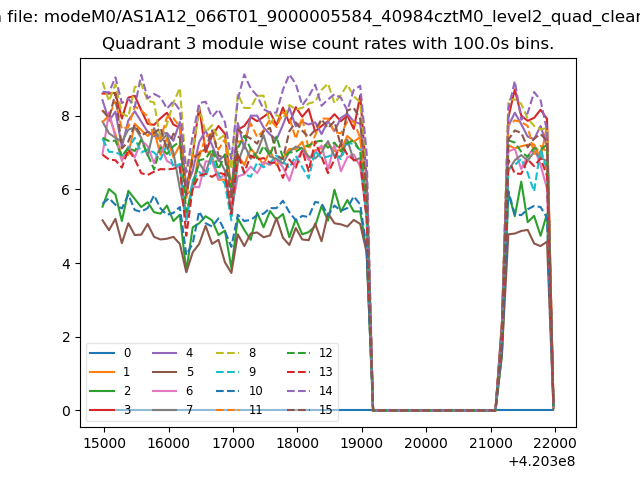
| Module-wise count rates for Quadrant C Data is divided into 100 sec bins |
 |
 |
| Module-wise count rates for Quadrant D Data is divided into 100 sec bins |
 |
 |
| Parameter | Plot |
|---|---|
| CZT HV Monitor | 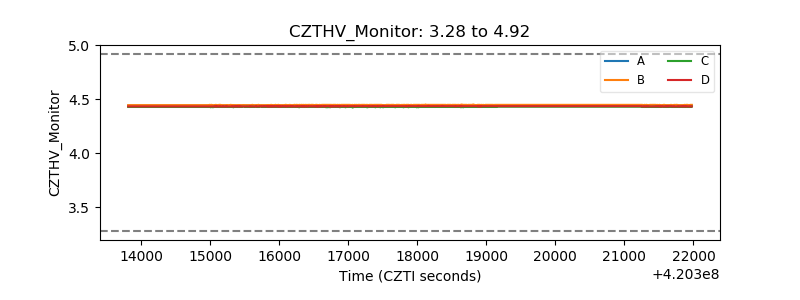 |
| D_VDD | 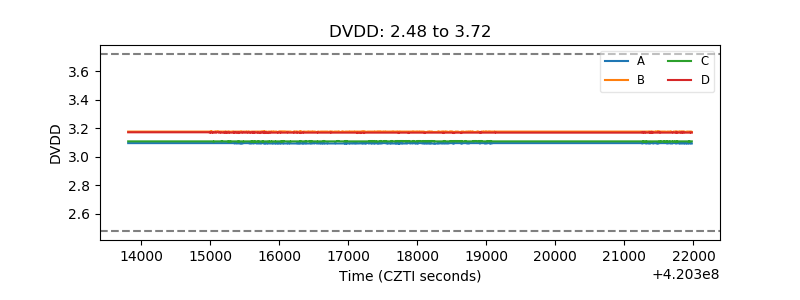 |
| Temperature 1 | 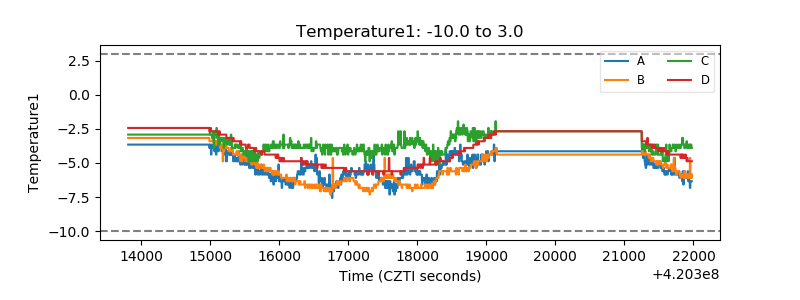 |
| Veto HV Monitor | 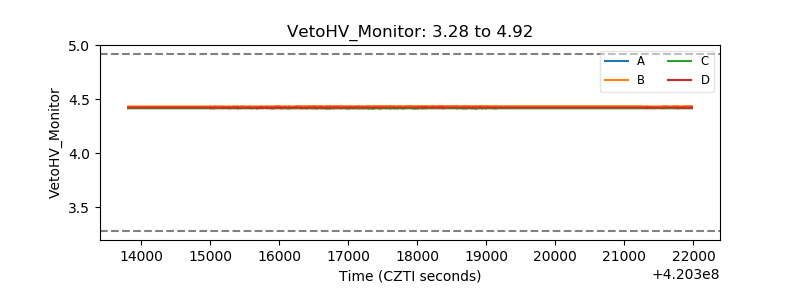 |
| Veto LLD |  |
| Alpha Counter | 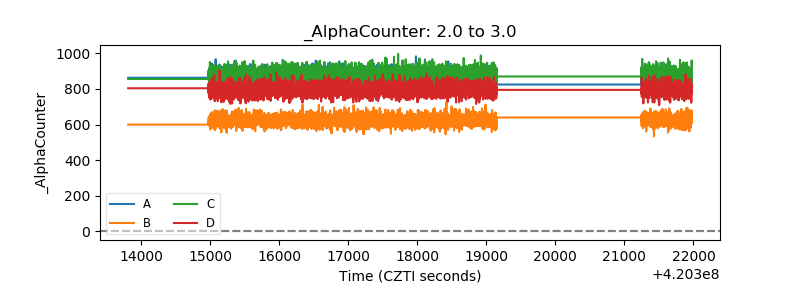 |
| _CPM_Rate | 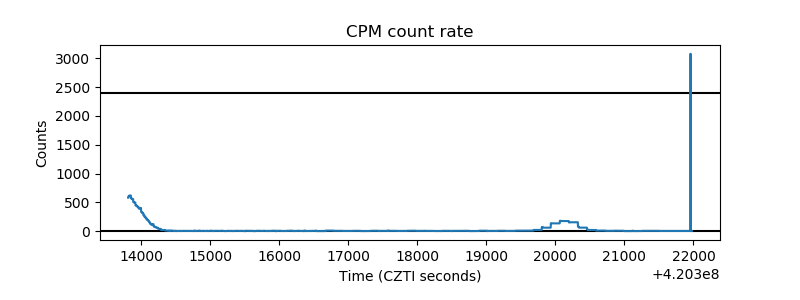 |
| CZT Counter | 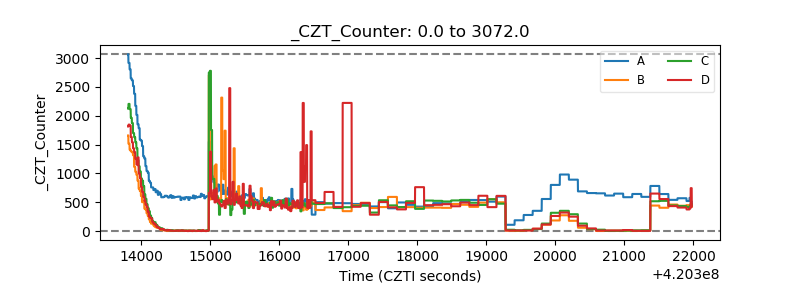 |
| +2.5 Volts monitor | 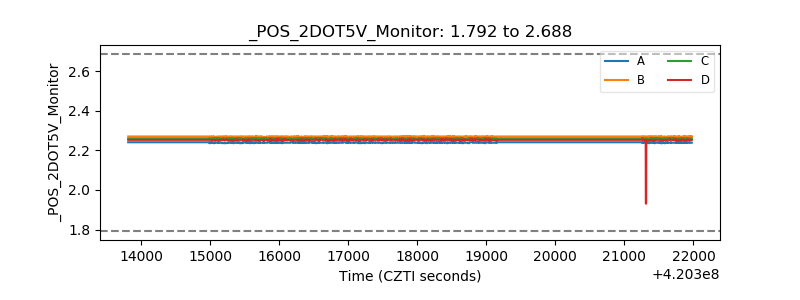 |
| +5 Volts monitor | 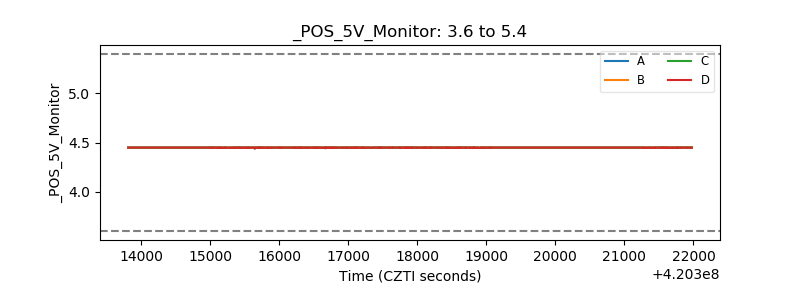 |
| _ROLL_ROT | 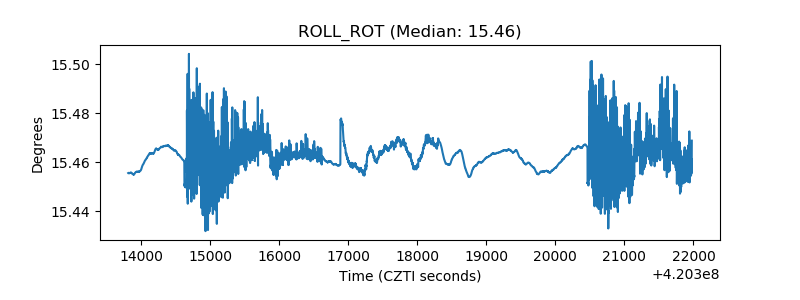 |
| _Roll_DEC | 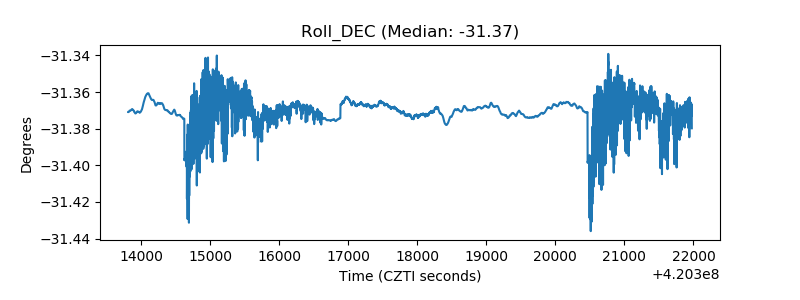 |
| _Roll_RA | 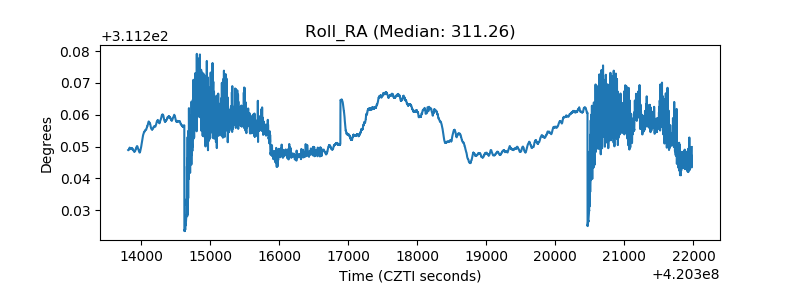 |
| Veto Counter | 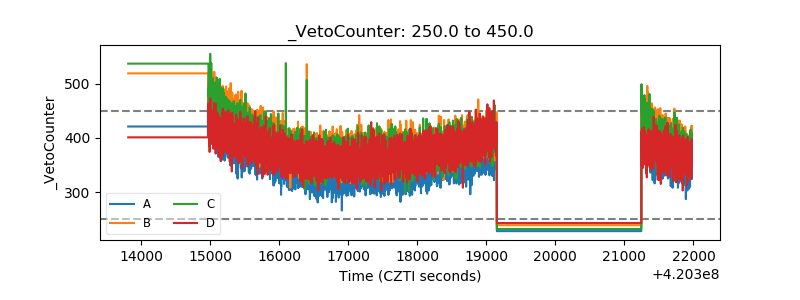 |