| Param | Original file | Final file |
|---|---|---|
| Filename | modeM0/AS1A12_066T01_9000005584_40985cztM0_level2.fits | modeM0/AS1A12_066T01_9000005584_40985cztM0_level2_quad_clean.evt |
| Size (bytes) | 304,119,360 | 87,603,840 |
| Size | 290.0 MB | 83.5 MB |
| Events in quadrant A | 2,783,073 | 596,145 |
| Events in quadrant B | 2,335,160 | 601,152 |
| Events in quadrant C | 2,648,337 | 564,397 |
| Events in quadrant D | 3,082,504 | 524,442 |
| Mode SS | |||
|---|---|---|---|
| Quadrant | BADHDUFLAG | Total packets | Discarded packets |
| A | 0 | 106 | 0 |
| B | 0 | 106 | 0 |
| C | 0 | 106 | 0 |
| D | 0 | 106 | 0 |
| Mode M0 | |||
|---|---|---|---|
| Quadrant | BADHDUFLAG | Total packets | Discarded packets |
| A | 0 | 11467 | 3 |
| B | 0 | 10658 | 2 |
| C | 0 | 11142 | 2 |
| D | 0 | 12829 | 2 |
| Mode M9 | |||
|---|---|---|---|
| Quadrant | BADHDUFLAG | Total packets | Discarded packets |
| A | 0 | 24 | 0 |
| B | 0 | 24 | 0 |
| C | 0 | 24 | 0 |
| D | 0 | 25 | 0 |
| Quadrant | Total seconds | Saturated seconds | Saturation percentage |
|---|---|---|---|
| A | 5236 | 11 | 0.210084% |
| B | 5236 | 9 | 0.171887% |
| C | 5236 | 65 | 1.241406% |
| D | 5236 | 96 | 1.833461% |
Noise dominated data is calculated using 1-second bins in cleaned event files. If a bin has >2000 counts, and if more than 50% of those come from <1% of pixels, then it is considered to be noise-dominated and hence unusable.
| Quadrant | # 1 sec bins | Bins with >0 counts | Bins with >2000 counts | High rate bins dominated by noise | Noise dominated (total time) | Noise dominated (detector-on time) | Marked lightcurve |
|---|---|---|---|---|---|---|---|
| A | 7089 | 5237 | 5 | 5 | 0.07% | 0.10% | 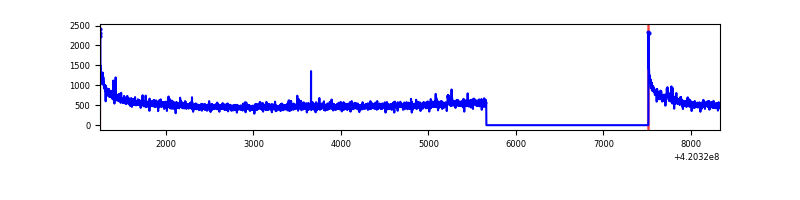 |
| B | 7089 | 5237 | 4 | 4 | 0.06% | 0.08% | 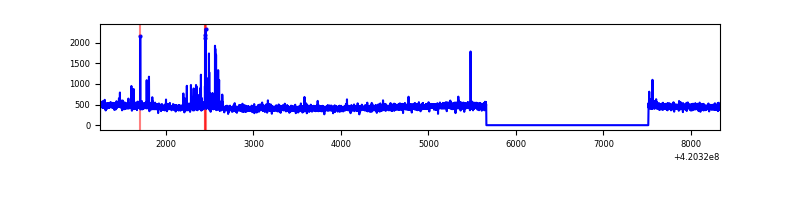 |
| C | 7089 | 5237 | 66 | 66 | 0.93% | 1.26% | 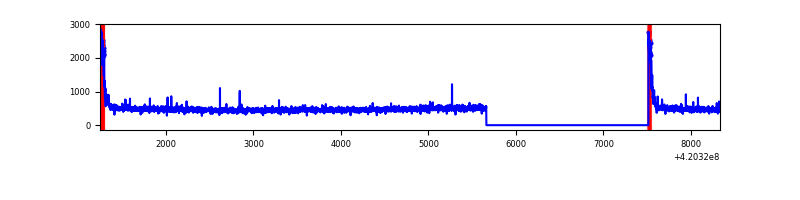 |
| D | 7089 | 5237 | 101 | 101 | 1.42% | 1.93% | 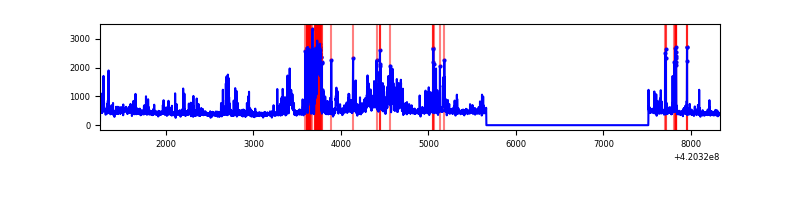 |
Top three noisy pixels from each quadrant. If the there are fewer than three noisy pixels in the level2.evt file, extra rows are filled as -1
| Pixel properties | Quadrant properties | ||||||
|---|---|---|---|---|---|---|---|
| Quadrant | DetID | PixID | Counts | Sigma | Mean | Median | Sigma |
| A | 10 | 83 | 481115 | 4049.3 | 579 | 568 | 118.7 |
| A | 12 | 189 | 59816 | 499.25 | 579 | 568 | 118.7 |
| A | 13 | 254 | 7804 | 60.97 | 579 | 568 | 118.7 |
| B | 5 | 255 | 66937 | 589.84 | 574 | 557 | 112.5 |
| B | 12 | 111 | 14202 | 121.25 | 574 | 557 | 112.5 |
| B | 11 | 111 | 13172 | 112.09 | 574 | 557 | 112.5 |
| C | 15 | 214 | 223862 | 1685.21 | 564 | 568 | 132.5 |
| C | 0 | 10 | 199325 | 1500.03 | 564 | 568 | 132.5 |
| C | 12 | 249 | 12500 | 90.05 | 564 | 568 | 132.5 |
| D | 13 | 249 | 476186 | 3483.57 | 560 | 543 | 136.5 |
| D | 2 | 249 | 200916 | 1467.51 | 560 | 543 | 136.5 |
| D | 12 | 233 | 90398 | 658.09 | 560 | 543 | 136.5 |
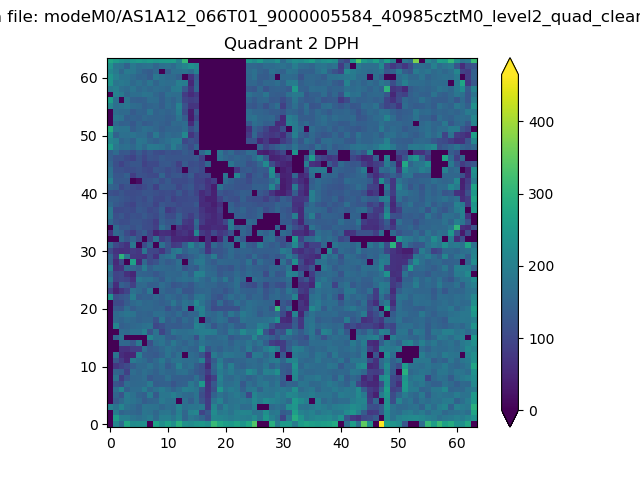
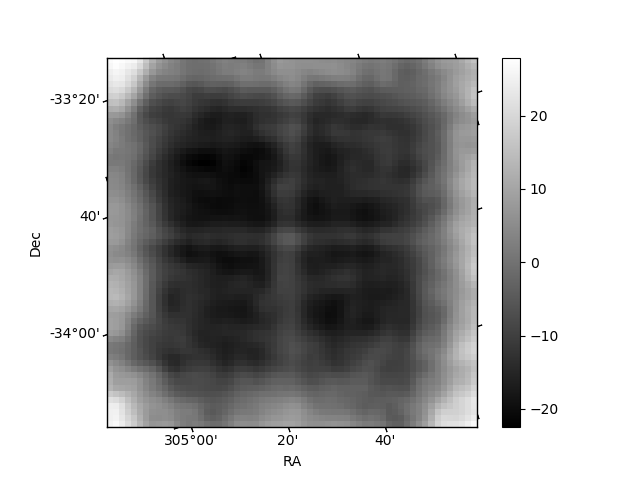
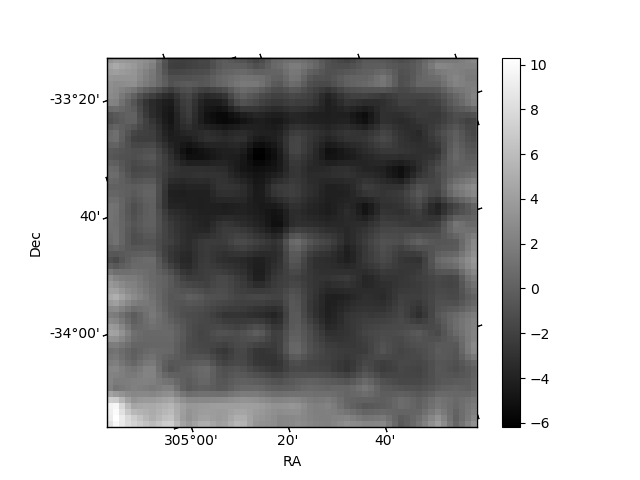
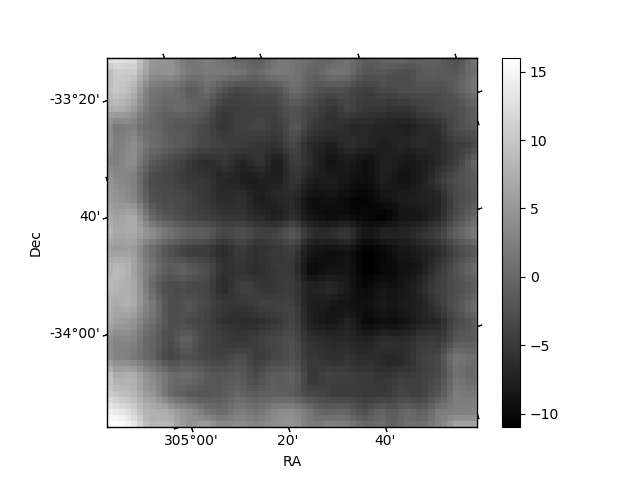
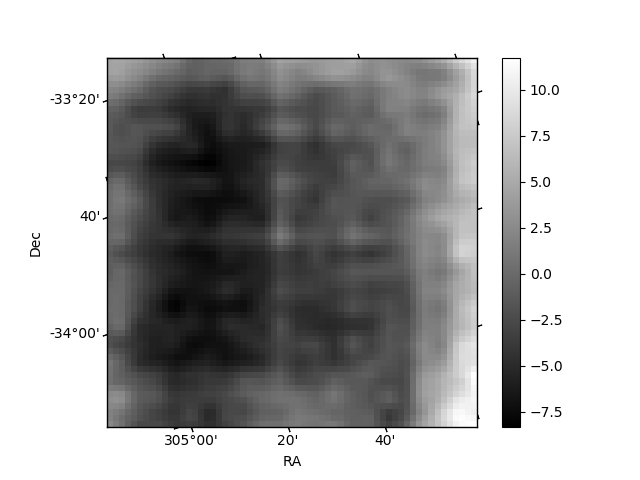
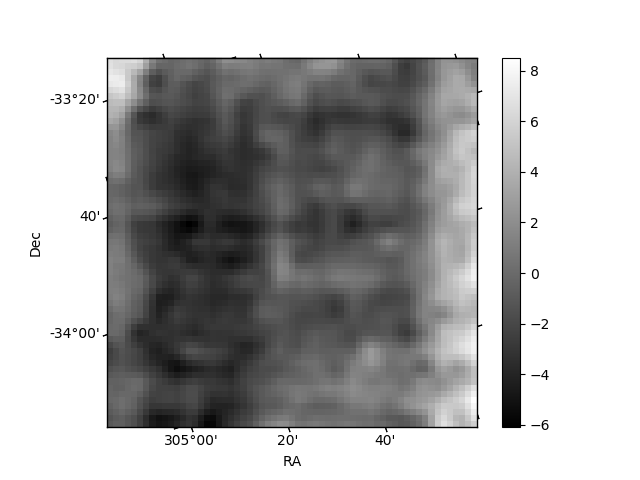
Histogram calculated using DETX and DETY for each event in the final _common_clean file
| Quadrant A | 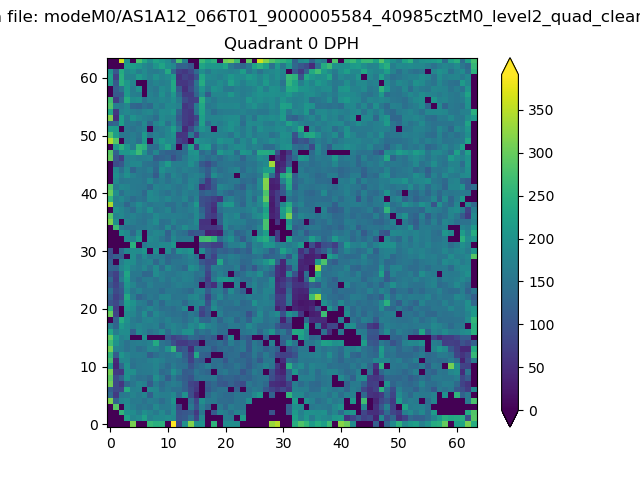 |
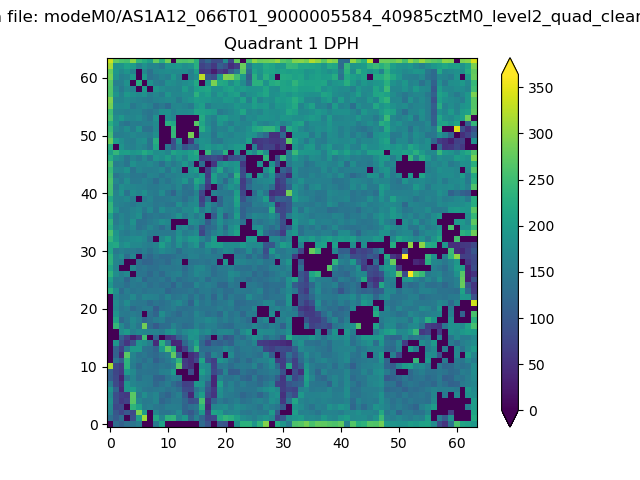 |
Quadrant B |
|---|---|---|---|
| Quadrant D | 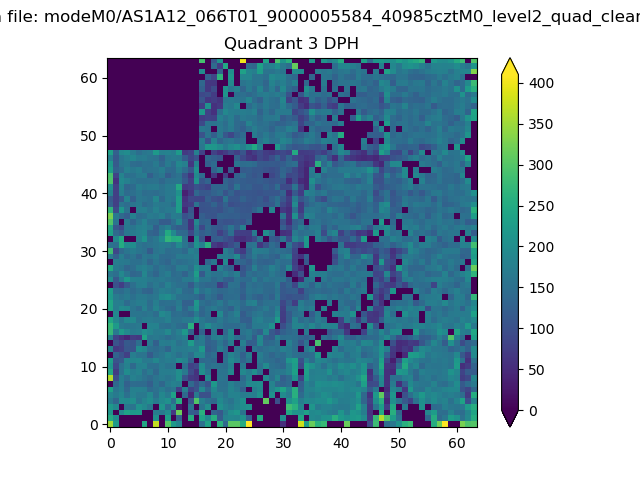 |
 |
Quadrant C |
| Plot type | Count rate plots | Images |
|---|---|---|
| Comparison with Poisson distribution Blue bars denote a histogram of data divided into 1 sec bins. Red curve is a Poisson curve with rate = median count rate of data. |
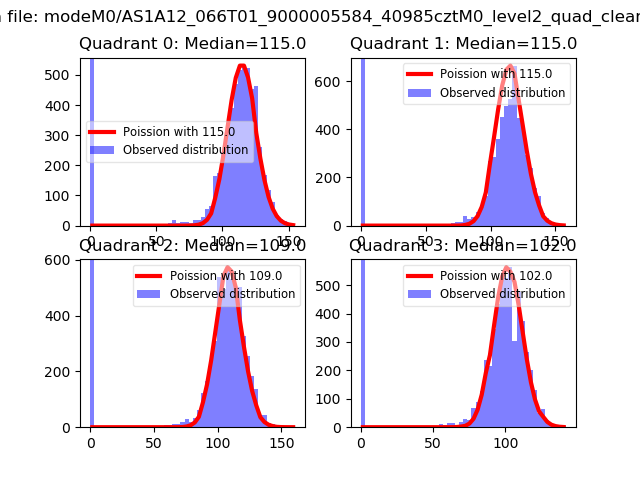 |
 |
| Quadrant-wise count rates Data is divided into 100 sec bins |
 |
|
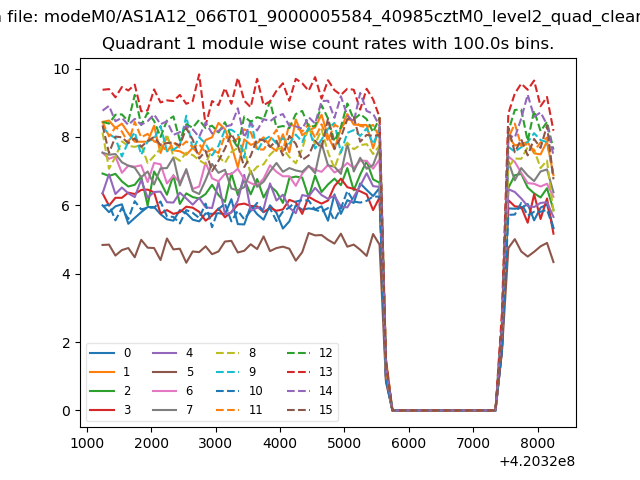
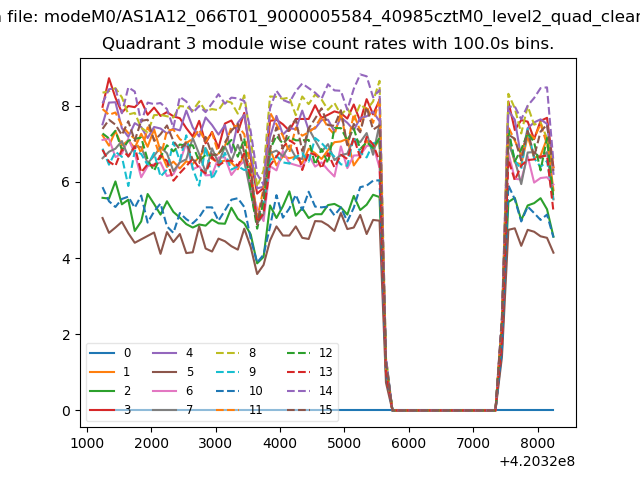
| Module-wise count rates for Quadrant A Data is divided into 100 sec bins |
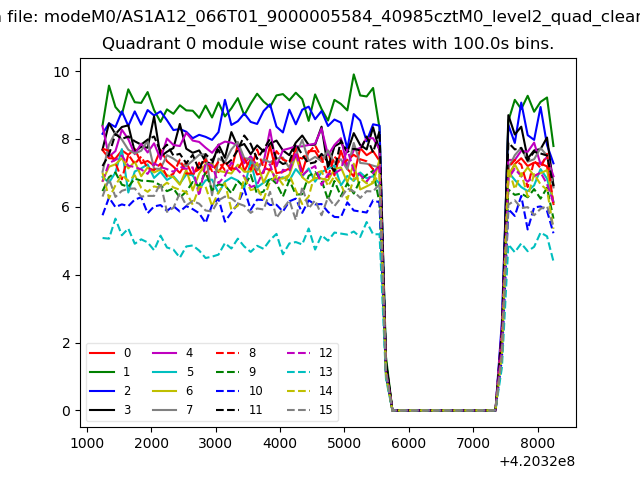 |
 |
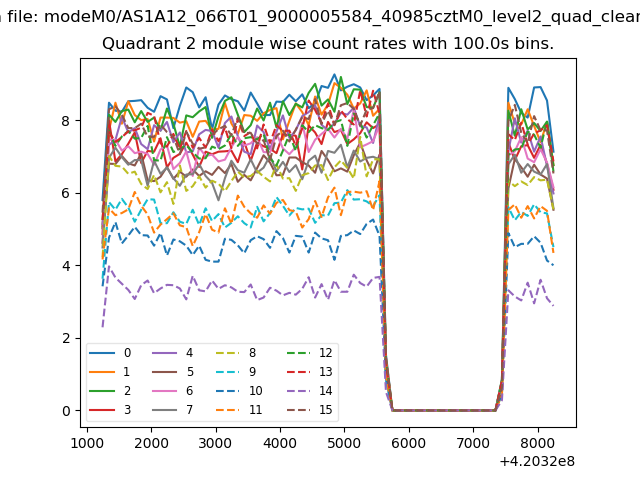
| Module-wise count rates for Quadrant B Data is divided into 100 sec bins |
 |
 |
| Module-wise count rates for Quadrant C Data is divided into 100 sec bins |
 |
 |
| Module-wise count rates for Quadrant D Data is divided into 100 sec bins |
 |
 |
| Parameter | Plot |
|---|---|
| CZT HV Monitor |  |
| D_VDD | 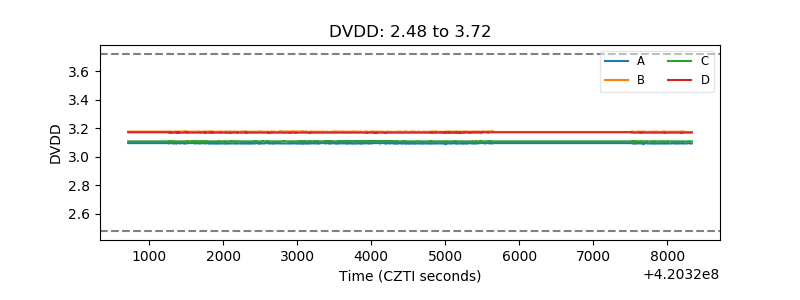 |
| Temperature 1 | 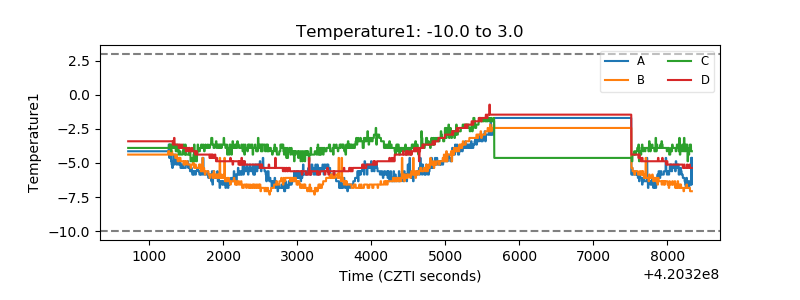 |
| Veto HV Monitor | 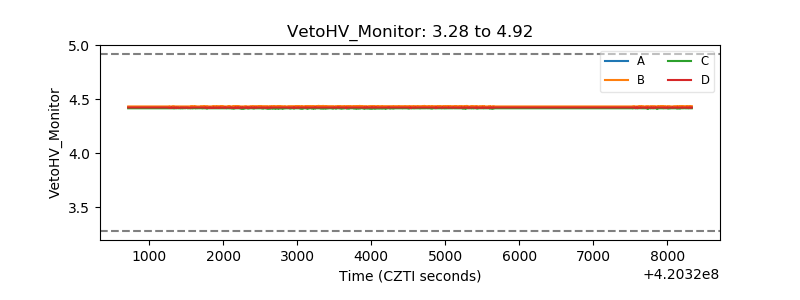 |
| Veto LLD | 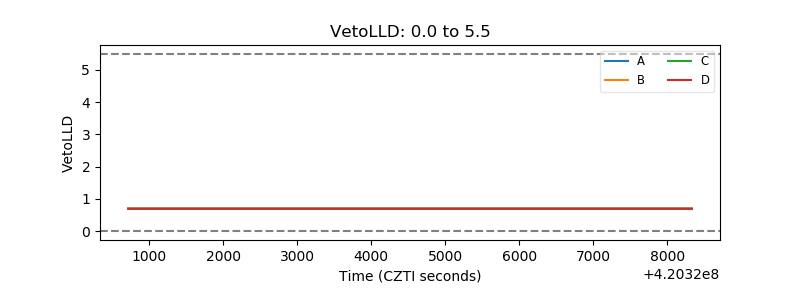 |
| Alpha Counter | 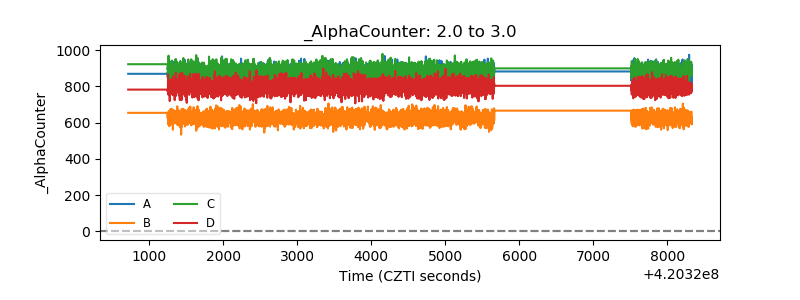 |
| _CPM_Rate | 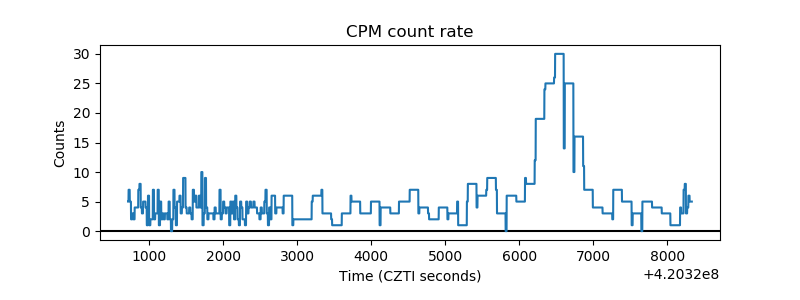 |
| CZT Counter | 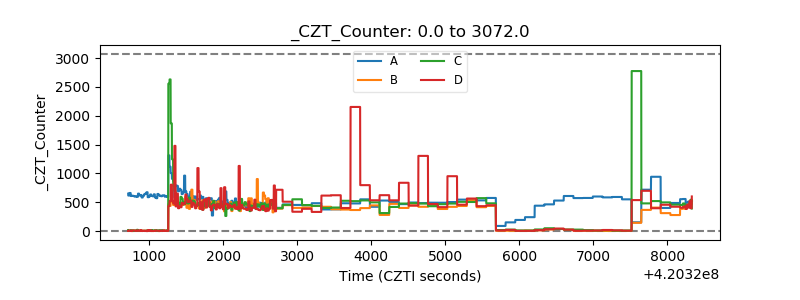 |
| +2.5 Volts monitor | 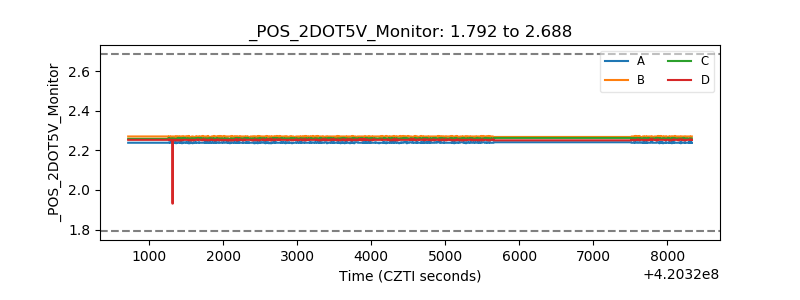 |
| +5 Volts monitor |  |
| _ROLL_ROT | 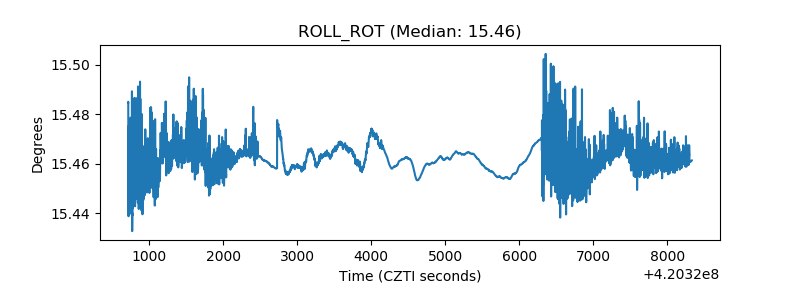 |
| _Roll_DEC | 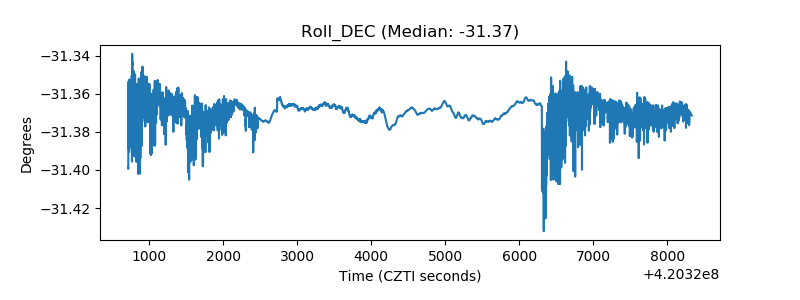 |
| _Roll_RA | 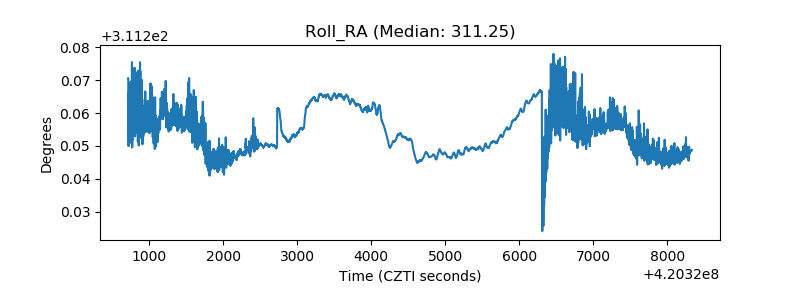 |
| Veto Counter |  |