| Param | Original file | Final file |
|---|---|---|
| Filename | modeM0/AS1A12_066T01_9000005584_40987cztM0_level2.fits | modeM0/AS1A12_066T01_9000005584_40987cztM0_level2_quad_clean.evt |
| Size (bytes) | 396,383,040 | 108,938,880 |
| Size | 378.0 MB | 103.9 MB |
| Events in quadrant A | 3,645,203 | 730,025 |
| Events in quadrant B | 3,191,929 | 741,518 |
| Events in quadrant C | 3,220,452 | 711,872 |
| Events in quadrant D | 4,098,470 | 652,298 |
| Mode SS | |||
|---|---|---|---|
| Quadrant | BADHDUFLAG | Total packets | Discarded packets |
| A | 0 | 136 | 0 |
| B | 0 | 136 | 0 |
| C | 0 | 136 | 0 |
| D | 0 | 136 | 0 |
| Mode M0 | |||
|---|---|---|---|
| Quadrant | BADHDUFLAG | Total packets | Discarded packets |
| A | 0 | 14947 | 3 |
| B | 0 | 14091 | 2 |
| C | 0 | 13660 | 2 |
| D | 0 | 16845 | 2 |
| Mode M9 | |||
|---|---|---|---|
| Quadrant | BADHDUFLAG | Total packets | Discarded packets |
| A | 0 | 28 | 0 |
| B | 0 | 28 | 0 |
| C | 0 | 28 | 0 |
| D | 0 | 28 | 0 |
| Quadrant | Total seconds | Saturated seconds | Saturation percentage |
|---|---|---|---|
| A | 6643 | 15 | 0.225802% |
| B | 6643 | 69 | 1.038687% |
| C | 6643 | 27 | 0.406443% |
| D | 6643 | 167 | 2.513924% |
Noise dominated data is calculated using 1-second bins in cleaned event files. If a bin has >2000 counts, and if more than 50% of those come from <1% of pixels, then it is considered to be noise-dominated and hence unusable.
| Quadrant | # 1 sec bins | Bins with >0 counts | Bins with >2000 counts | High rate bins dominated by noise | Noise dominated (total time) | Noise dominated (detector-on time) | Marked lightcurve |
|---|---|---|---|---|---|---|---|
| A | 9449 | 6645 | 4 | 4 | 0.04% | 0.06% | 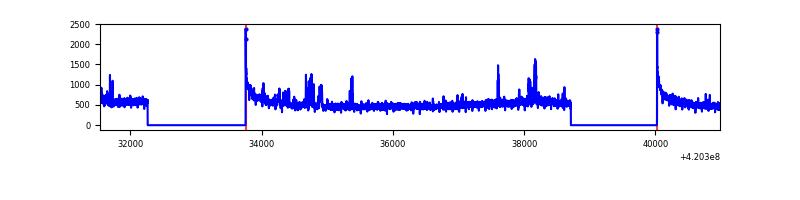 |
| B | 9449 | 6645 | 51 | 51 | 0.54% | 0.77% | 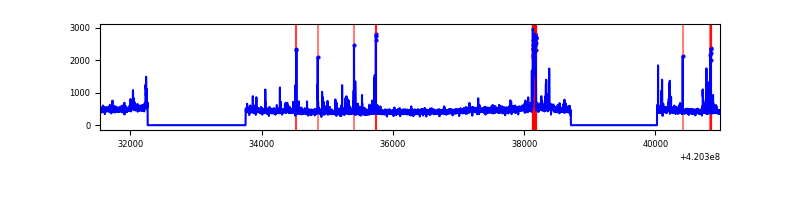 |
| C | 9449 | 6645 | 23 | 23 | 0.24% | 0.35% | 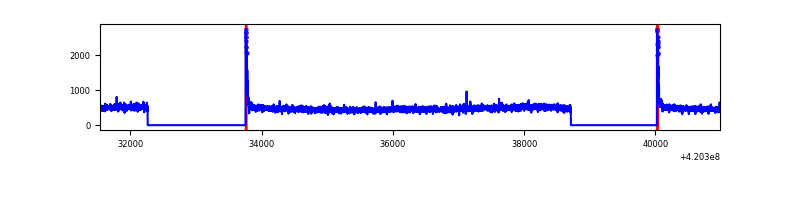 |
| D | 9449 | 6645 | 136 | 136 | 1.44% | 2.05% | 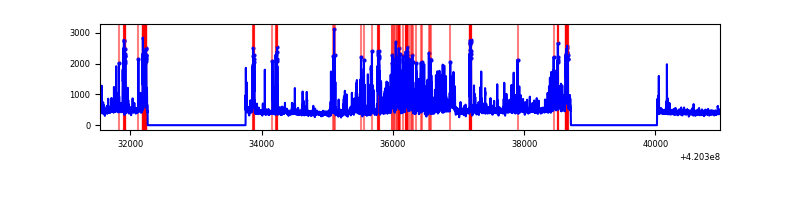 |
Top three noisy pixels from each quadrant. If the there are fewer than three noisy pixels in the level2.evt file, extra rows are filled as -1
| Pixel properties | Quadrant properties | ||||||
|---|---|---|---|---|---|---|---|
| Quadrant | DetID | PixID | Counts | Sigma | Mean | Median | Sigma |
| A | 10 | 83 | 579176 | 3761.48 | 744 | 728 | 153.8 |
| A | 12 | 189 | 183513 | 1188.6 | 744 | 728 | 153.8 |
| A | 13 | 254 | 10171 | 61.41 | 744 | 728 | 153.8 |
| B | 5 | 255 | 160067 | 1114.13 | 733 | 711 | 143.0 |
| B | 0 | 229 | 112664 | 782.71 | 733 | 711 | 143.0 |
| B | 0 | 186 | 30710 | 209.74 | 733 | 711 | 143.0 |
| C | 15 | 214 | 279257 | 1640.68 | 727 | 731 | 169.8 |
| C | 0 | 10 | 103449 | 605.07 | 727 | 731 | 169.8 |
| C | 12 | 249 | 6551 | 34.28 | 727 | 731 | 169.8 |
| D | 13 | 249 | 814016 | 4624.6 | 723 | 702 | 175.9 |
| D | 1 | 47 | 163814 | 927.47 | 723 | 702 | 175.9 |
| D | 9 | 19 | 148071 | 837.96 | 723 | 702 | 175.9 |
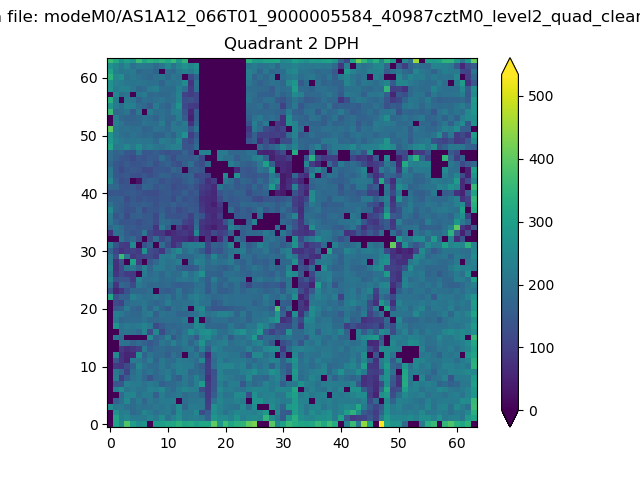
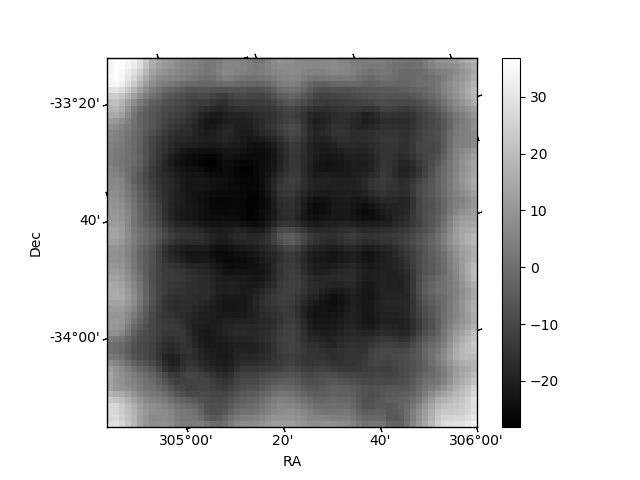
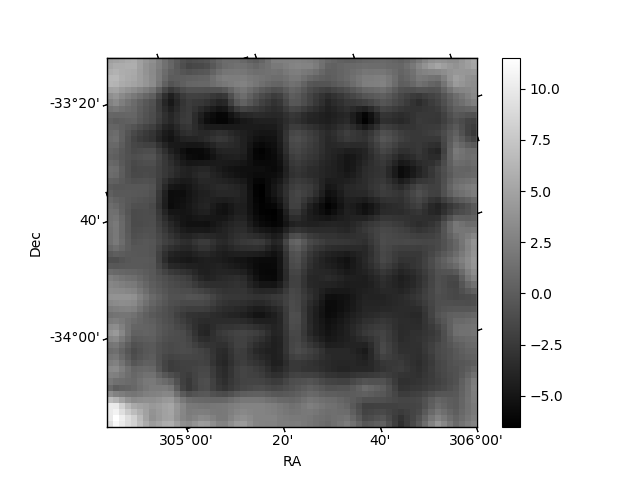
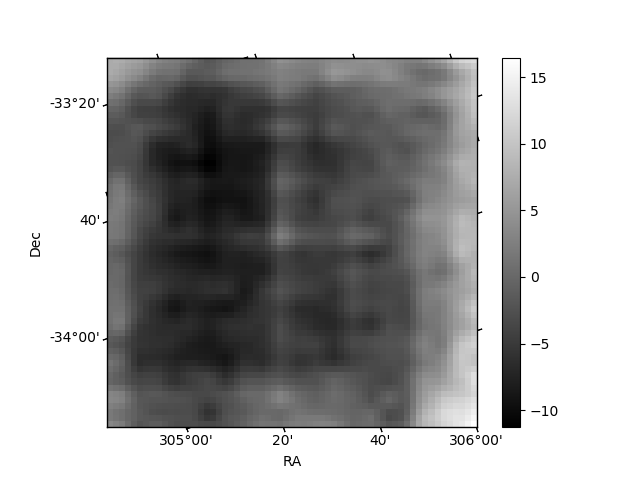
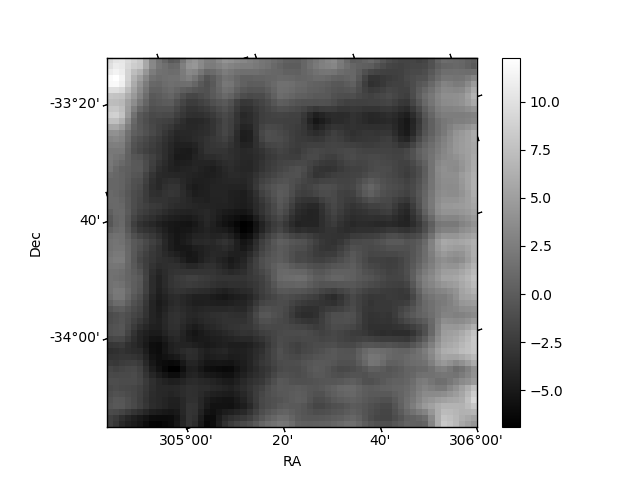
Histogram calculated using DETX and DETY for each event in the final _common_clean file
| Quadrant A | 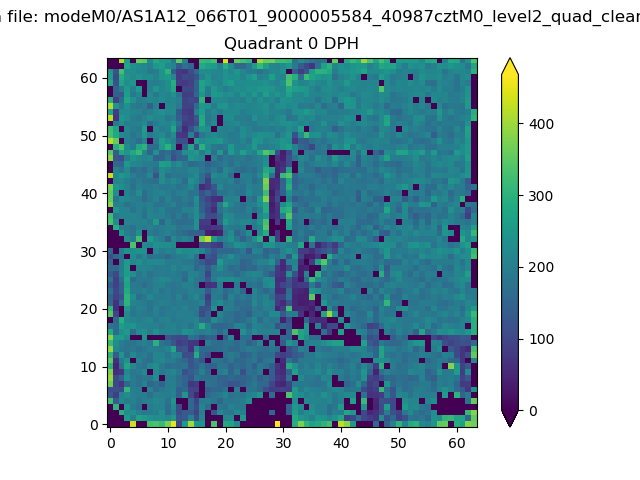 |
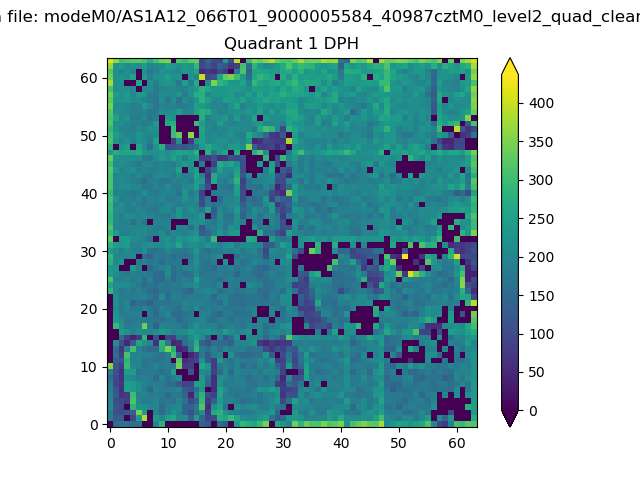 |
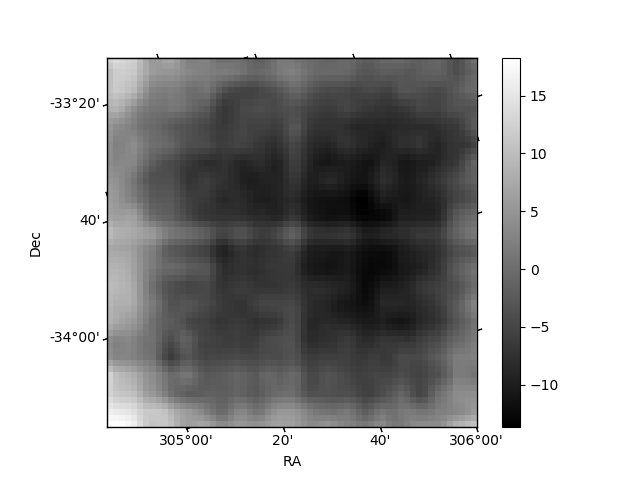
Quadrant B |
|---|---|---|---|
| Quadrant D | 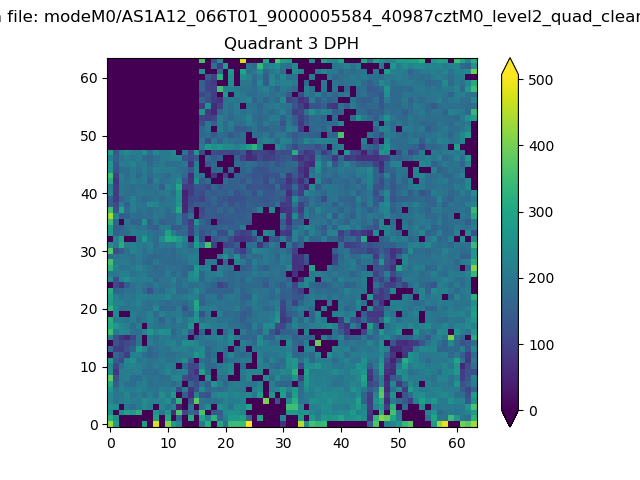 |
 |
Quadrant C |
| Plot type | Count rate plots | Images |
|---|---|---|
| Comparison with Poisson distribution Blue bars denote a histogram of data divided into 1 sec bins. Red curve is a Poisson curve with rate = median count rate of data. |
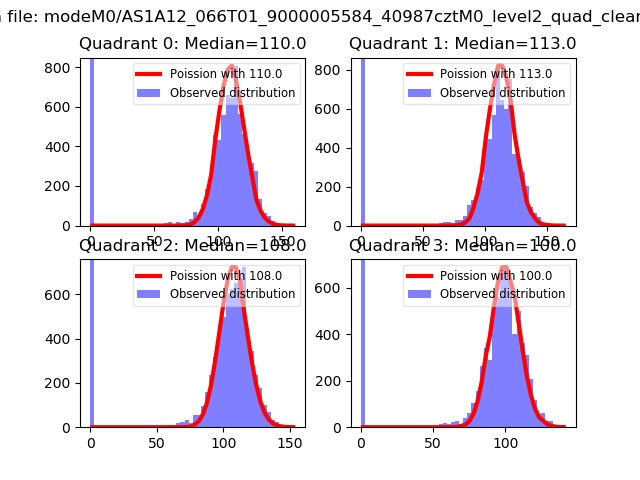 |
 |
| Quadrant-wise count rates Data is divided into 100 sec bins |
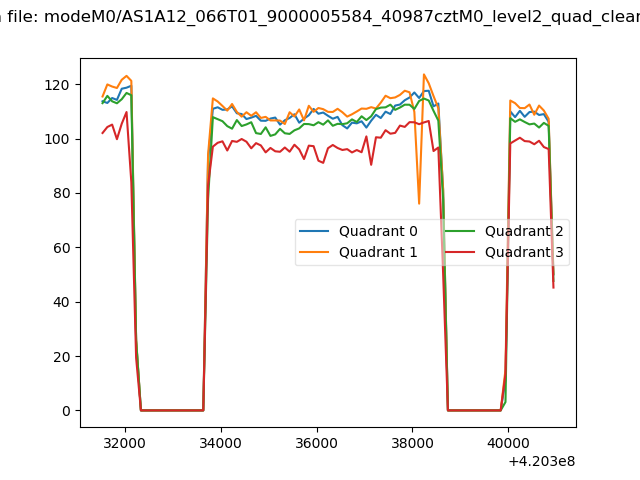 |
|
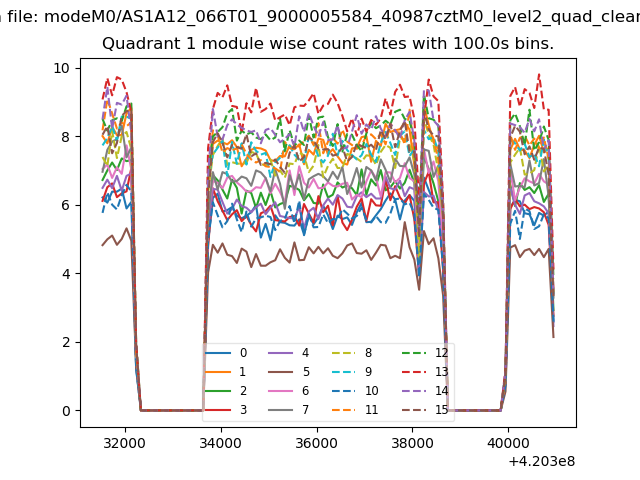
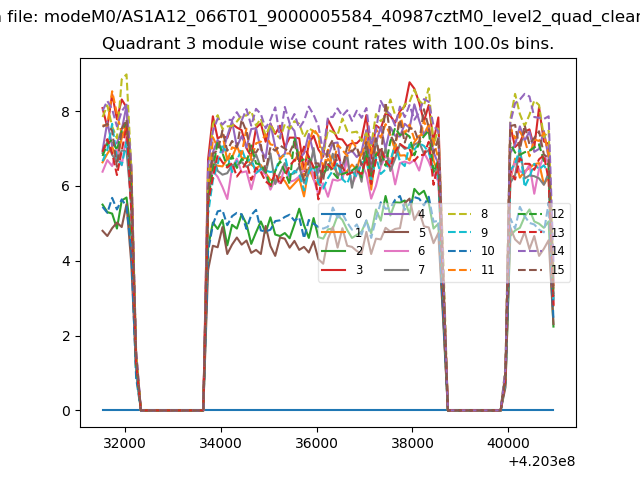
| Module-wise count rates for Quadrant A Data is divided into 100 sec bins |
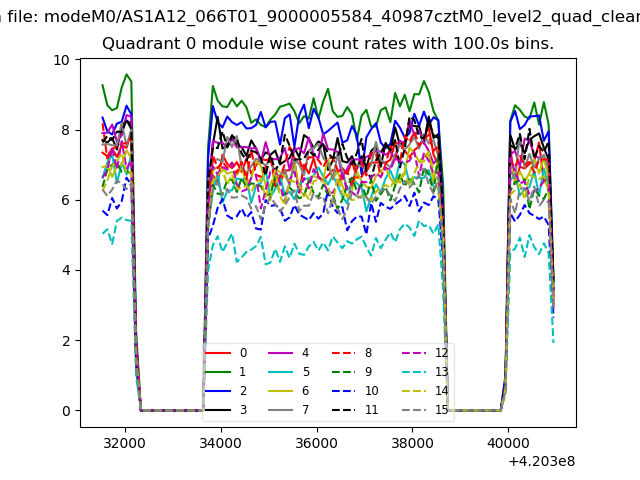 |
 |
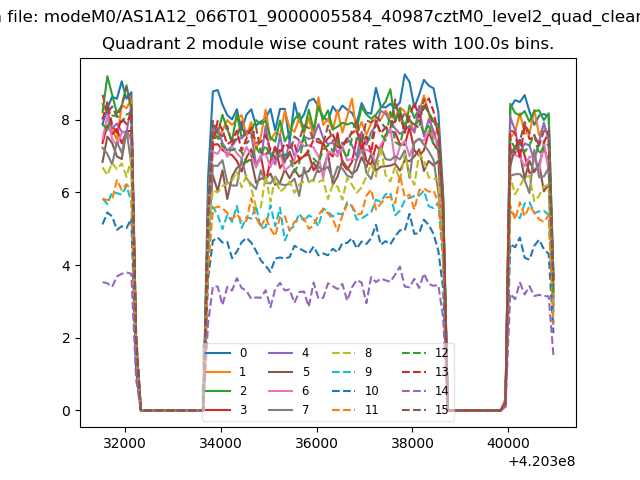
| Module-wise count rates for Quadrant B Data is divided into 100 sec bins |
 |
 |
| Module-wise count rates for Quadrant C Data is divided into 100 sec bins |
 |
 |
| Module-wise count rates for Quadrant D Data is divided into 100 sec bins |
 |
 |
| Parameter | Plot |
|---|---|
| CZT HV Monitor | 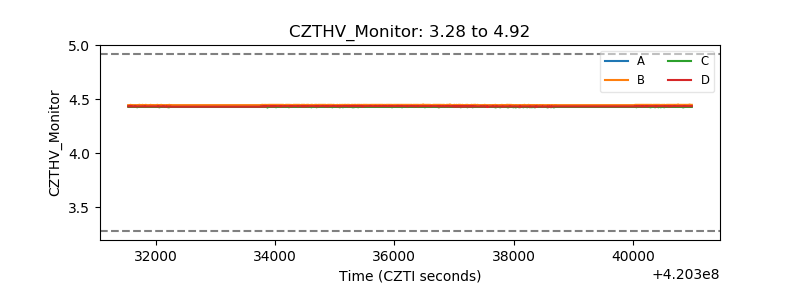 |
| D_VDD | 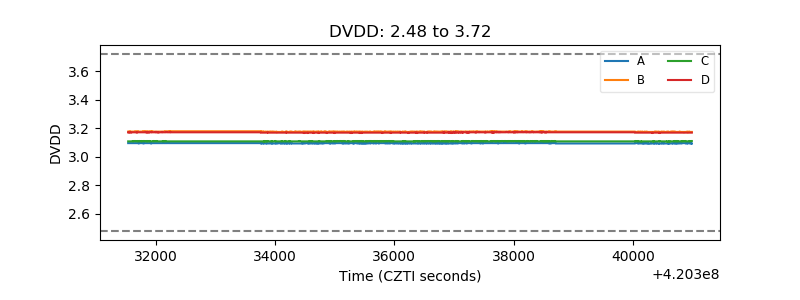 |
| Temperature 1 | 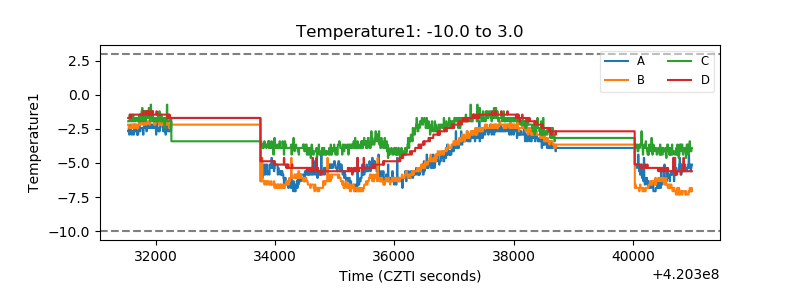 |
| Veto HV Monitor |  |
| Veto LLD | 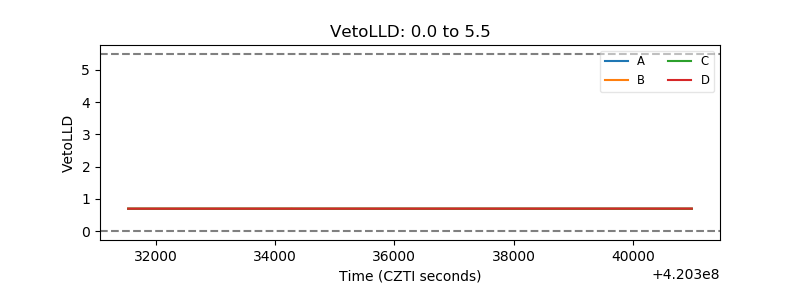 |
| Alpha Counter |  |
| _CPM_Rate |  |
| CZT Counter | 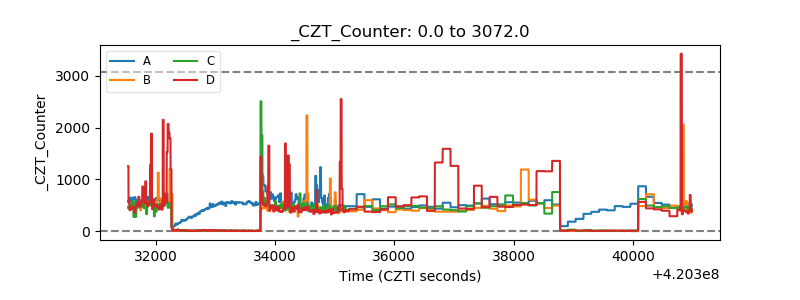 |
| +2.5 Volts monitor | 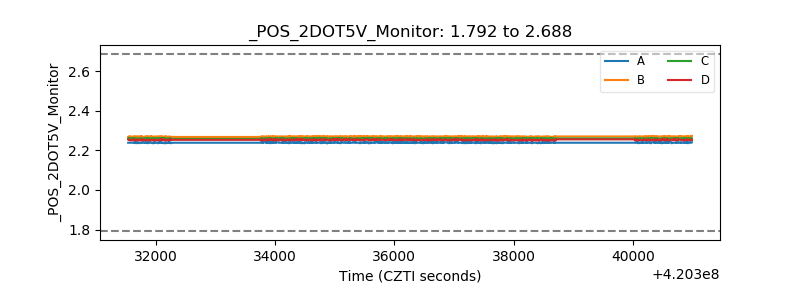 |
| +5 Volts monitor |  |
| _ROLL_ROT | 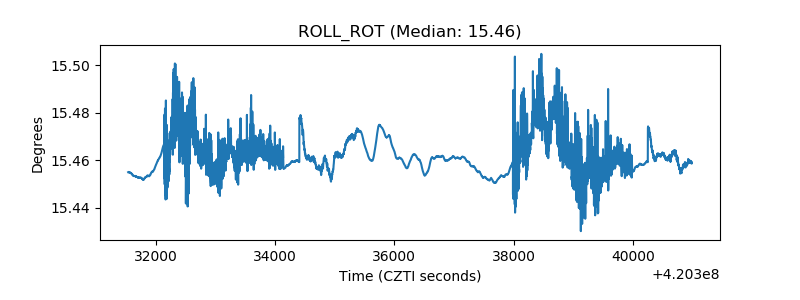 |
| _Roll_DEC | 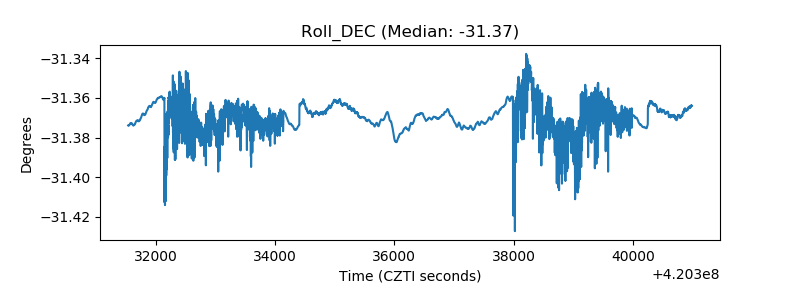 |
| _Roll_RA | 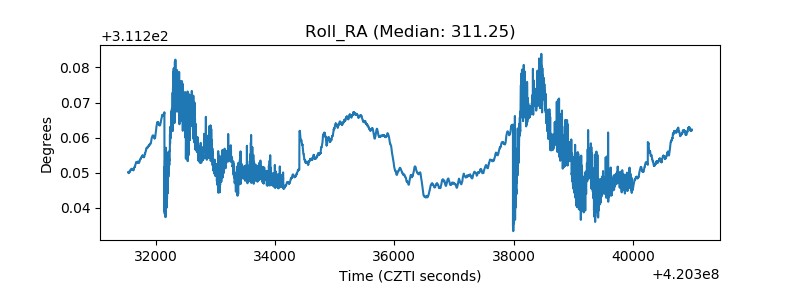 |
| Veto Counter | 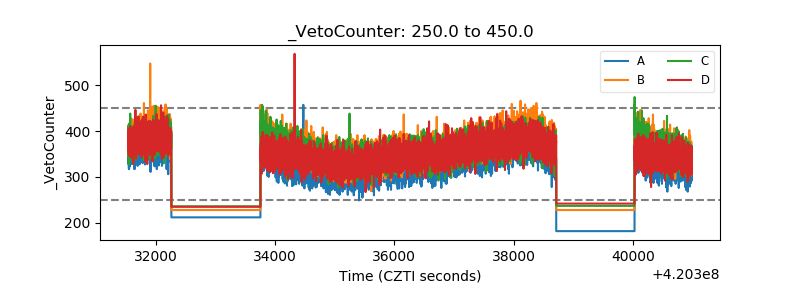 |