| Param | Original file | Final file |
|---|---|---|
| Filename | modeM0/AS1A12_066T01_9000005584_40991cztM0_level2.fits | modeM0/AS1A12_066T01_9000005584_40991cztM0_level2_quad_clean.evt |
| Size (bytes) | 875,851,200 | 235,863,360 |
| Size | 835.3 MB | 224.9 MB |
| Events in quadrant A | 7,611,077 | 1,591,476 |
| Events in quadrant B | 8,253,667 | 1,574,294 |
| Events in quadrant C | 7,093,508 | 1,549,544 |
| Events in quadrant D | 8,324,048 | 1,411,799 |
| Mode SS | |||
|---|---|---|---|
| Quadrant | BADHDUFLAG | Total packets | Discarded packets |
| A | 0 | 300 | 0 |
| B | 0 | 300 | 0 |
| C | 0 | 300 | 0 |
| D | 0 | 300 | 0 |
| Mode M0 | |||
|---|---|---|---|
| Quadrant | BADHDUFLAG | Total packets | Discarded packets |
| A | 0 | 31328 | 3 |
| B | 0 | 34831 | 3 |
| C | 0 | 30251 | 3 |
| D | 0 | 34928 | 3 |
| Mode M9 | |||
|---|---|---|---|
| Quadrant | BADHDUFLAG | Total packets | Discarded packets |
| A | 0 | 45 | 0 |
| B | 0 | 44 | 0 |
| C | 0 | 44 | 0 |
| D | 0 | 44 | 0 |
| Quadrant | Total seconds | Saturated seconds | Saturation percentage |
|---|---|---|---|
| A | 14692 | 27 | 0.183773% |
| B | 14692 | 572 | 3.893275% |
| C | 14692 | 66 | 0.449224% |
| D | 14692 | 321 | 2.184863% |
Noise dominated data is calculated using 1-second bins in cleaned event files. If a bin has >2000 counts, and if more than 50% of those come from <1% of pixels, then it is considered to be noise-dominated and hence unusable.
| Quadrant | # 1 sec bins | Bins with >0 counts | Bins with >2000 counts | High rate bins dominated by noise | Noise dominated (total time) | Noise dominated (detector-on time) | Marked lightcurve |
|---|---|---|---|---|---|---|---|
| A | 17347 | 14694 | 6 | 6 | 0.03% | 0.04% | 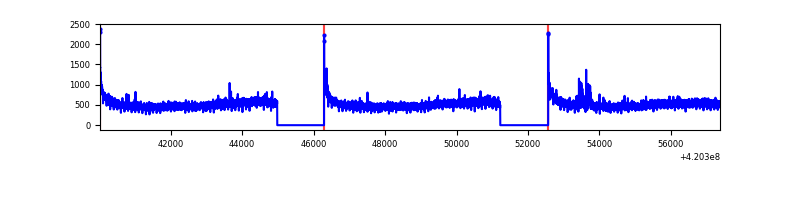 |
| B | 17347 | 14694 | 424 | 424 | 2.44% | 2.89% | 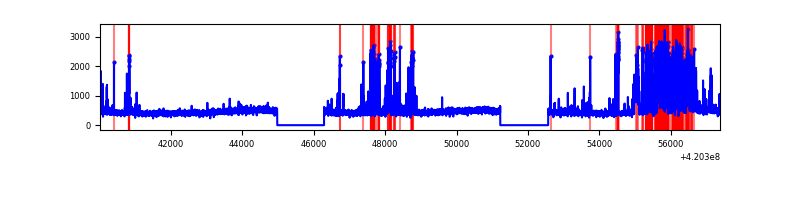 |
| C | 17347 | 14694 | 55 | 55 | 0.32% | 0.37% | 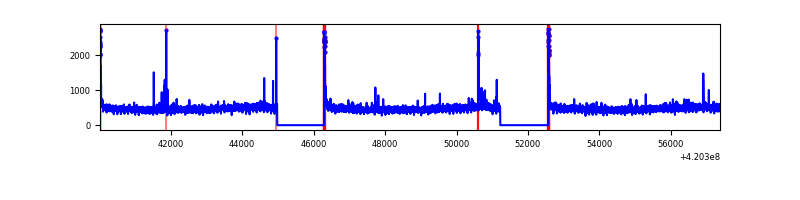 |
| D | 17347 | 14694 | 289 | 289 | 1.67% | 1.97% | 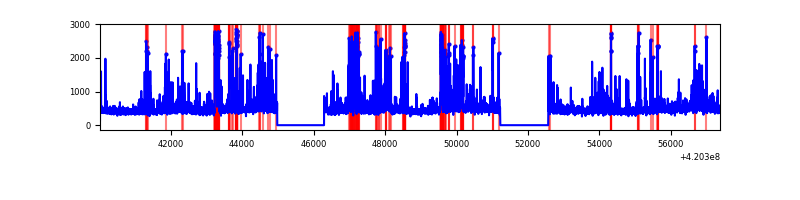 |
Top three noisy pixels from each quadrant. If the there are fewer than three noisy pixels in the level2.evt file, extra rows are filled as -1
| Pixel properties | Quadrant properties | ||||||
|---|---|---|---|---|---|---|---|
| Quadrant | DetID | PixID | Counts | Sigma | Mean | Median | Sigma |
| A | 10 | 83 | 1148250 | 3419.82 | 1643 | 1605 | 335.3 |
| A | 12 | 189 | 103524 | 303.97 | 1643 | 1605 | 335.3 |
| A | 13 | 254 | 22935 | 63.62 | 1643 | 1605 | 335.3 |
| B | 5 | 255 | 1830421 | 5860.58 | 1599 | 1554 | 312.1 |
| B | 0 | 229 | 135949 | 430.67 | 1599 | 1554 | 312.1 |
| B | 12 | 111 | 40261 | 124.04 | 1599 | 1554 | 312.1 |
| C | 15 | 214 | 613665 | 1658.58 | 1594 | 1603 | 369.0 |
| C | 0 | 10 | 177258 | 475.99 | 1594 | 1603 | 369.0 |
| C | 12 | 249 | 51282 | 134.62 | 1594 | 1603 | 369.0 |
| D | 13 | 249 | 1169766 | 3021.76 | 1593 | 1549 | 386.6 |
| D | 12 | 233 | 356768 | 918.82 | 1593 | 1549 | 386.6 |
| D | 2 | 249 | 312858 | 805.24 | 1593 | 1549 | 386.6 |
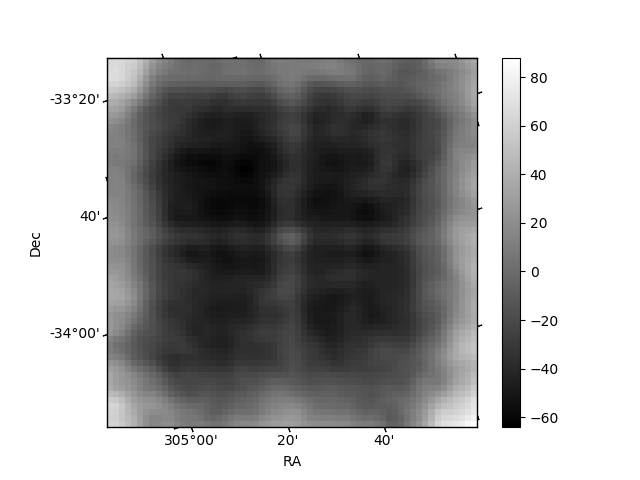
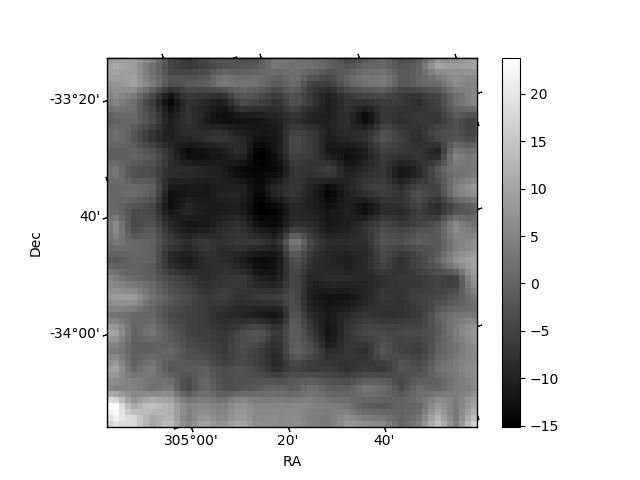
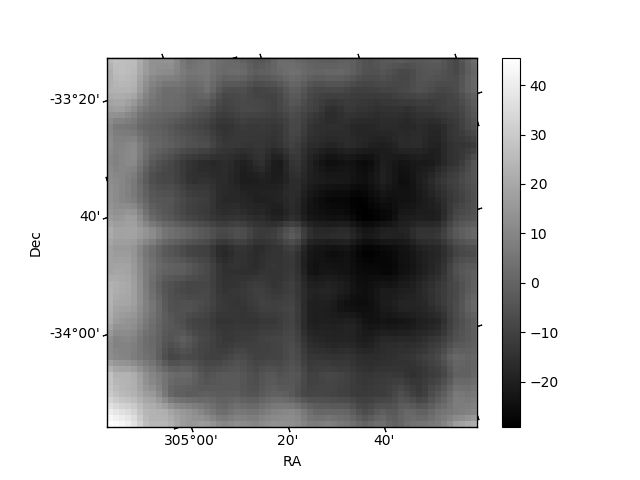
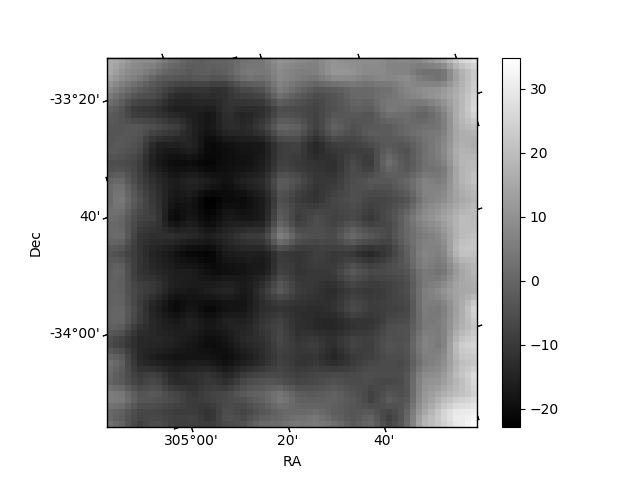
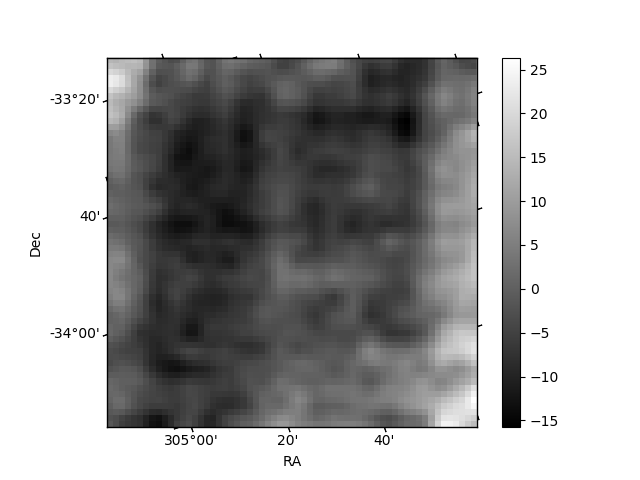
Histogram calculated using DETX and DETY for each event in the final _common_clean file
| Quadrant A | 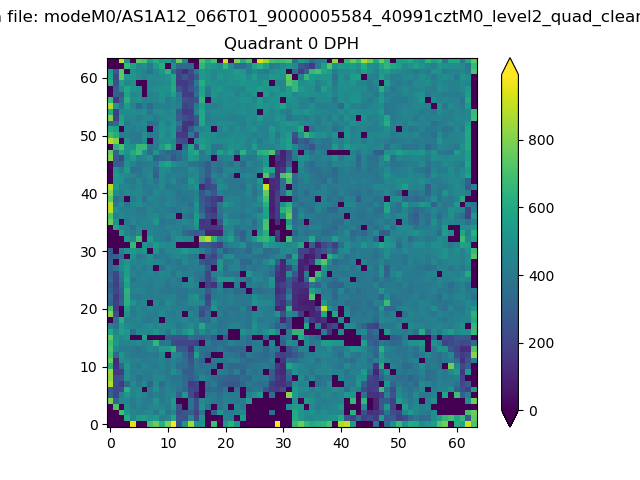 |
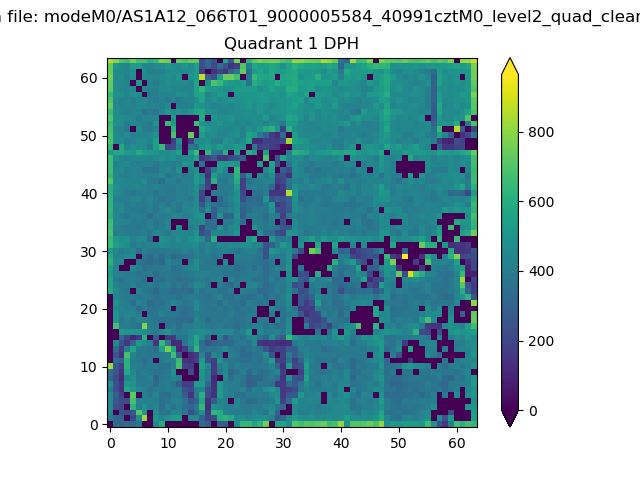 |
Quadrant B |
|---|---|---|---|
| Quadrant D | 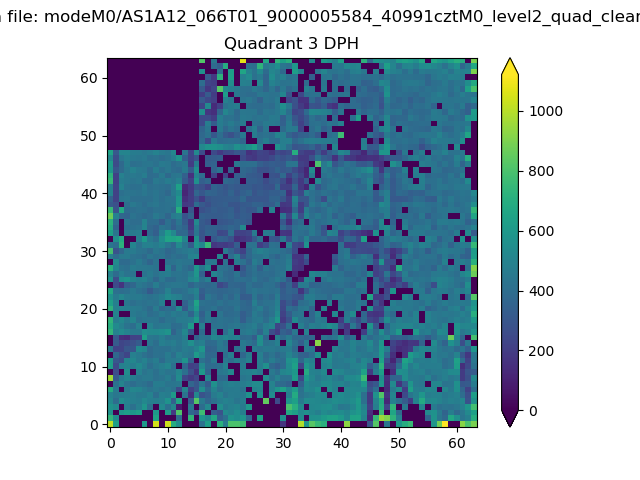 |
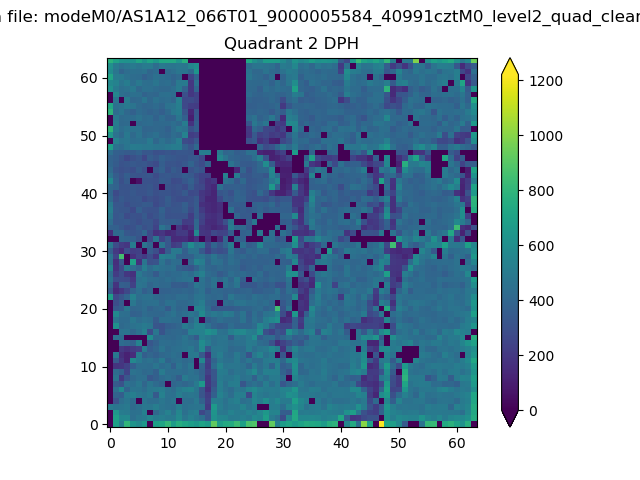 |
Quadrant C |
| Plot type | Count rate plots | Images |
|---|---|---|
| Comparison with Poisson distribution Blue bars denote a histogram of data divided into 1 sec bins. Red curve is a Poisson curve with rate = median count rate of data. |
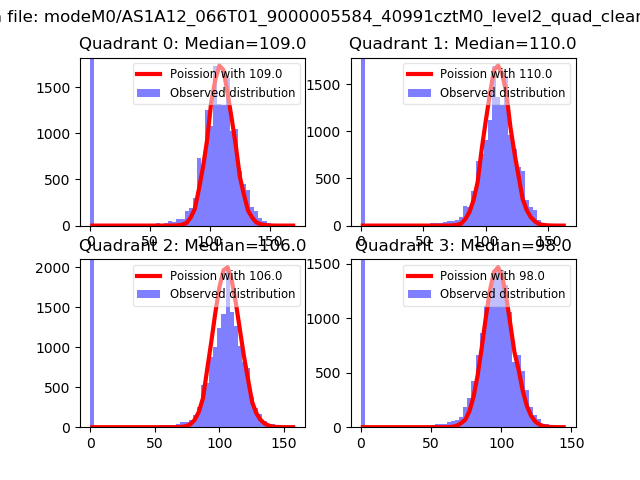 |
 |
| Quadrant-wise count rates Data is divided into 100 sec bins |
 |
|
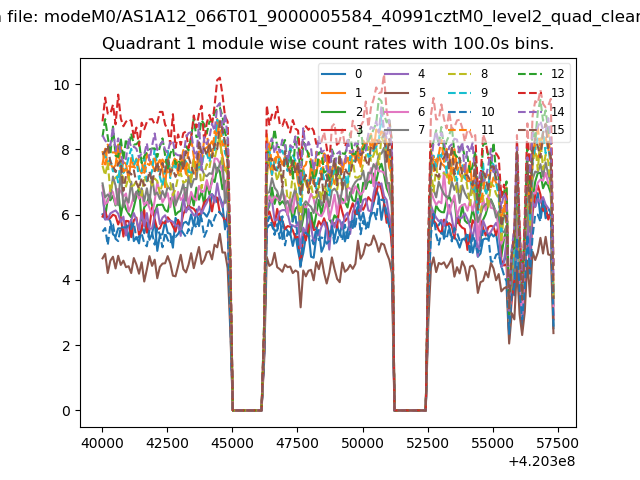
| Module-wise count rates for Quadrant A Data is divided into 100 sec bins |
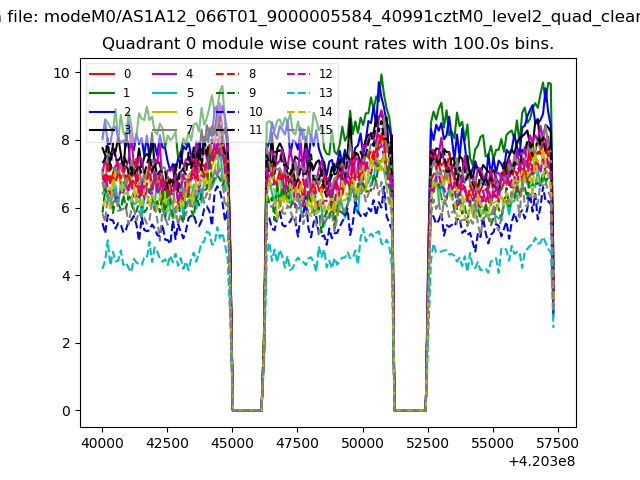 |
 |
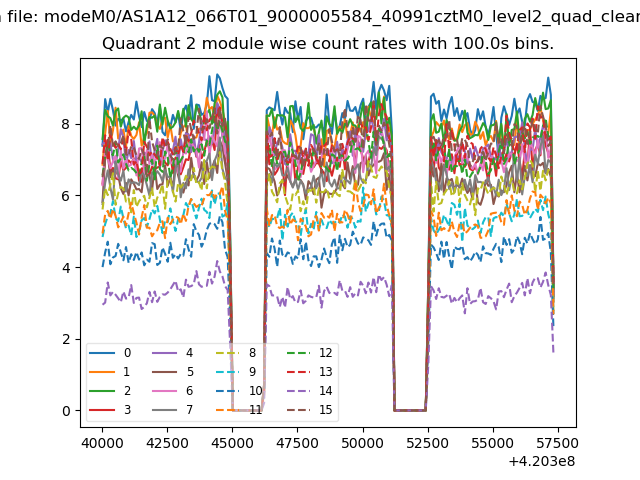
| Module-wise count rates for Quadrant B Data is divided into 100 sec bins |
 |
 |
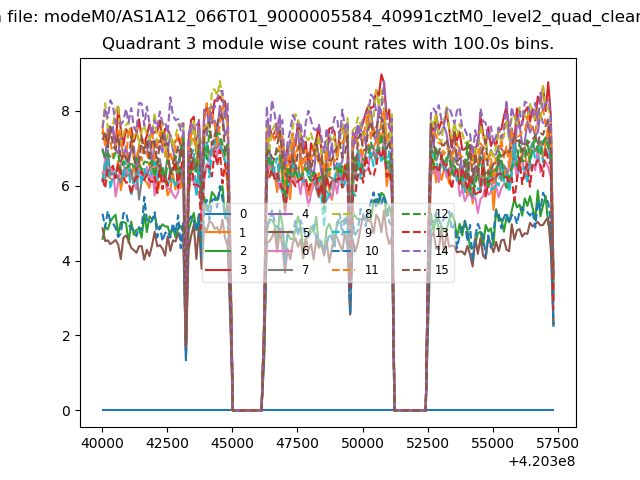
| Module-wise count rates for Quadrant C Data is divided into 100 sec bins |
 |
 |
| Module-wise count rates for Quadrant D Data is divided into 100 sec bins |
 |
 |
| Parameter | Plot |
|---|---|
| CZT HV Monitor | 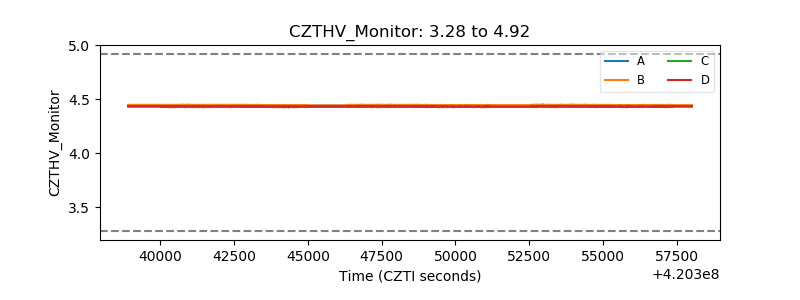 |
| D_VDD | 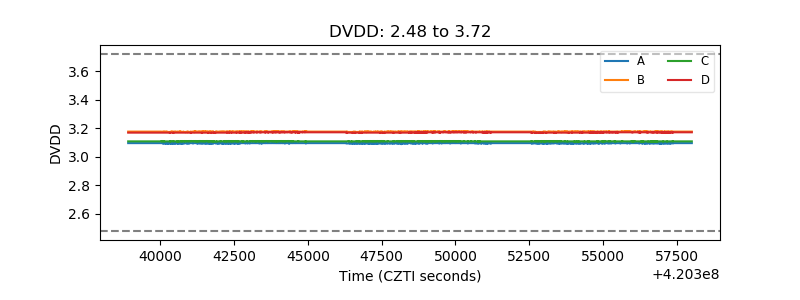 |
| Temperature 1 | 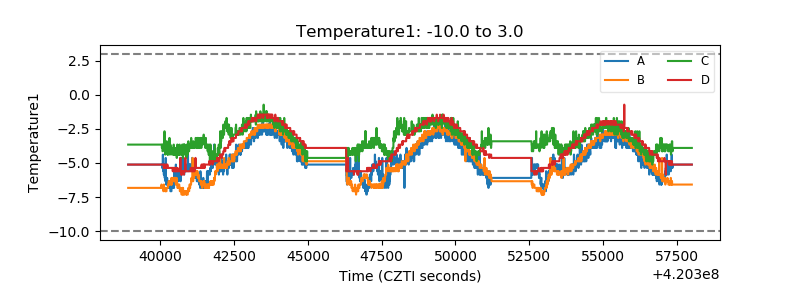 |
| Veto HV Monitor | 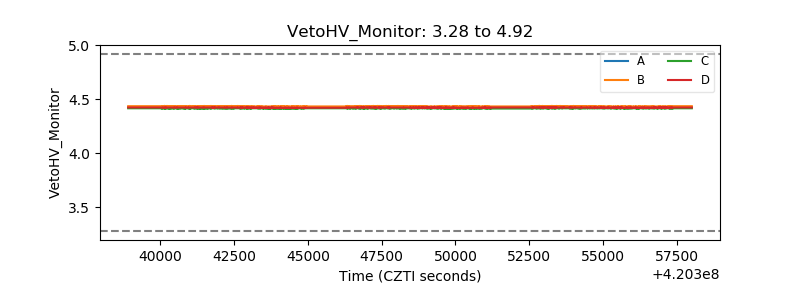 |
| Veto LLD | 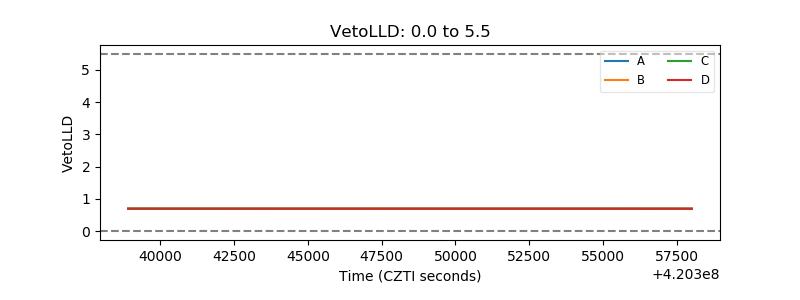 |
| Alpha Counter | 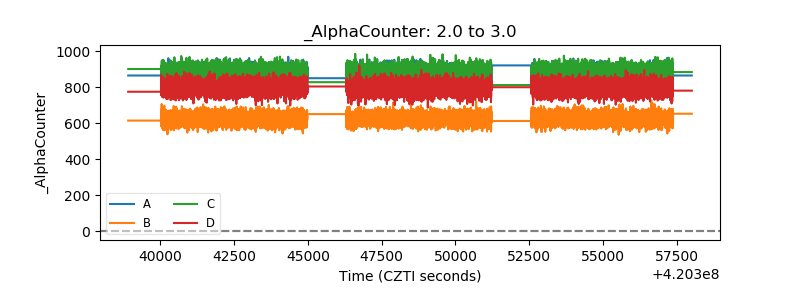 |
| _CPM_Rate | 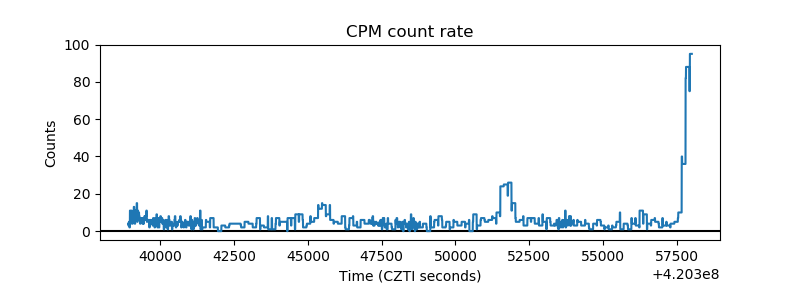 |
| CZT Counter | 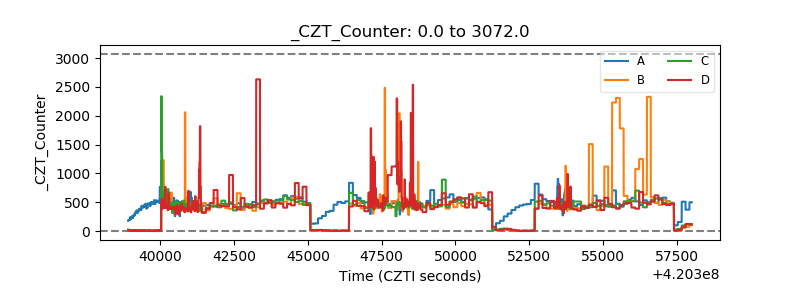 |
| +2.5 Volts monitor | 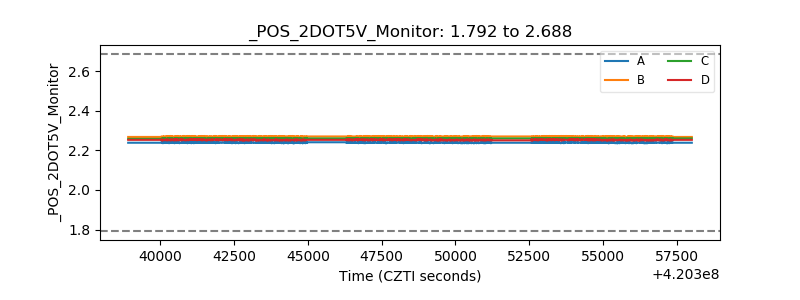 |
| +5 Volts monitor | 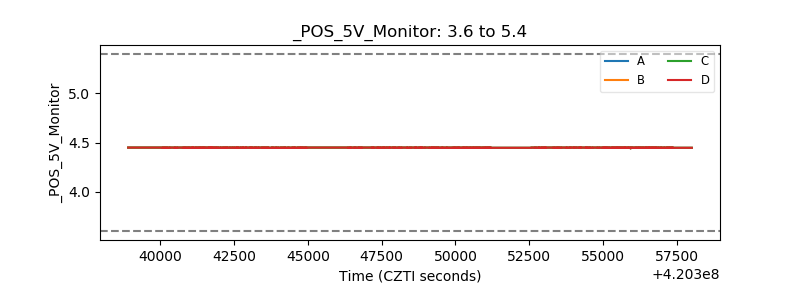 |
| _ROLL_ROT | 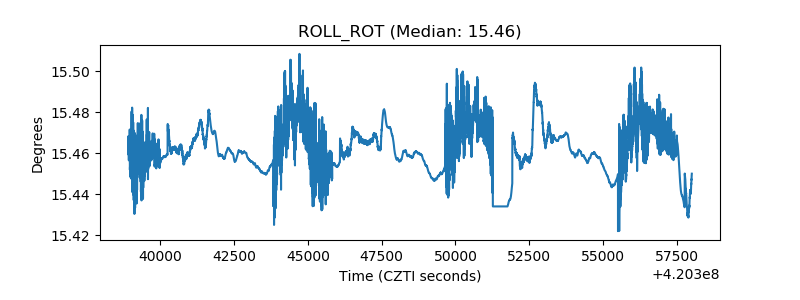 |
| _Roll_DEC | 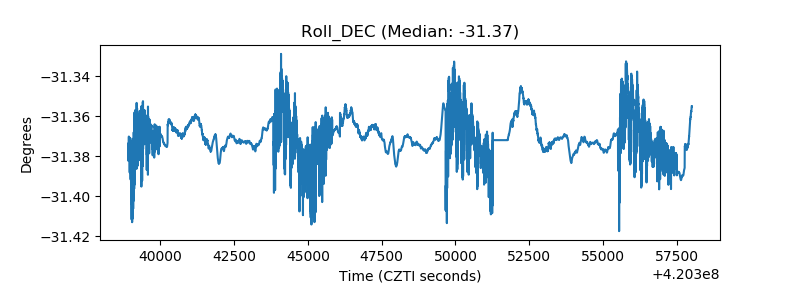 |
| _Roll_RA | 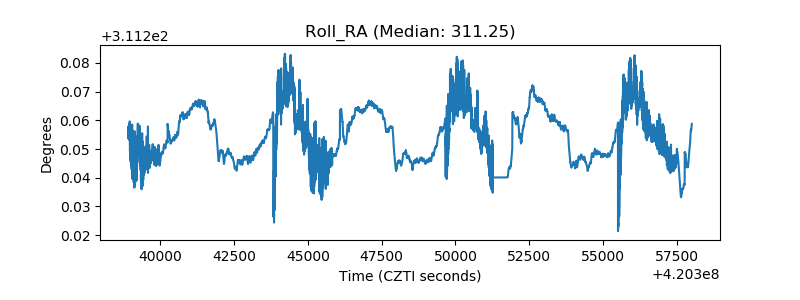 |
| Veto Counter | 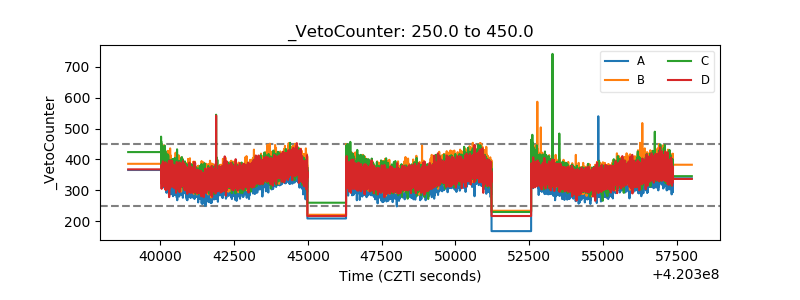 |