| Param | Original file | Final file |
|---|---|---|
| Filename | modeM0/AS1A12_066T01_9000005584_40992cztM0_level2.fits | modeM0/AS1A12_066T01_9000005584_40992cztM0_level2_quad_clean.evt |
| Size (bytes) | 637,076,160 | 174,467,520 |
| Size | 607.6 MB | 166.4 MB |
| Events in quadrant A | 5,676,902 | 1,181,641 |
| Events in quadrant B | 4,908,732 | 1,196,544 |
| Events in quadrant C | 5,678,833 | 1,130,642 |
| Events in quadrant D | 6,484,671 | 1,029,885 |
| Mode SS | |||
|---|---|---|---|
| Quadrant | BADHDUFLAG | Total packets | Discarded packets |
| A | 0 | 222 | 0 |
| B | 0 | 222 | 0 |
| C | 0 | 222 | 0 |
| D | 0 | 222 | 0 |
| Mode M0 | |||
|---|---|---|---|
| Quadrant | BADHDUFLAG | Total packets | Discarded packets |
| A | 0 | 22897 | 4 |
| B | 0 | 22038 | 3 |
| C | 0 | 23553 | 3 |
| D | 0 | 26683 | 3 |
| Mode M9 | |||
|---|---|---|---|
| Quadrant | BADHDUFLAG | Total packets | Discarded packets |
| A | 0 | 47 | 0 |
| B | 0 | 47 | 0 |
| C | 0 | 47 | 0 |
| D | 0 | 47 | 0 |
| Quadrant | Total seconds | Saturated seconds | Saturation percentage |
|---|---|---|---|
| A | 10739 | 18 | 0.167613% |
| B | 10739 | 29 | 0.270044% |
| C | 10739 | 183 | 1.704069% |
| D | 10739 | 359 | 3.342956% |
Noise dominated data is calculated using 1-second bins in cleaned event files. If a bin has >2000 counts, and if more than 50% of those come from <1% of pixels, then it is considered to be noise-dominated and hence unusable.
| Quadrant | # 1 sec bins | Bins with >0 counts | Bins with >2000 counts | High rate bins dominated by noise | Noise dominated (total time) | Noise dominated (detector-on time) | Marked lightcurve |
|---|---|---|---|---|---|---|---|
| A | 15486 | 10742 | 6 | 6 | 0.04% | 0.06% | 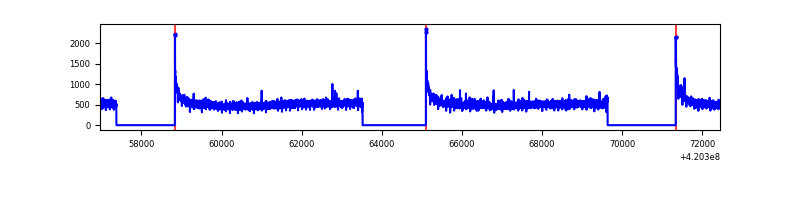 |
| B | 15486 | 10742 | 10 | 10 | 0.06% | 0.09% | 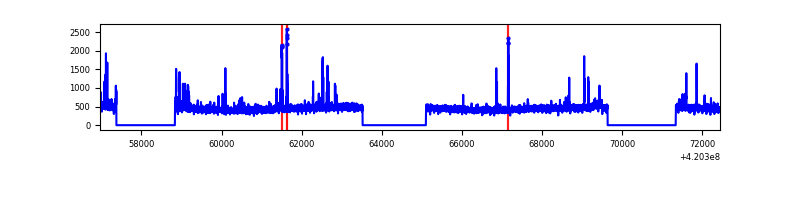 |
| C | 15486 | 10742 | 168 | 168 | 1.08% | 1.56% |  |
| D | 15486 | 10742 | 329 | 329 | 2.12% | 3.06% | 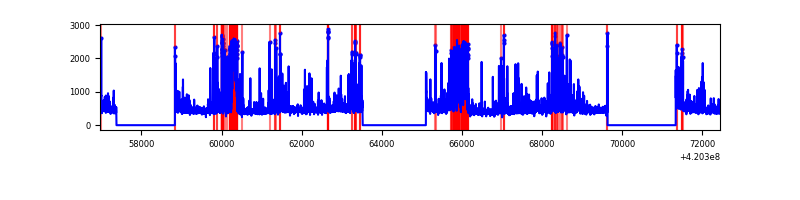 |
Top three noisy pixels from each quadrant. If the there are fewer than three noisy pixels in the level2.evt file, extra rows are filled as -1
| Pixel properties | Quadrant properties | ||||||
|---|---|---|---|---|---|---|---|
| Quadrant | DetID | PixID | Counts | Sigma | Mean | Median | Sigma |
| A | 10 | 83 | 906493 | 3649.84 | 1213 | 1188 | 248.0 |
| A | 12 | 189 | 69768 | 276.49 | 1213 | 1188 | 248.0 |
| A | 13 | 254 | 17421 | 65.44 | 1213 | 1188 | 248.0 |
| B | 5 | 255 | 150693 | 643.14 | 1193 | 1161 | 232.5 |
| B | 0 | 229 | 50188 | 210.87 | 1193 | 1161 | 232.5 |
| B | 12 | 111 | 30090 | 124.42 | 1193 | 1161 | 232.5 |
| C | 15 | 214 | 453016 | 1657.41 | 1164 | 1168 | 272.6 |
| C | 14 | 254 | 375116 | 1371.67 | 1164 | 1168 | 272.6 |
| C | 0 | 10 | 163610 | 595.85 | 1164 | 1168 | 272.6 |
| D | 13 | 249 | 1219131 | 4233.7 | 1173 | 1140 | 287.7 |
| D | 12 | 233 | 220699 | 763.18 | 1173 | 1140 | 287.7 |
| D | 2 | 249 | 159543 | 550.6 | 1173 | 1140 | 287.7 |
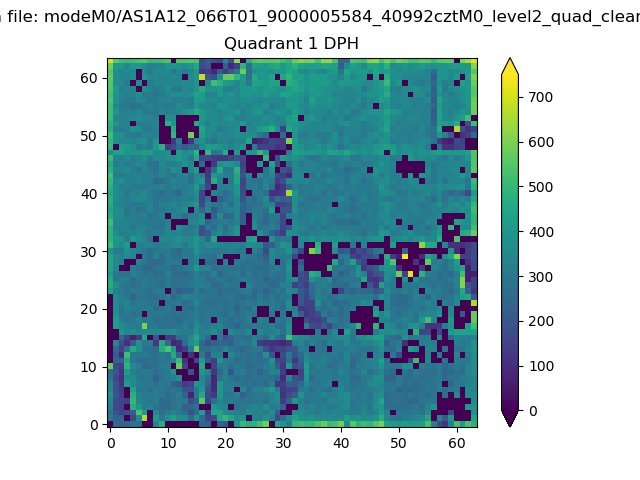
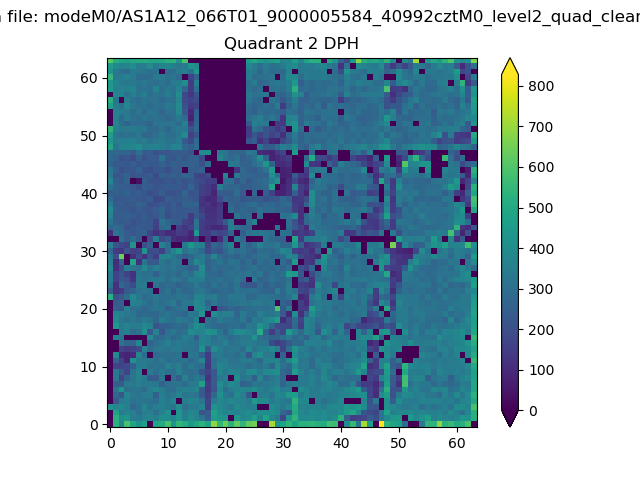
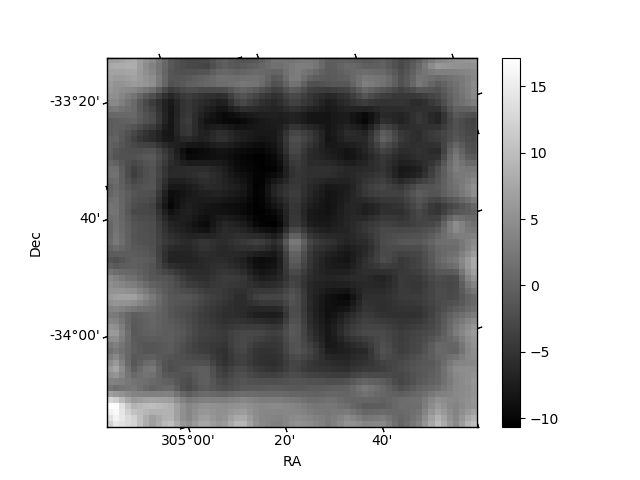
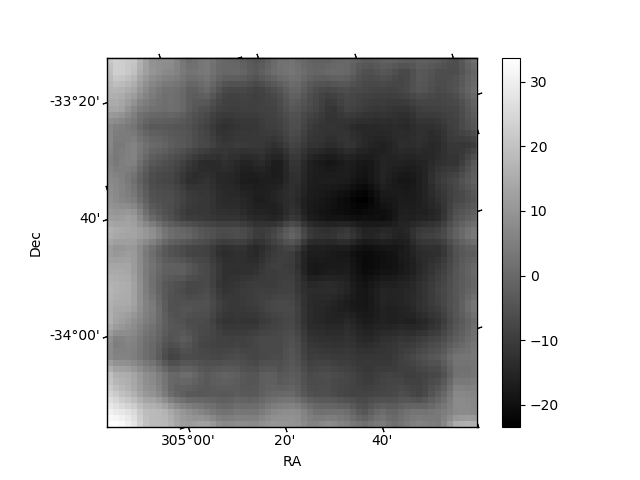
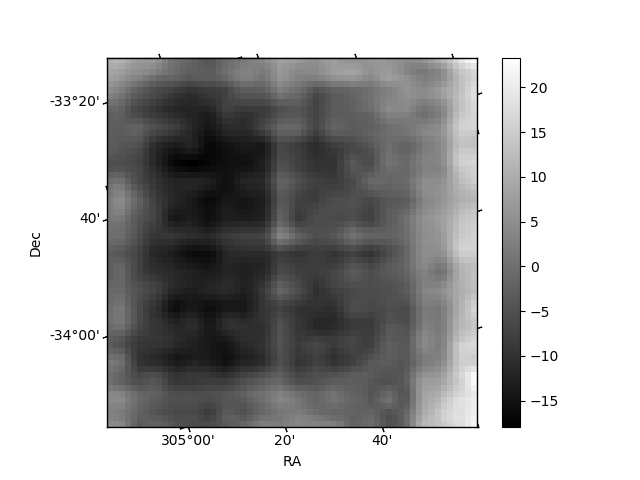
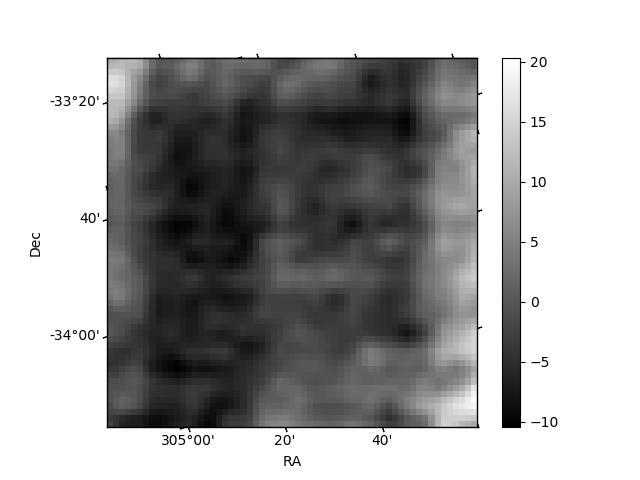
Histogram calculated using DETX and DETY for each event in the final _common_clean file
| Quadrant A | 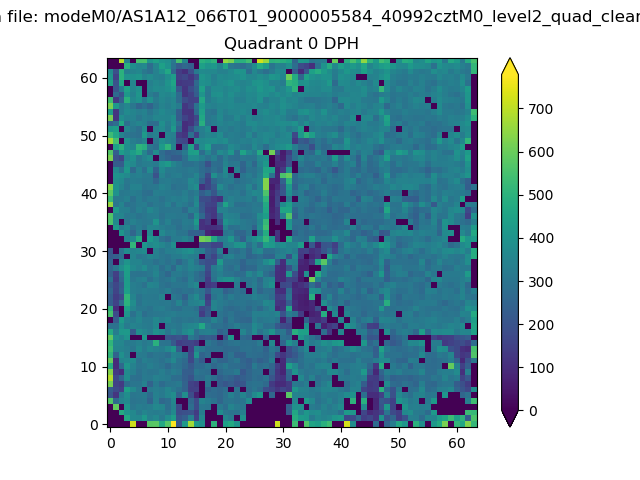 |
 |
Quadrant B |
|---|---|---|---|
| Quadrant D | 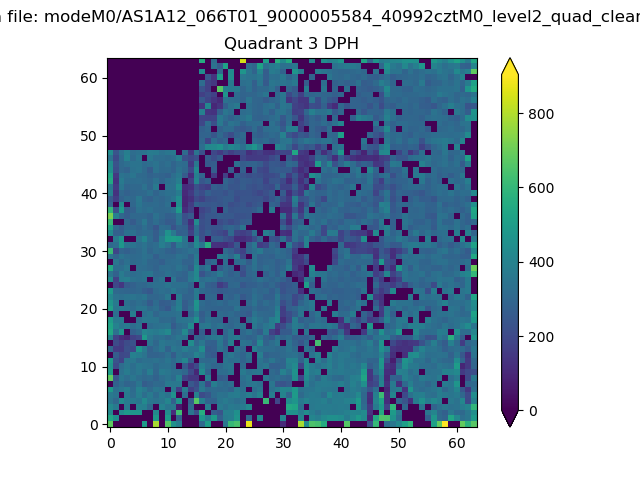 |
 |
Quadrant C |
| Plot type | Count rate plots | Images |
|---|---|---|
| Comparison with Poisson distribution Blue bars denote a histogram of data divided into 1 sec bins. Red curve is a Poisson curve with rate = median count rate of data. |
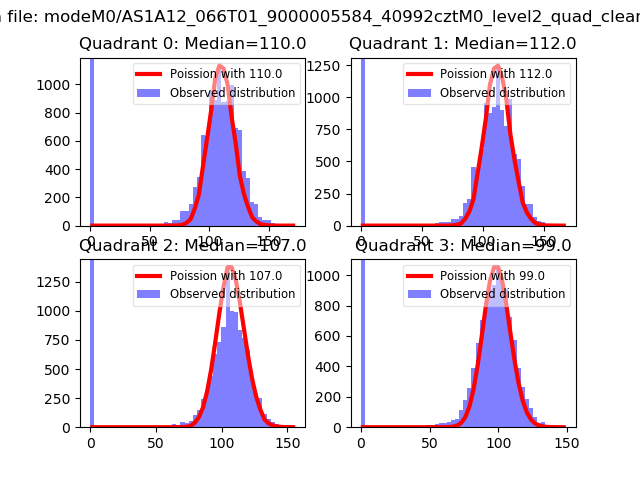 |
 |
| Quadrant-wise count rates Data is divided into 100 sec bins |
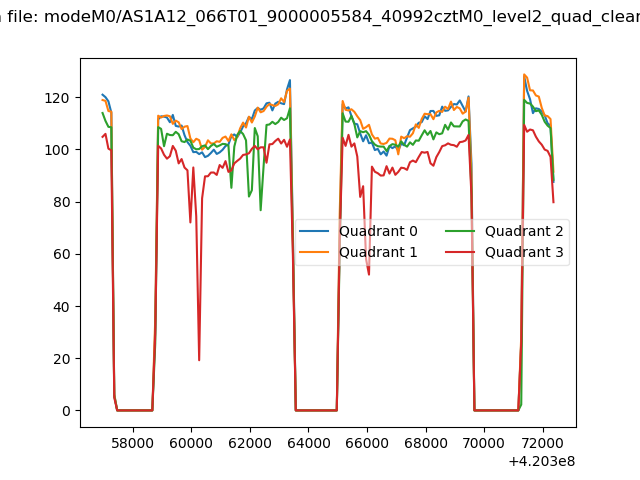 |
|
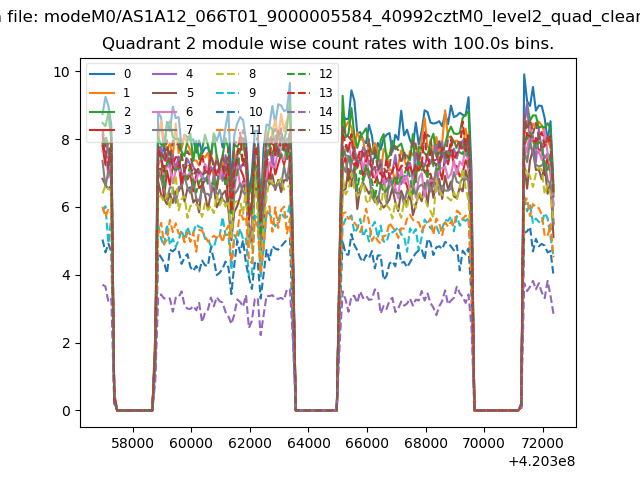
| Module-wise count rates for Quadrant A Data is divided into 100 sec bins |
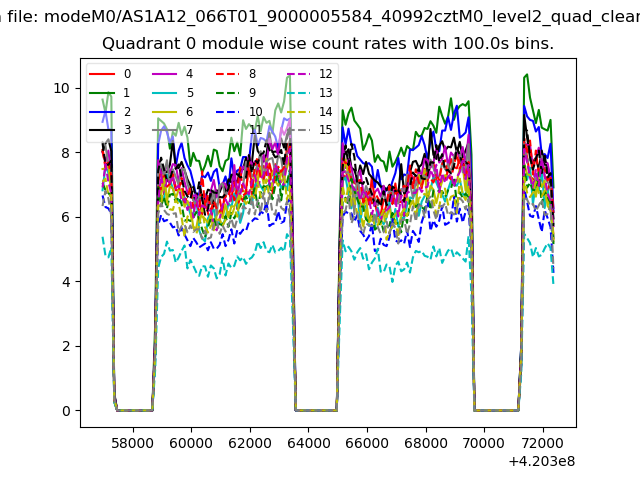 |
 |
| Module-wise count rates for Quadrant B Data is divided into 100 sec bins |
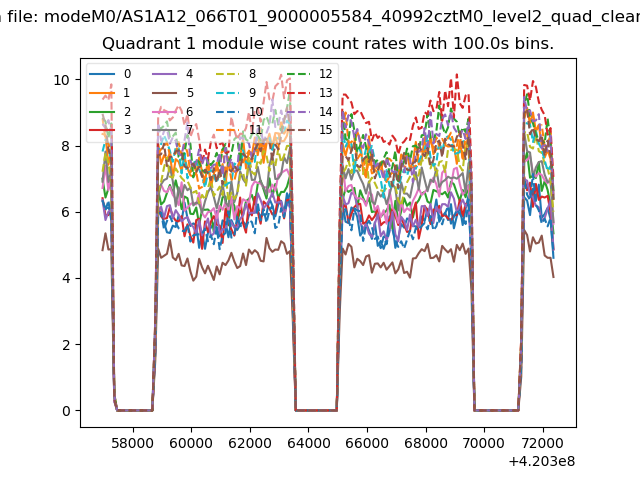 |
 |
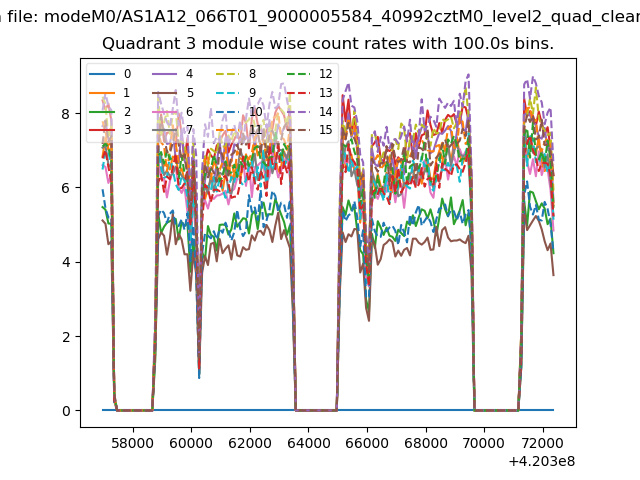
| Module-wise count rates for Quadrant C Data is divided into 100 sec bins |
 |
 |
| Module-wise count rates for Quadrant D Data is divided into 100 sec bins |
 |
 |
| Parameter | Plot |
|---|---|
| CZT HV Monitor |  |
| D_VDD | 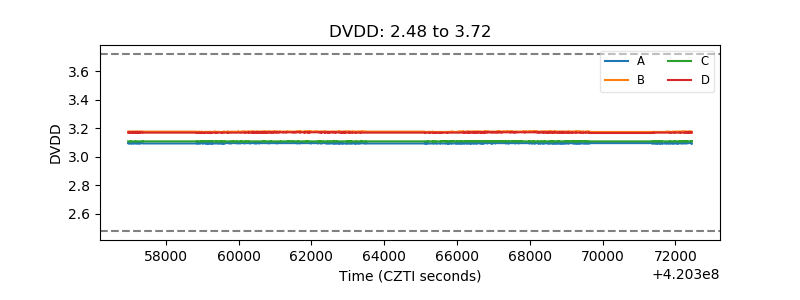 |
| Temperature 1 | 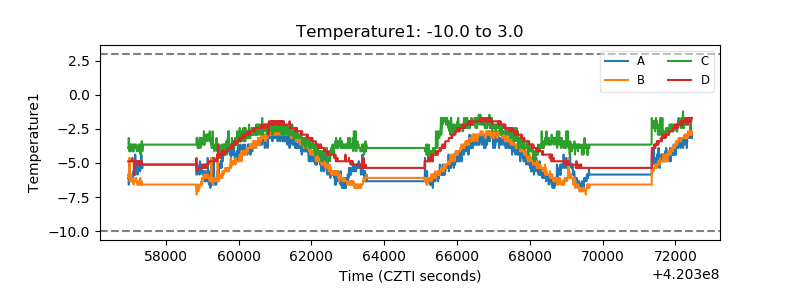 |
| Veto HV Monitor | 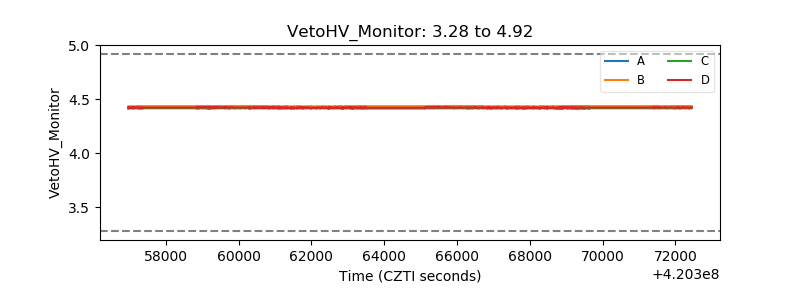 |
| Veto LLD | 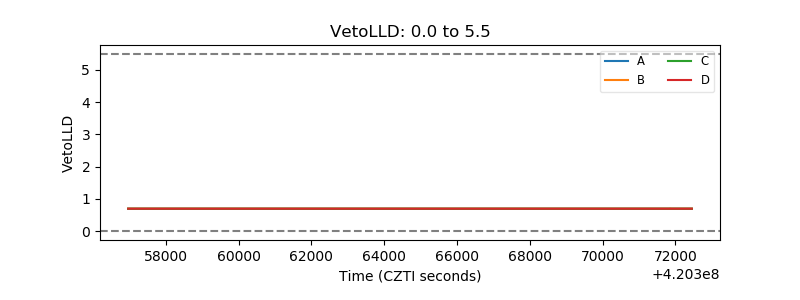 |
| Alpha Counter | 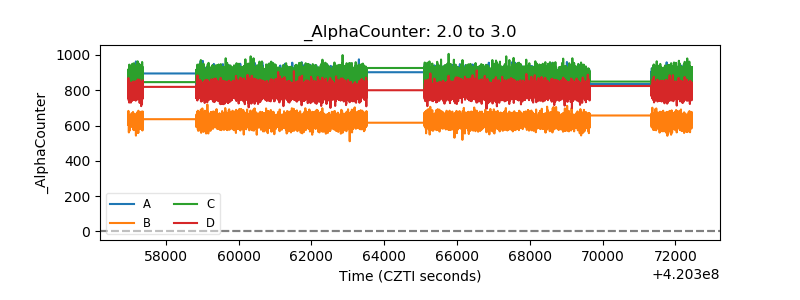 |
| _CPM_Rate |  |
| CZT Counter |  |
| +2.5 Volts monitor | 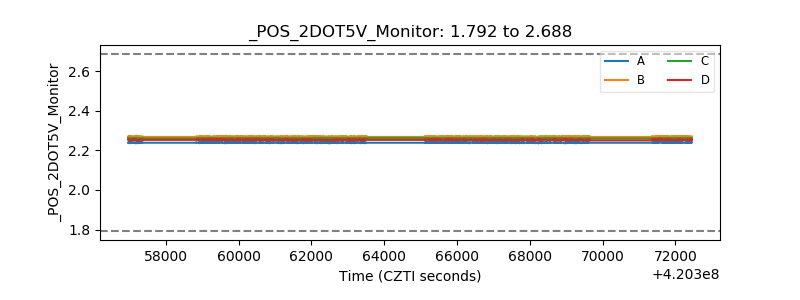 |
| +5 Volts monitor | 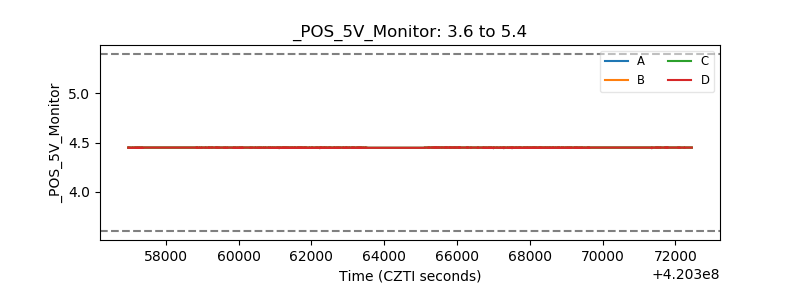 |
| _ROLL_ROT | 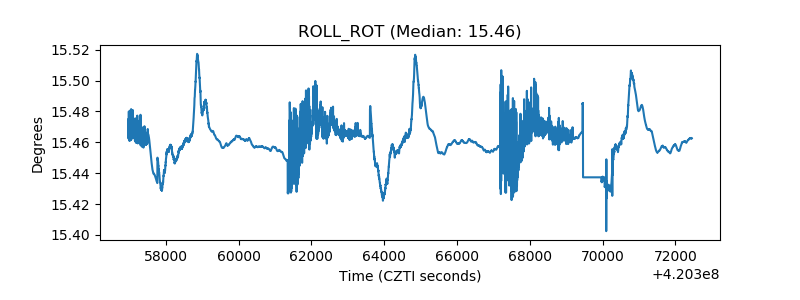 |
| _Roll_DEC | 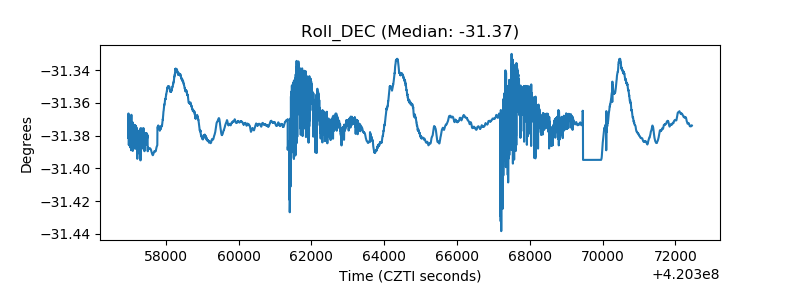 |
| _Roll_RA |  |
| Veto Counter | 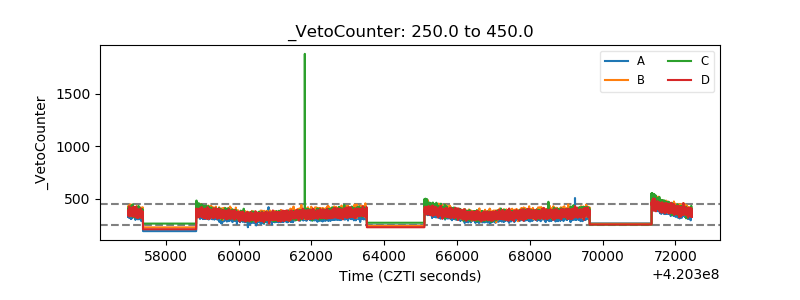 |