| Param | Original file | Final file |
|---|---|---|
| Filename | modeM0/AS1A12_066T01_9000005584_40994cztM0_level2.fits | modeM0/AS1A12_066T01_9000005584_40994cztM0_level2_quad_clean.evt |
| Size (bytes) | 323,110,080 | 93,044,160 |
| Size | 308.1 MB | 88.7 MB |
| Events in quadrant A | 3,012,276 | 630,331 |
| Events in quadrant B | 2,493,296 | 644,092 |
| Events in quadrant C | 2,859,059 | 603,095 |
| Events in quadrant D | 3,171,070 | 558,629 |
| Mode SS | |||
|---|---|---|---|
| Quadrant | BADHDUFLAG | Total packets | Discarded packets |
| A | 0 | 110 | 0 |
| B | 0 | 110 | 0 |
| C | 0 | 110 | 0 |
| D | 0 | 110 | 0 |
| Mode M0 | |||
|---|---|---|---|
| Quadrant | BADHDUFLAG | Total packets | Discarded packets |
| A | 0 | 12074 | 3 |
| B | 0 | 11047 | 2 |
| C | 0 | 11819 | 2 |
| D | 0 | 13174 | 2 |
| Mode M9 | |||
|---|---|---|---|
| Quadrant | BADHDUFLAG | Total packets | Discarded packets |
| A | 0 | 23 | 0 |
| B | 0 | 23 | 0 |
| C | 0 | 23 | 0 |
| D | 0 | 24 | 0 |
| Quadrant | Total seconds | Saturated seconds | Saturation percentage |
|---|---|---|---|
| A | 5451 | 15 | 0.275179% |
| B | 5451 | 13 | 0.238488% |
| C | 5451 | 80 | 1.467621% |
| D | 5451 | 150 | 2.751789% |
Noise dominated data is calculated using 1-second bins in cleaned event files. If a bin has >2000 counts, and if more than 50% of those come from <1% of pixels, then it is considered to be noise-dominated and hence unusable.
| Quadrant | # 1 sec bins | Bins with >0 counts | Bins with >2000 counts | High rate bins dominated by noise | Noise dominated (total time) | Noise dominated (detector-on time) | Marked lightcurve |
|---|---|---|---|---|---|---|---|
| A | 7274 | 5452 | 4 | 4 | 0.05% | 0.07% | 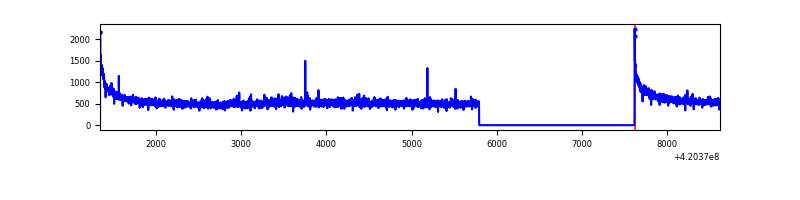 |
| B | 7274 | 5452 | 1 | 1 | 0.01% | 0.02% | 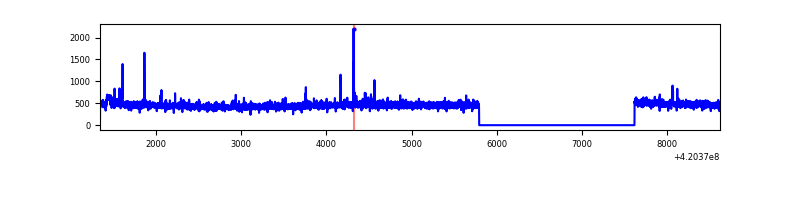 |
| C | 7274 | 5452 | 79 | 79 | 1.09% | 1.45% | 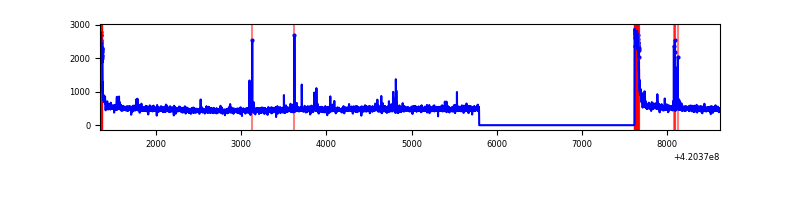 |
| D | 7274 | 5452 | 130 | 130 | 1.79% | 2.38% | 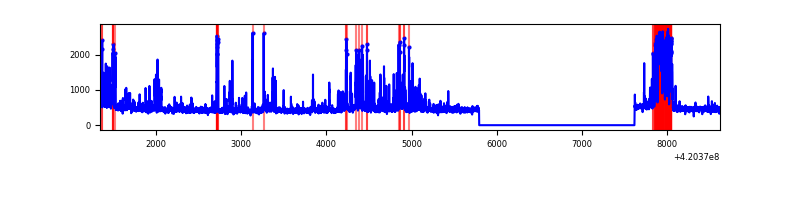 |
Top three noisy pixels from each quadrant. If the there are fewer than three noisy pixels in the level2.evt file, extra rows are filled as -1
| Pixel properties | Quadrant properties | ||||||
|---|---|---|---|---|---|---|---|
| Quadrant | DetID | PixID | Counts | Sigma | Mean | Median | Sigma |
| A | 10 | 83 | 509540 | 3918.36 | 630 | 617 | 129.9 |
| A | 12 | 189 | 64056 | 488.44 | 630 | 617 | 129.9 |
| A | 13 | 254 | 8328 | 59.37 | 630 | 617 | 129.9 |
| B | 5 | 255 | 33822 | 272.75 | 620 | 603 | 121.8 |
| B | 0 | 229 | 16928 | 134.04 | 620 | 603 | 121.8 |
| B | 12 | 111 | 15351 | 121.09 | 620 | 603 | 121.8 |
| C | 15 | 214 | 232952 | 1648.22 | 603 | 606 | 141.0 |
| C | 0 | 10 | 201724 | 1426.69 | 603 | 606 | 141.0 |
| C | 12 | 249 | 34524 | 240.61 | 603 | 606 | 141.0 |
| D | 2 | 249 | 300168 | 2011.27 | 607 | 590 | 148.9 |
| D | 13 | 249 | 255712 | 1712.81 | 607 | 590 | 148.9 |
| D | 12 | 233 | 135395 | 905.04 | 607 | 590 | 148.9 |
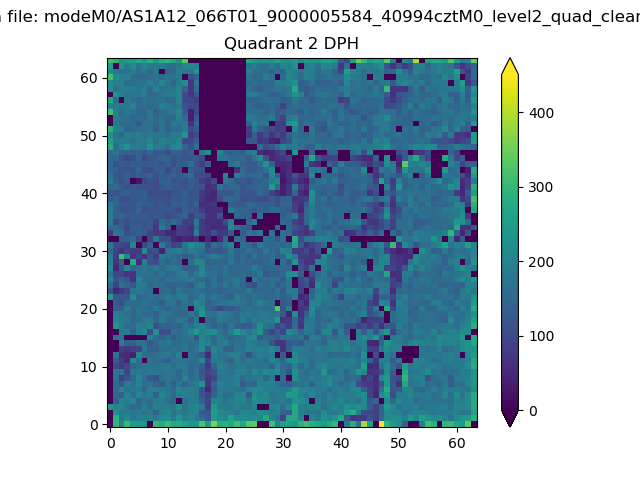
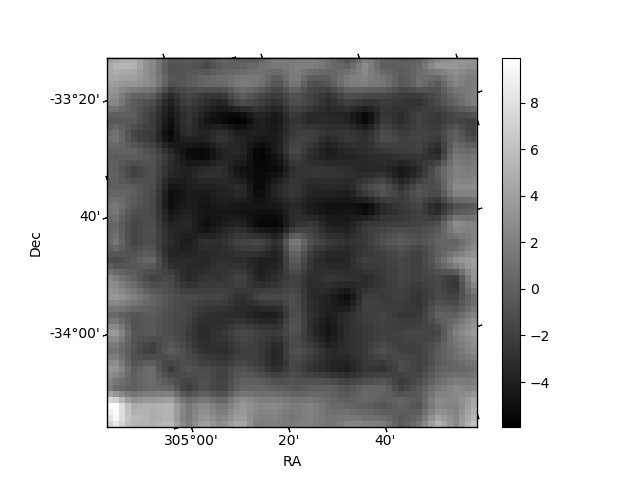
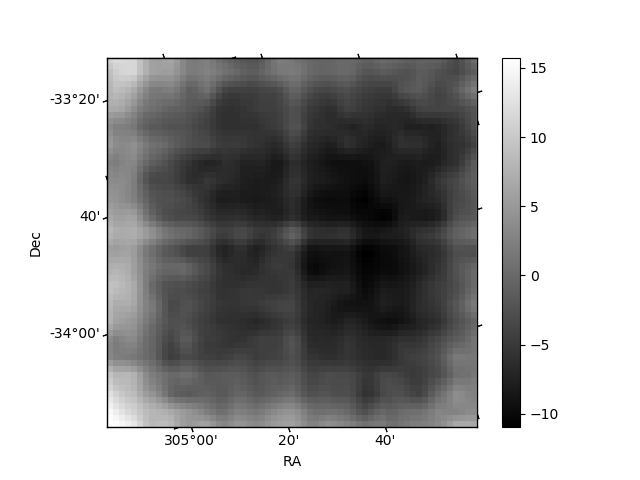
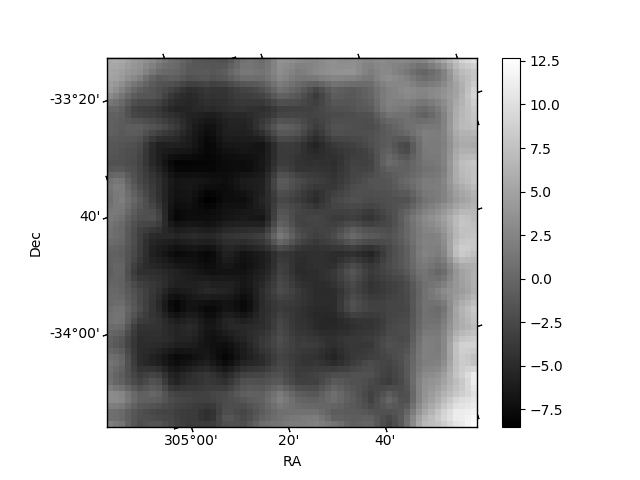
Histogram calculated using DETX and DETY for each event in the final _common_clean file
| Quadrant A | 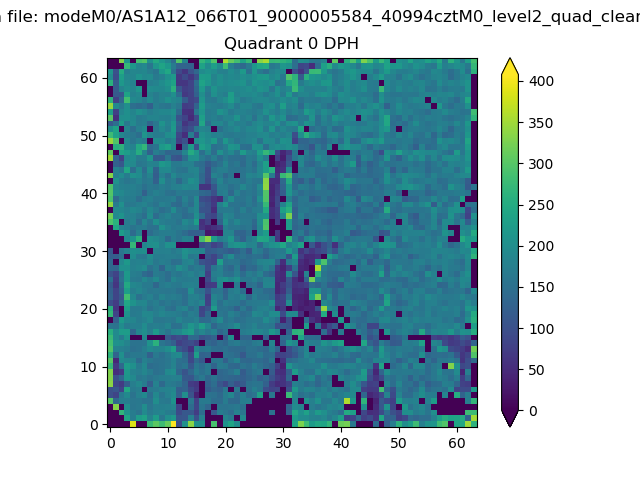 |
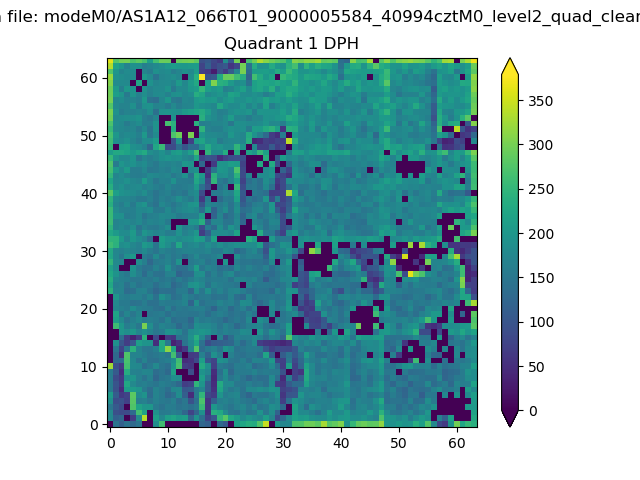 |
Quadrant B |
|---|---|---|---|
| Quadrant D | 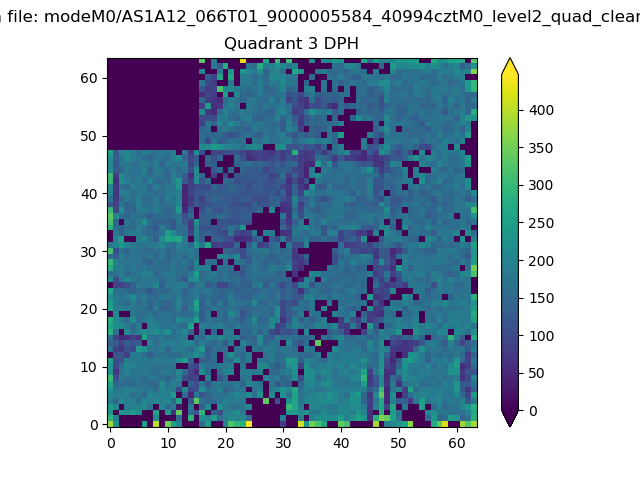 |
 |
Quadrant C |
| Plot type | Count rate plots | Images |
|---|---|---|
| Comparison with Poisson distribution Blue bars denote a histogram of data divided into 1 sec bins. Red curve is a Poisson curve with rate = median count rate of data. |
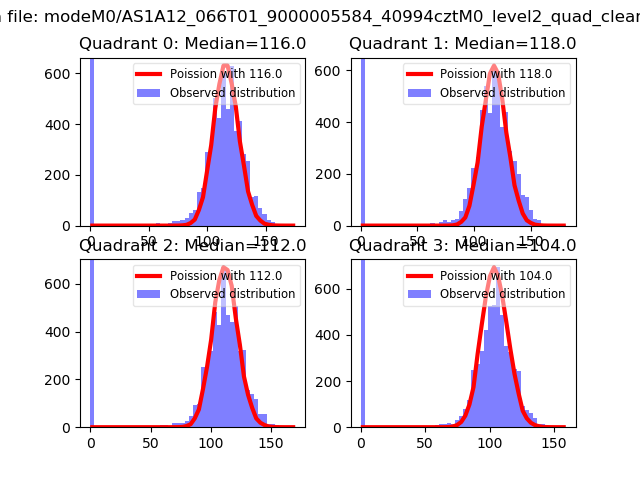 |
 |
| Quadrant-wise count rates Data is divided into 100 sec bins |
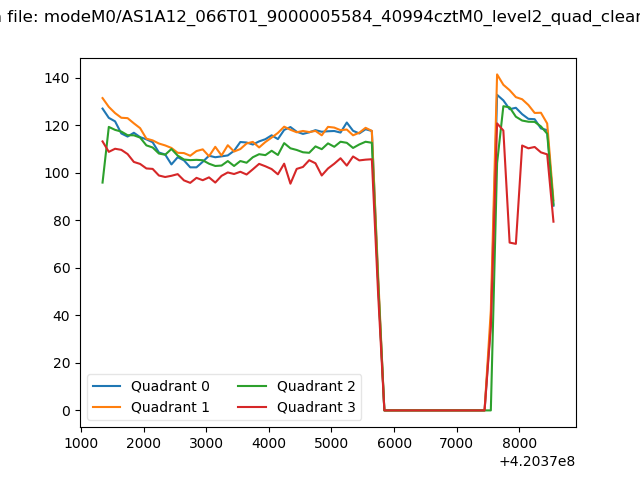 |
|
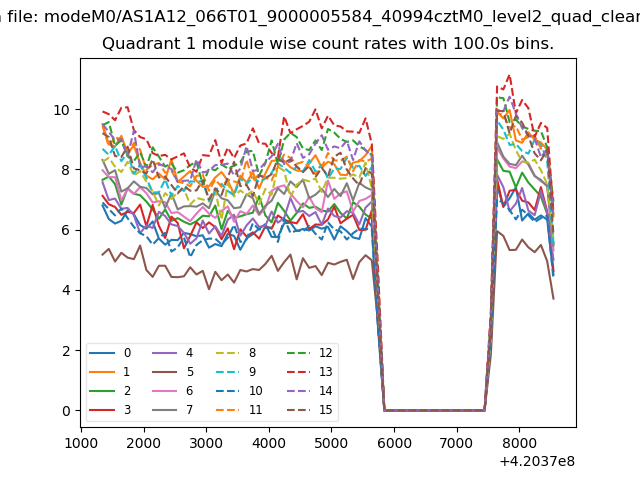
| Module-wise count rates for Quadrant A Data is divided into 100 sec bins |
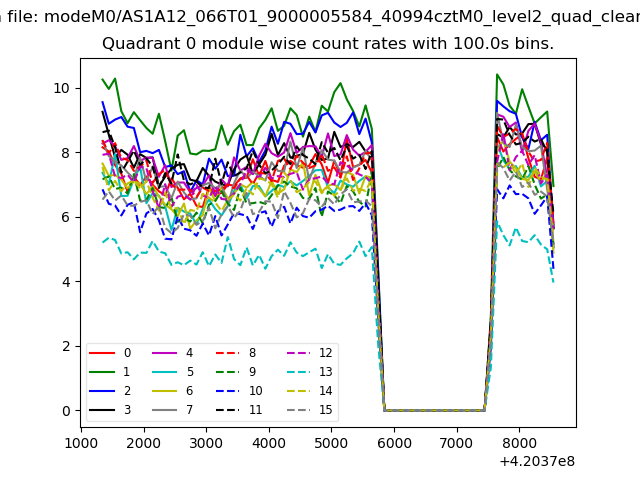 |
 |
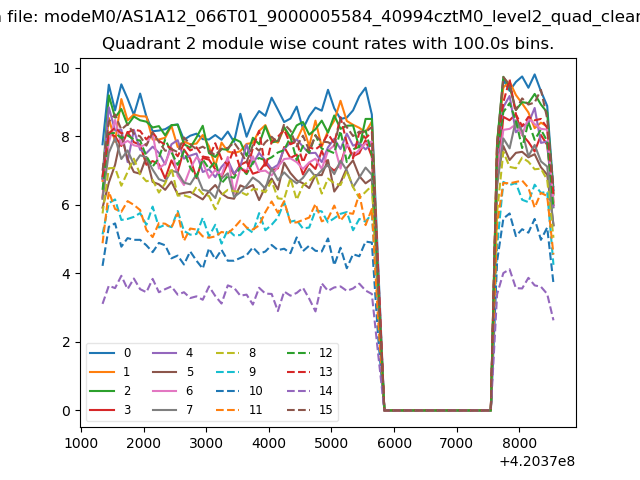
| Module-wise count rates for Quadrant B Data is divided into 100 sec bins |
 |
 |
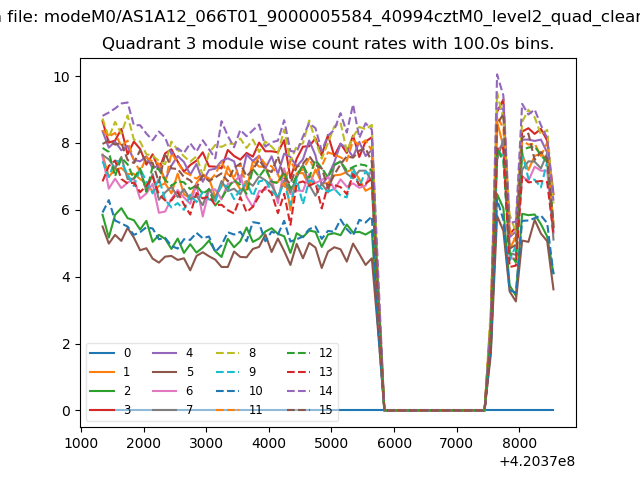
| Module-wise count rates for Quadrant C Data is divided into 100 sec bins |
 |
 |
| Module-wise count rates for Quadrant D Data is divided into 100 sec bins |
 |
 |
| Parameter | Plot |
|---|---|
| CZT HV Monitor | 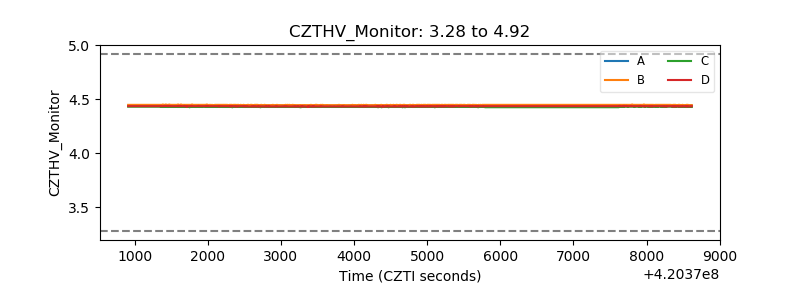 |
| D_VDD | 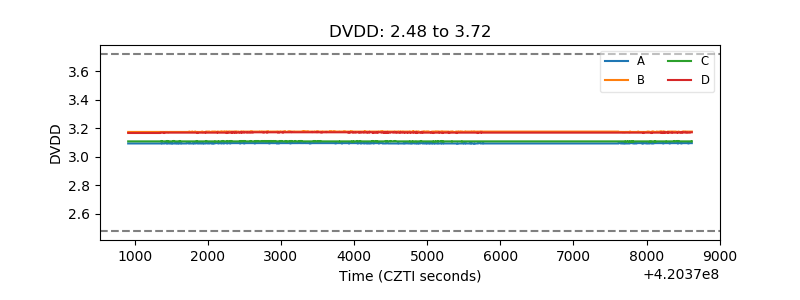 |
| Temperature 1 | 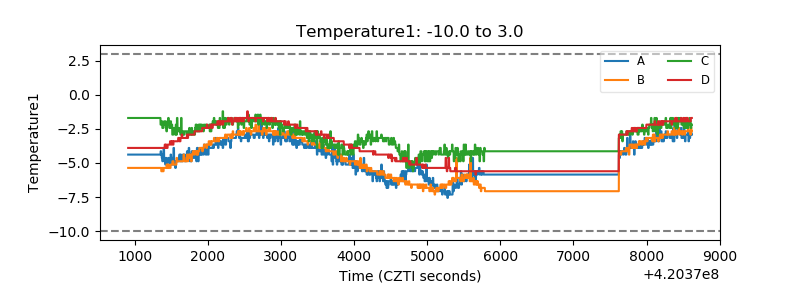 |
| Veto HV Monitor | 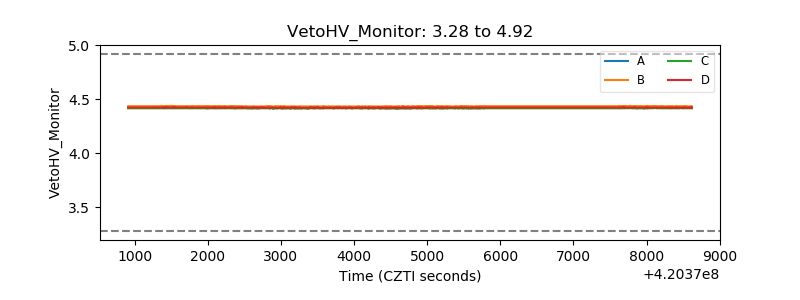 |
| Veto LLD | 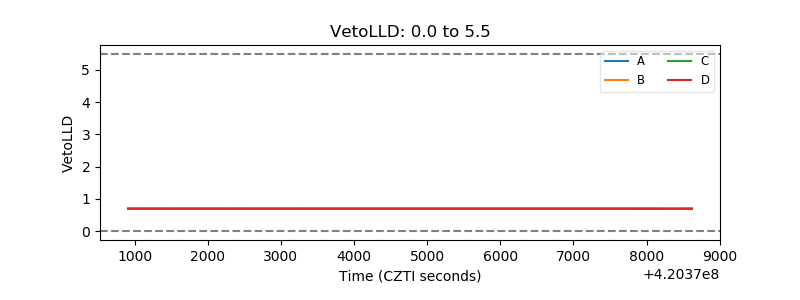 |
| Alpha Counter |  |
| _CPM_Rate | 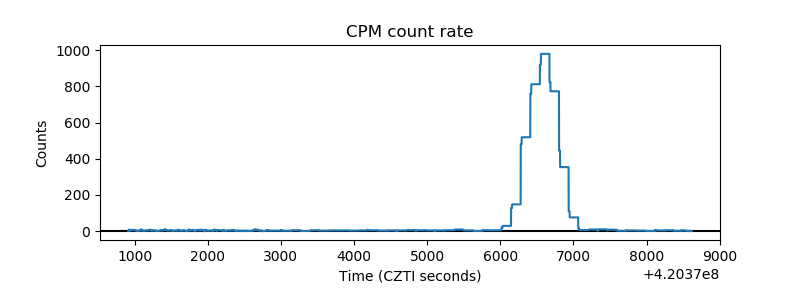 |
| CZT Counter |  |
| +2.5 Volts monitor | 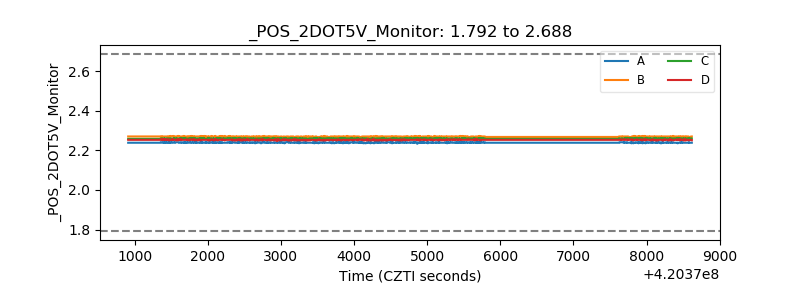 |
| +5 Volts monitor | 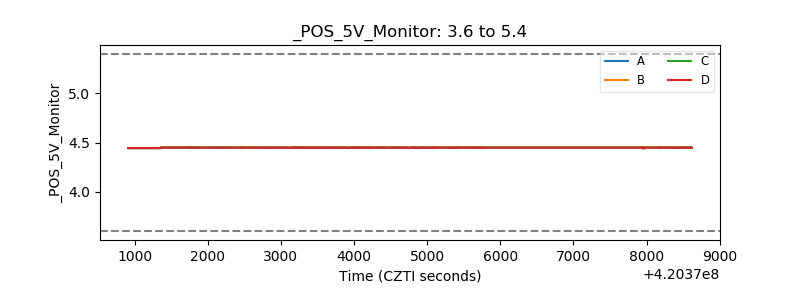 |
| _ROLL_ROT | 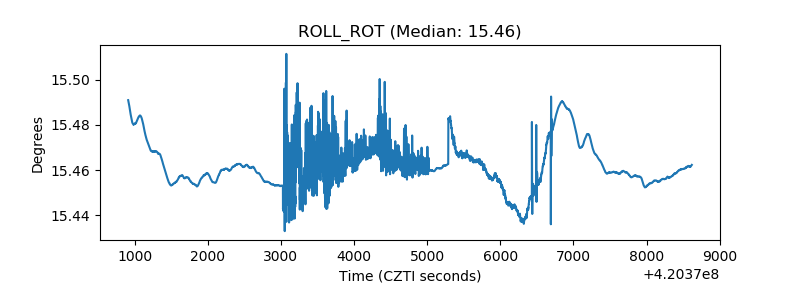 |
| _Roll_DEC | 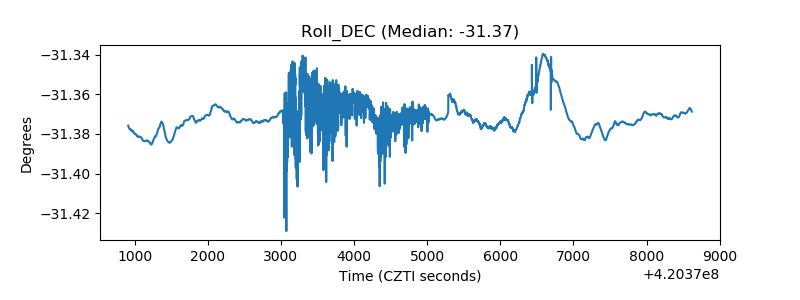 |
| _Roll_RA |  |
| Veto Counter | 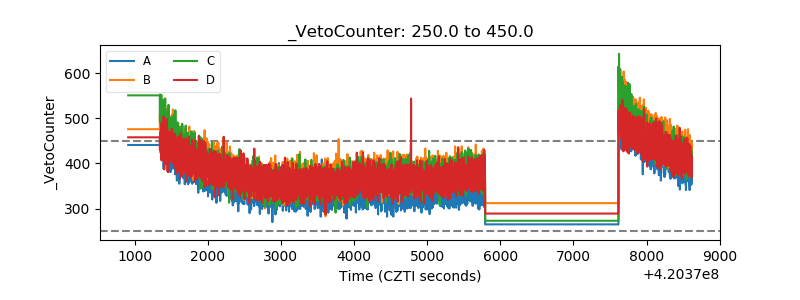 |