| Param | Original file | Final file |
|---|---|---|
| Filename | modeM0/AS1A12_066T01_9000005584_40996cztM0_level2.fits | modeM0/AS1A12_066T01_9000005584_40996cztM0_level2_quad_clean.evt |
| Size (bytes) | 313,125,120 | 92,741,760 |
| Size | 298.6 MB | 88.4 MB |
| Events in quadrant A | 2,962,203 | 639,474 |
| Events in quadrant B | 2,567,278 | 649,115 |
| Events in quadrant C | 2,719,810 | 601,080 |
| Events in quadrant D | 2,946,327 | 563,123 |
| Mode SS | |||
|---|---|---|---|
| Quadrant | BADHDUFLAG | Total packets | Discarded packets |
| A | 0 | 104 | 0 |
| B | 0 | 104 | 0 |
| C | 0 | 104 | 0 |
| D | 0 | 104 | 0 |
| Mode M0 | |||
|---|---|---|---|
| Quadrant | BADHDUFLAG | Total packets | Discarded packets |
| A | 0 | 11935 | 3 |
| B | 0 | 10750 | 2 |
| C | 0 | 10935 | 2 |
| D | 0 | 12027 | 2 |
| Mode M9 | |||
|---|---|---|---|
| Quadrant | BADHDUFLAG | Total packets | Discarded packets |
| A | 0 | 29 | 0 |
| B | 0 | 29 | 0 |
| C | 0 | 29 | 0 |
| D | 0 | 30 | 0 |
| Quadrant | Total seconds | Saturated seconds | Saturation percentage |
|---|---|---|---|
| A | 5072 | 14 | 0.276025% |
| B | 5072 | 40 | 0.788644% |
| C | 5072 | 70 | 1.380126% |
| D | 5072 | 109 | 2.149054% |
Noise dominated data is calculated using 1-second bins in cleaned event files. If a bin has >2000 counts, and if more than 50% of those come from <1% of pixels, then it is considered to be noise-dominated and hence unusable.
| Quadrant | # 1 sec bins | Bins with >0 counts | Bins with >2000 counts | High rate bins dominated by noise | Noise dominated (total time) | Noise dominated (detector-on time) | Marked lightcurve |
|---|---|---|---|---|---|---|---|
| A | 7136 | 5073 | 4 | 4 | 0.06% | 0.08% | 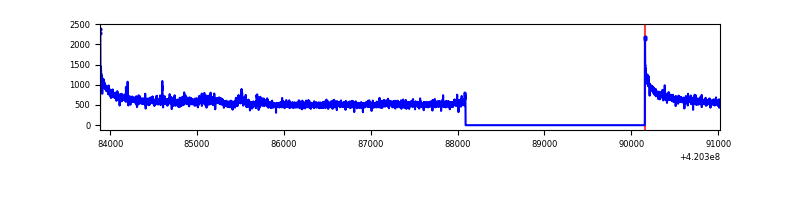 |
| B | 7136 | 5073 | 22 | 22 | 0.31% | 0.43% | 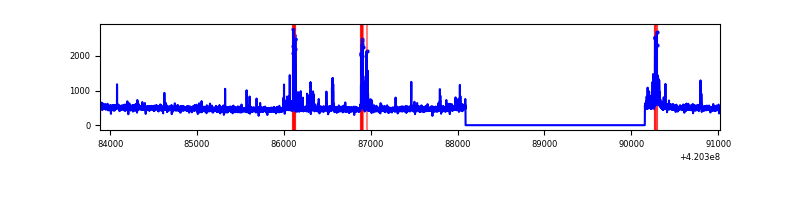 |
| C | 7136 | 5073 | 66 | 66 | 0.92% | 1.30% | 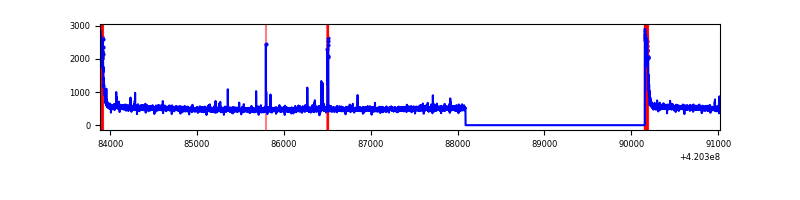 |
| D | 7136 | 5073 | 110 | 110 | 1.54% | 2.17% | 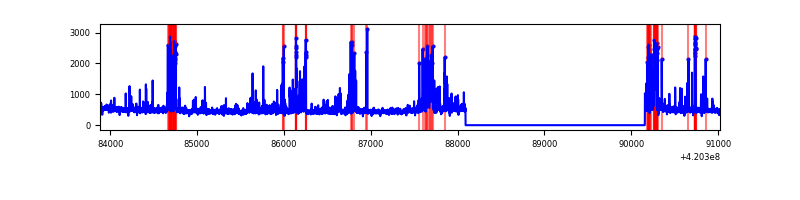 |
Top three noisy pixels from each quadrant. If the there are fewer than three noisy pixels in the level2.evt file, extra rows are filled as -1
| Pixel properties | Quadrant properties | ||||||
|---|---|---|---|---|---|---|---|
| Quadrant | DetID | PixID | Counts | Sigma | Mean | Median | Sigma |
| A | 10 | 83 | 489569 | 3911.91 | 614 | 604 | 125.0 |
| A | 12 | 189 | 93342 | 741.94 | 614 | 604 | 125.0 |
| A | 13 | 254 | 7855 | 58.01 | 614 | 604 | 125.0 |
| B | 5 | 255 | 185122 | 1591.08 | 605 | 589 | 116.0 |
| B | 12 | 111 | 14499 | 119.93 | 605 | 589 | 116.0 |
| B | 11 | 111 | 13427 | 110.69 | 605 | 589 | 116.0 |
| C | 15 | 214 | 219292 | 1623.23 | 585 | 588 | 134.7 |
| C | 0 | 10 | 161932 | 1197.51 | 585 | 588 | 134.7 |
| C | 14 | 254 | 30394 | 221.22 | 585 | 588 | 134.7 |
| D | 13 | 249 | 280766 | 1971.08 | 587 | 572 | 142.2 |
| D | 12 | 233 | 133794 | 937.17 | 587 | 572 | 142.2 |
| D | 5 | 32 | 102427 | 716.52 | 587 | 572 | 142.2 |
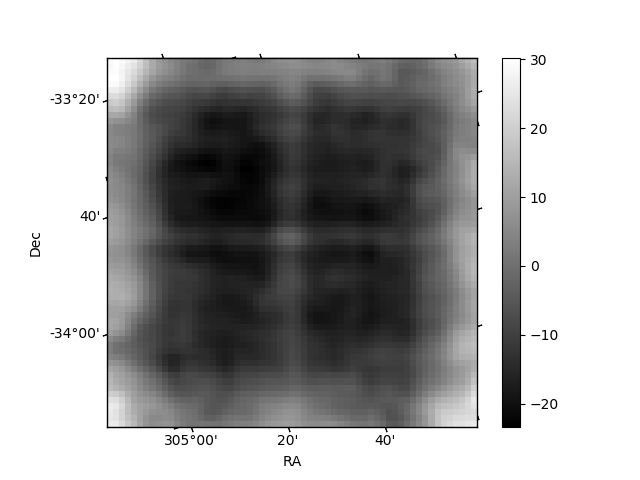
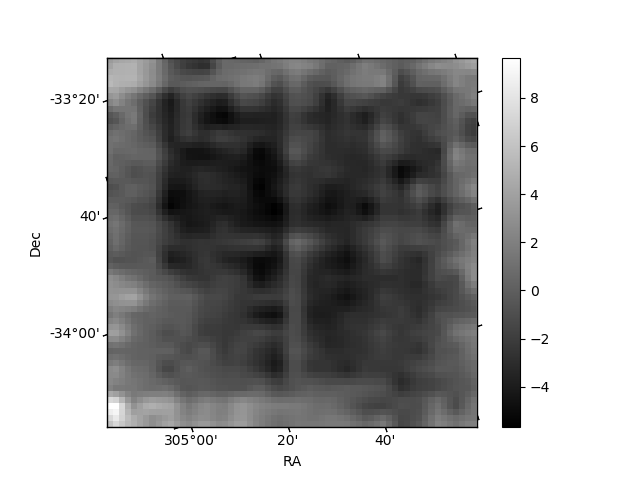
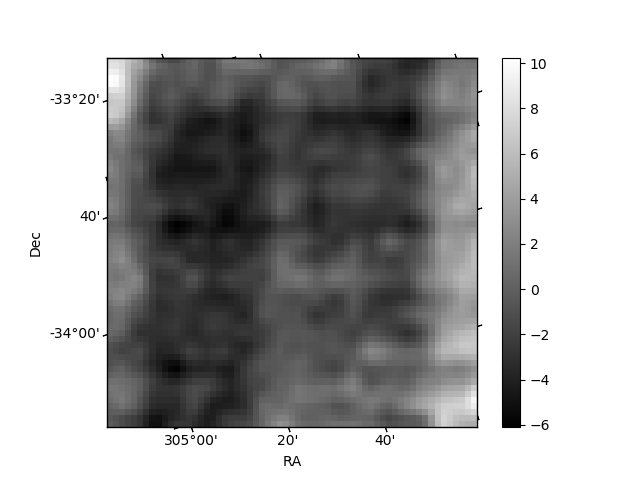
Histogram calculated using DETX and DETY for each event in the final _common_clean file
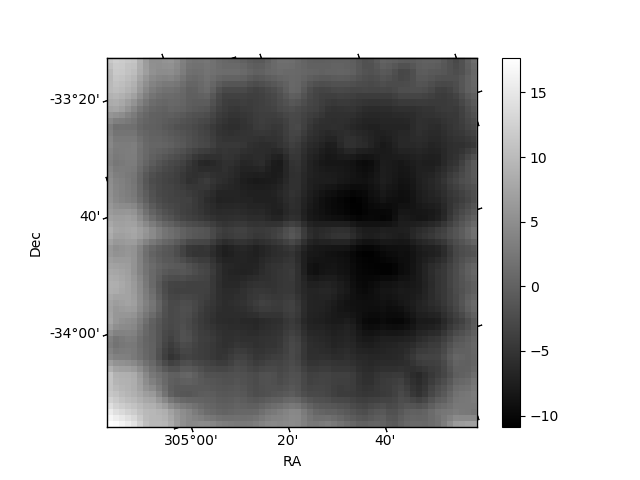
| Quadrant A | 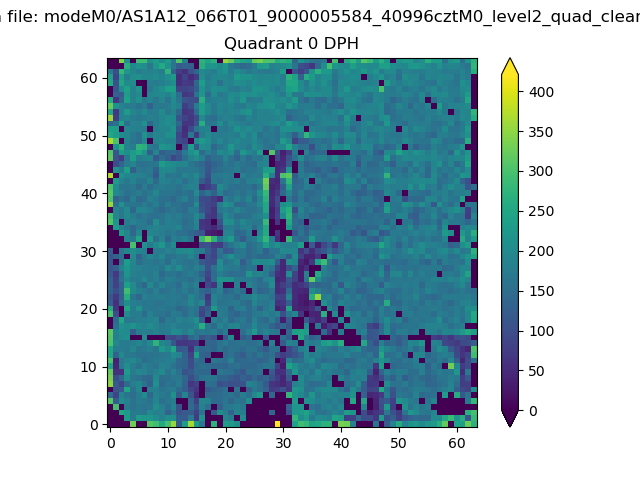 |
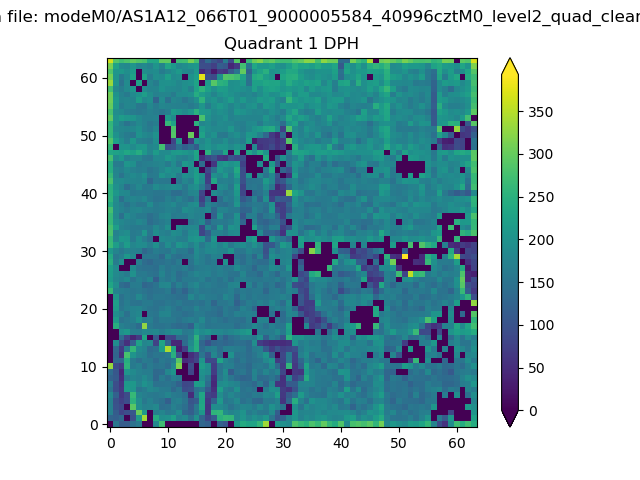 |
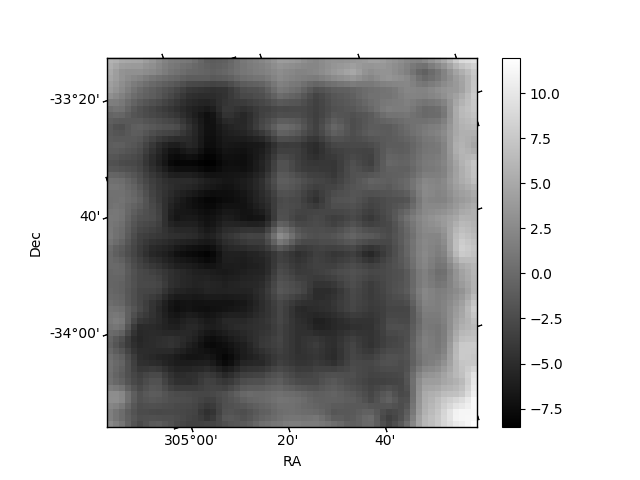
Quadrant B |
|---|---|---|---|
| Quadrant D | 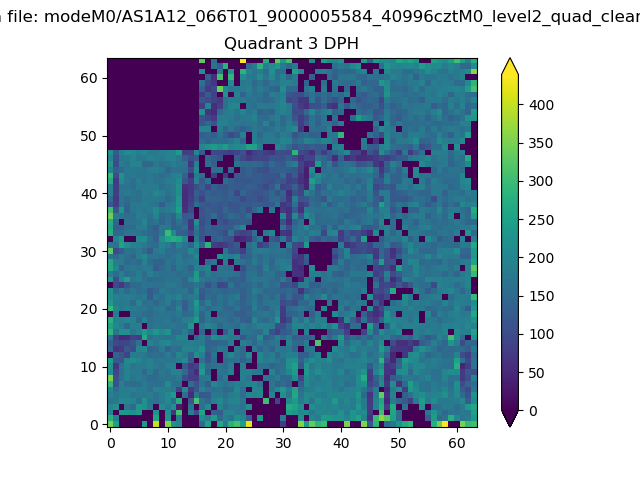 |
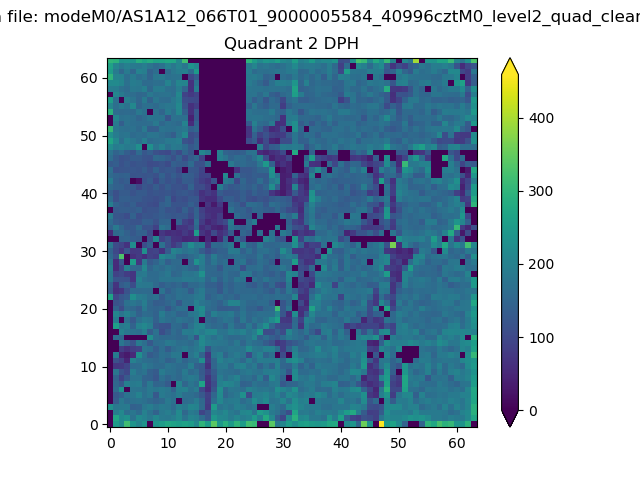 |
Quadrant C |
| Plot type | Count rate plots | Images |
|---|---|---|
| Comparison with Poisson distribution Blue bars denote a histogram of data divided into 1 sec bins. Red curve is a Poisson curve with rate = median count rate of data. |
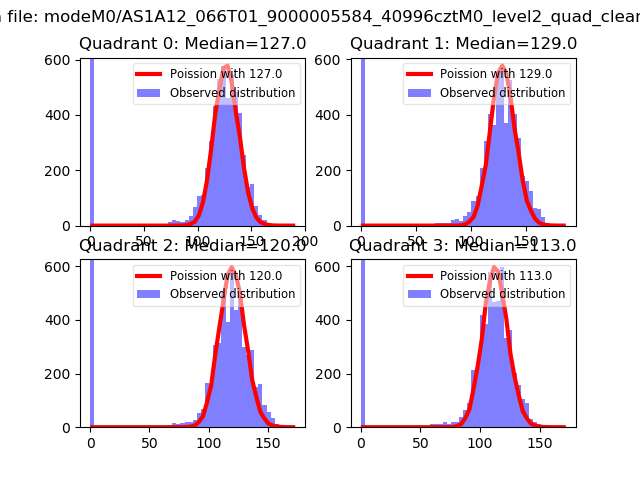 |
 |
| Quadrant-wise count rates Data is divided into 100 sec bins |
 |
|
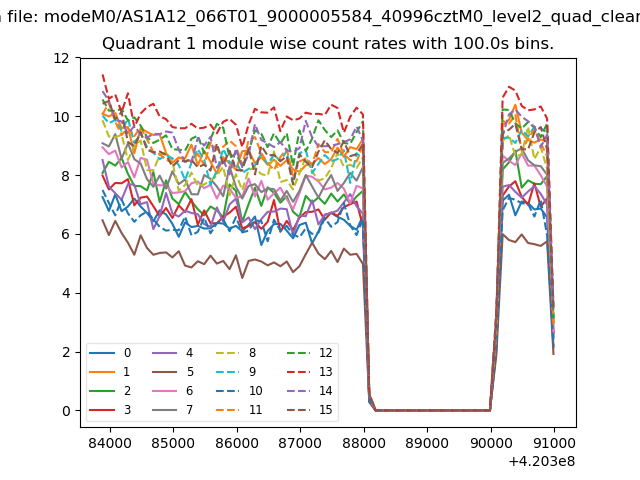
| Module-wise count rates for Quadrant A Data is divided into 100 sec bins |
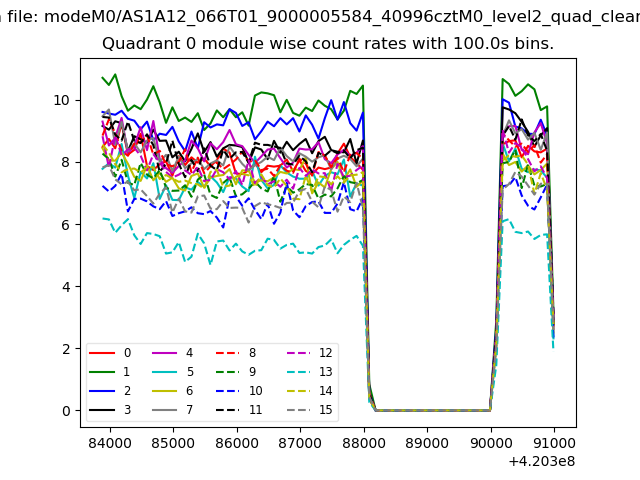 |
 |
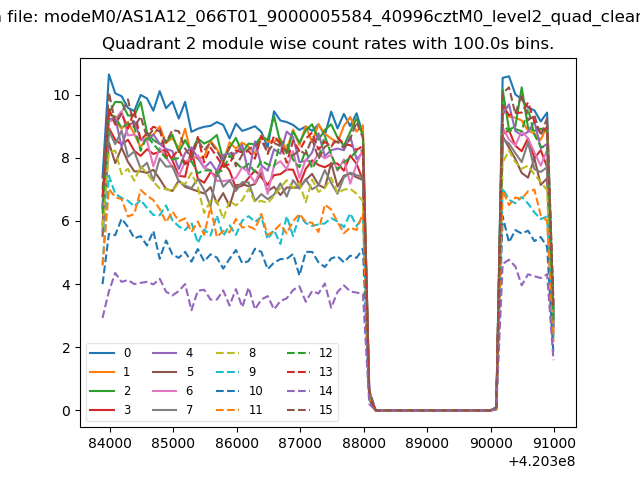
| Module-wise count rates for Quadrant B Data is divided into 100 sec bins |
 |
 |
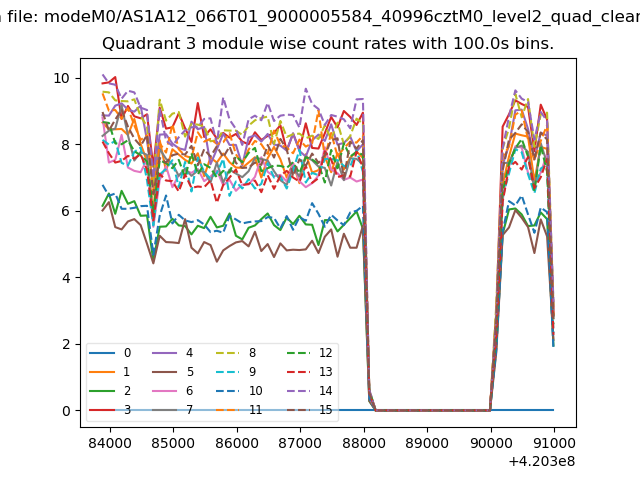
| Module-wise count rates for Quadrant C Data is divided into 100 sec bins |
 |
 |
| Module-wise count rates for Quadrant D Data is divided into 100 sec bins |
 |
 |
| Parameter | Plot |
|---|---|
| CZT HV Monitor | 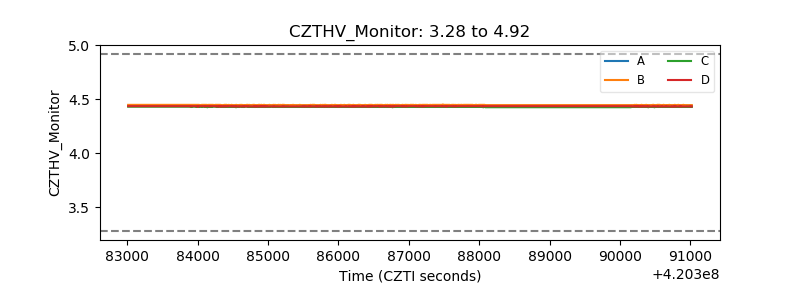 |
| D_VDD | 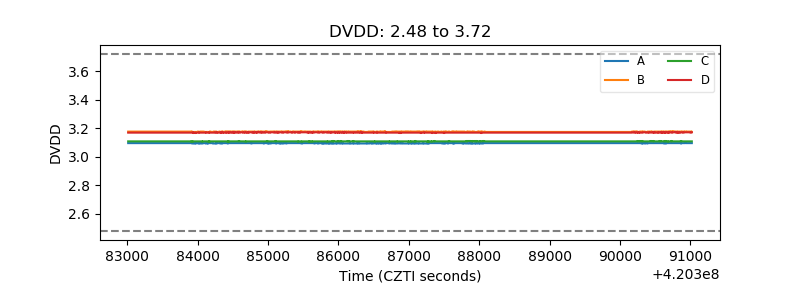 |
| Temperature 1 | 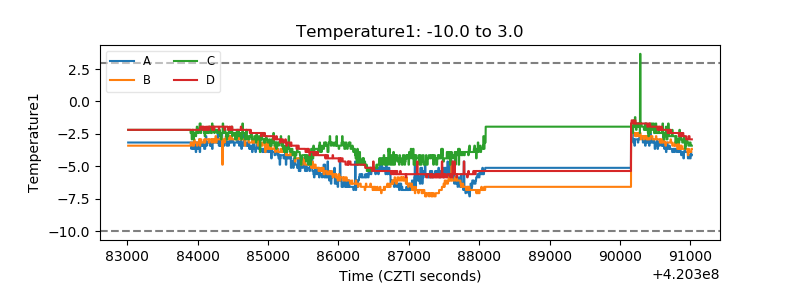 |
| Veto HV Monitor | 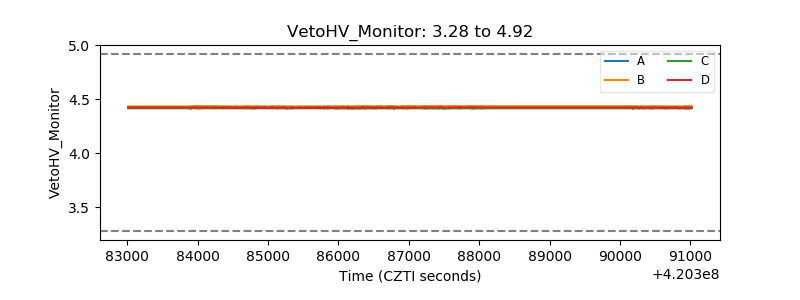 |
| Veto LLD | 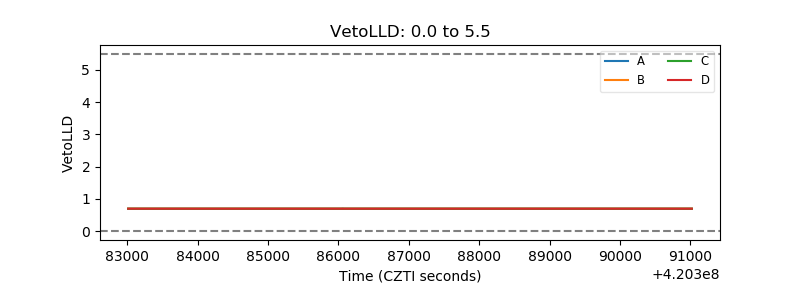 |
| Alpha Counter |  |
| _CPM_Rate | 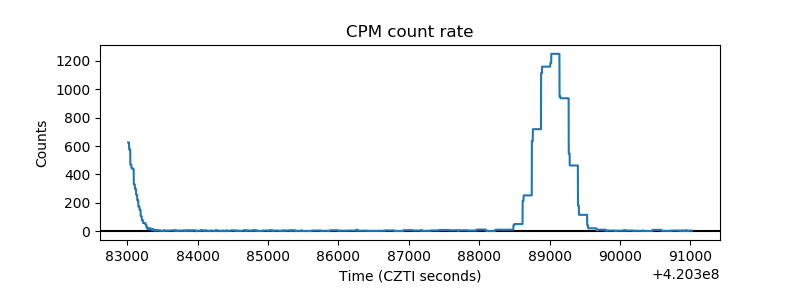 |
| CZT Counter |  |
| +2.5 Volts monitor | 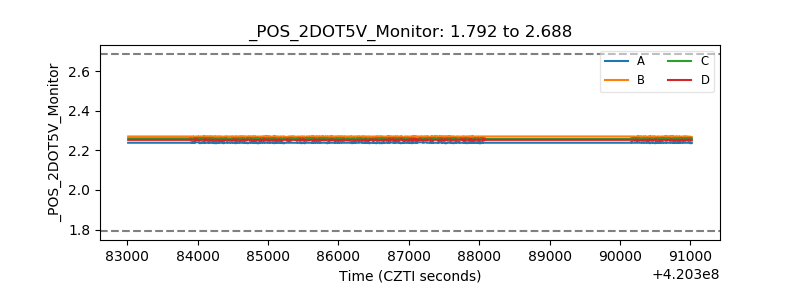 |
| +5 Volts monitor |  |
| _ROLL_ROT | 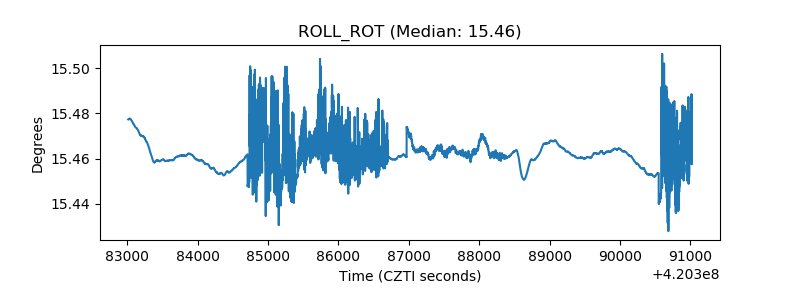 |
| _Roll_DEC | 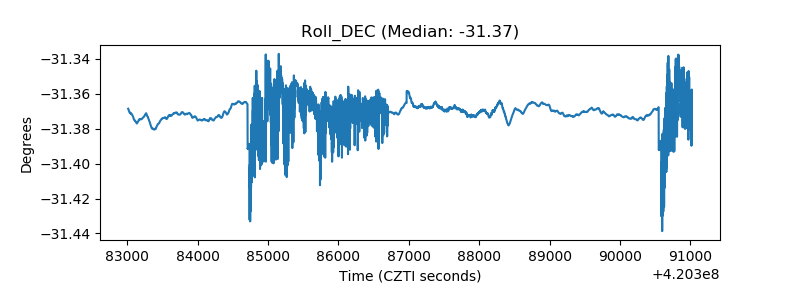 |
| _Roll_RA | 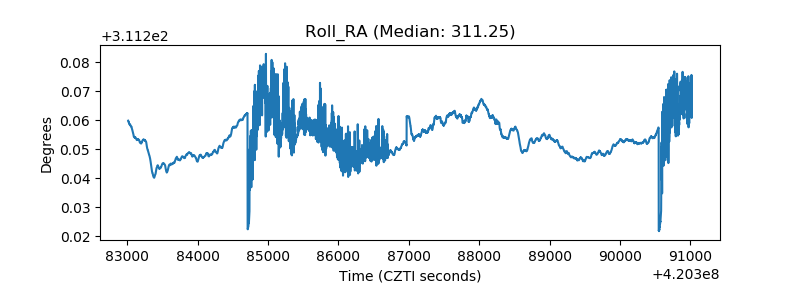 |
| Veto Counter | 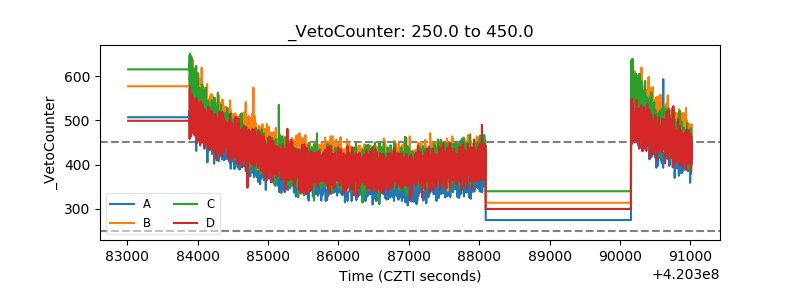 |