| Param | Original file | Final file |
|---|---|---|
| Filename | modeM0/AS1A12_066T01_9000005584_40999cztM0_level2.fits | modeM0/AS1A12_066T01_9000005584_40999cztM0_level2_quad_clean.evt |
| Size (bytes) | 313,387,200 | 85,703,040 |
| Size | 298.9 MB | 81.7 MB |
| Events in quadrant A | 2,710,881 | 586,644 |
| Events in quadrant B | 2,476,028 | 589,278 |
| Events in quadrant C | 2,605,362 | 550,999 |
| Events in quadrant D | 3,413,461 | 513,008 |
| Mode SS | |||
|---|---|---|---|
| Quadrant | BADHDUFLAG | Total packets | Discarded packets |
| A | 0 | 104 | 0 |
| B | 0 | 104 | 0 |
| C | 0 | 104 | 0 |
| D | 0 | 104 | 0 |
| Mode M0 | |||
|---|---|---|---|
| Quadrant | BADHDUFLAG | Total packets | Discarded packets |
| A | 0 | 11183 | 3 |
| B | 0 | 10812 | 2 |
| C | 0 | 10828 | 2 |
| D | 0 | 13774 | 2 |
| Mode M9 | |||
|---|---|---|---|
| Quadrant | BADHDUFLAG | Total packets | Discarded packets |
| A | 0 | 31 | 0 |
| B | 0 | 31 | 0 |
| C | 0 | 31 | 0 |
| D | 0 | 32 | 0 |
| Quadrant | Total seconds | Saturated seconds | Saturation percentage |
|---|---|---|---|
| A | 5065 | 16 | 0.315893% |
| B | 5065 | 48 | 0.947680% |
| C | 5065 | 65 | 1.283317% |
| D | 5065 | 147 | 2.902270% |
Noise dominated data is calculated using 1-second bins in cleaned event files. If a bin has >2000 counts, and if more than 50% of those come from <1% of pixels, then it is considered to be noise-dominated and hence unusable.
| Quadrant | # 1 sec bins | Bins with >0 counts | Bins with >2000 counts | High rate bins dominated by noise | Noise dominated (total time) | Noise dominated (detector-on time) | Marked lightcurve |
|---|---|---|---|---|---|---|---|
| A | 7036 | 5065 | 3 | 3 | 0.04% | 0.06% | 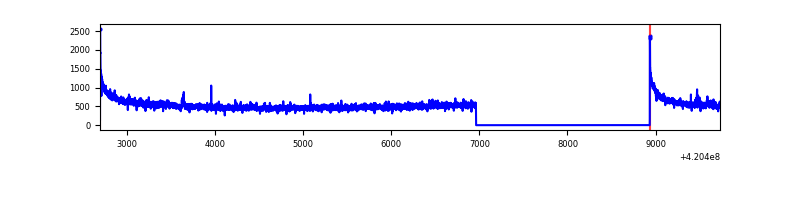 |
| B | 7036 | 5064 | 35 | 35 | 0.50% | 0.69% | 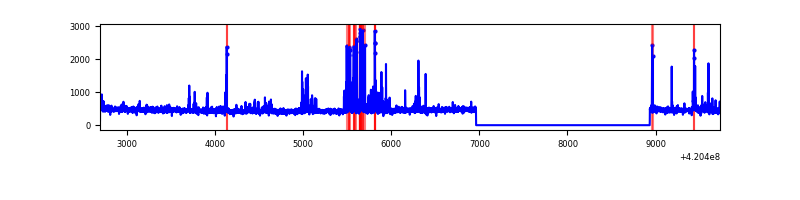 |
| C | 7036 | 5064 | 57 | 57 | 0.81% | 1.13% | 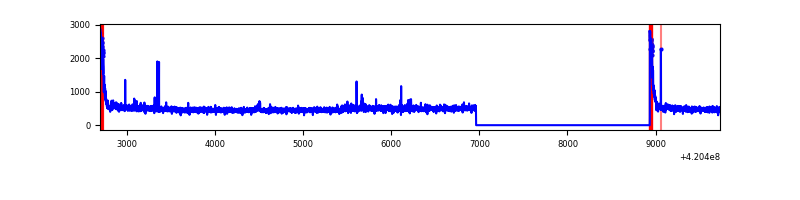 |
| D | 7036 | 5064 | 128 | 128 | 1.82% | 2.53% | 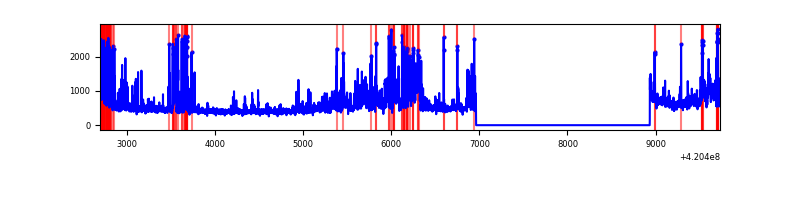 |
Top three noisy pixels from each quadrant. If the there are fewer than three noisy pixels in the level2.evt file, extra rows are filled as -1
| Pixel properties | Quadrant properties | ||||||
|---|---|---|---|---|---|---|---|
| Quadrant | DetID | PixID | Counts | Sigma | Mean | Median | Sigma |
| A | 10 | 83 | 483577 | 4137.12 | 567 | 556 | 116.8 |
| A | 12 | 189 | 22736 | 189.97 | 567 | 556 | 116.8 |
| A | 13 | 254 | 7608 | 60.4 | 567 | 556 | 116.8 |
| B | 5 | 255 | 261403 | 2375.32 | 561 | 545 | 109.8 |
| B | 12 | 111 | 14087 | 123.31 | 561 | 545 | 109.8 |
| B | 11 | 111 | 12917 | 112.66 | 561 | 545 | 109.8 |
| C | 15 | 214 | 219011 | 1696.24 | 549 | 552 | 128.8 |
| C | 0 | 10 | 178398 | 1380.9 | 549 | 552 | 128.8 |
| C | 12 | 249 | 23592 | 178.9 | 549 | 552 | 128.8 |
| D | 13 | 249 | 440425 | 3302.9 | 544 | 529 | 133.2 |
| D | 6 | 239 | 245897 | 1842.31 | 544 | 529 | 133.2 |
| D | 2 | 249 | 221590 | 1659.81 | 544 | 529 | 133.2 |
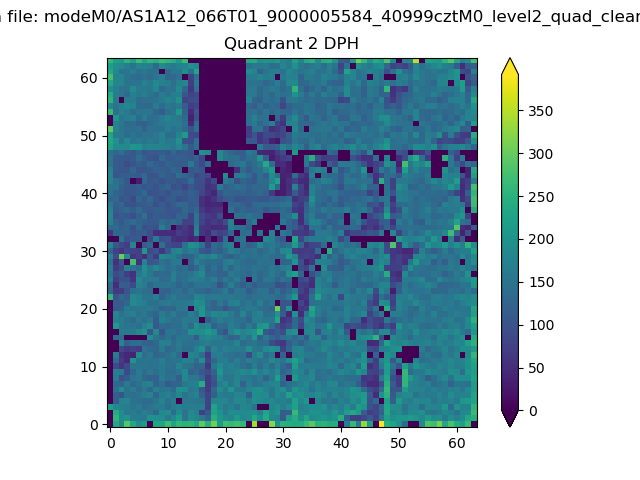
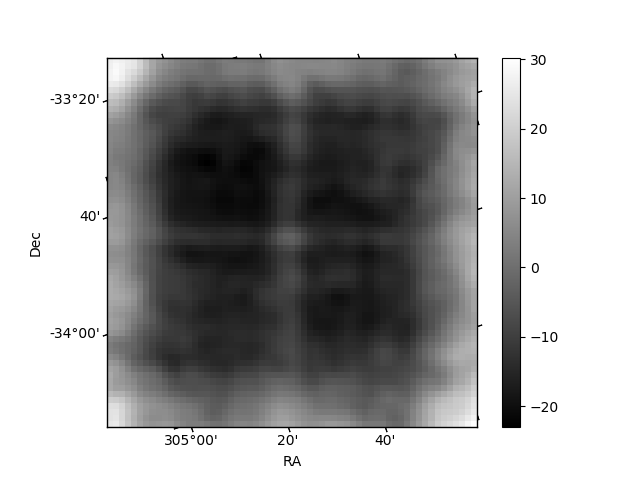
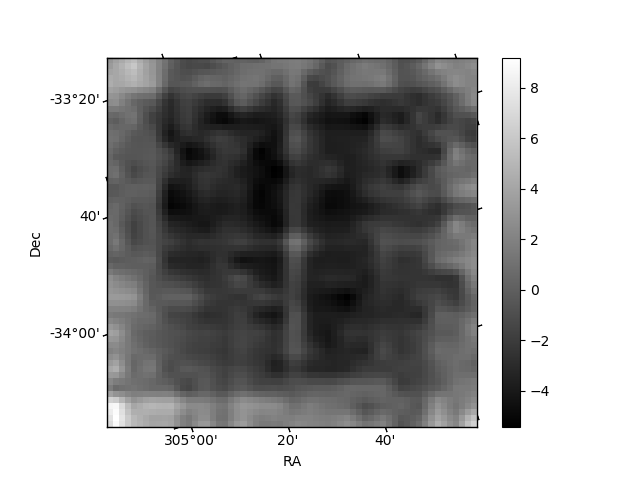
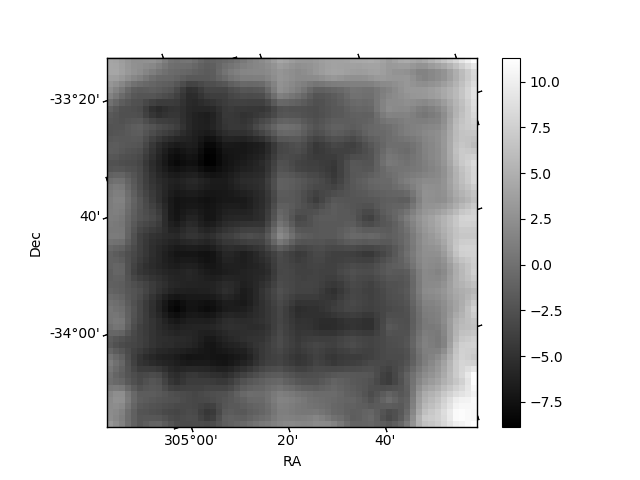
Histogram calculated using DETX and DETY for each event in the final _common_clean file
| Quadrant A | 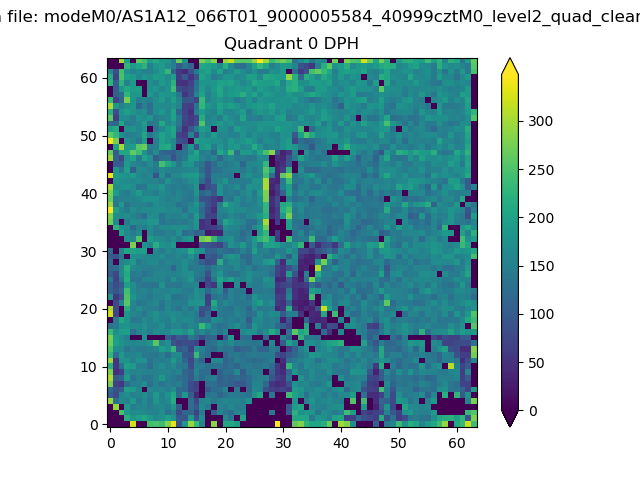 |
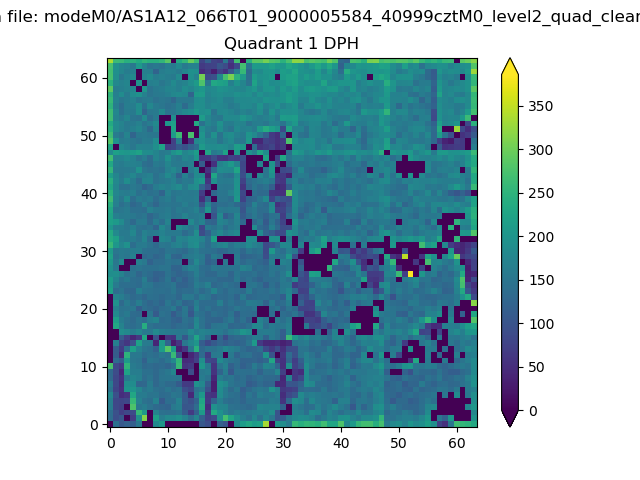 |
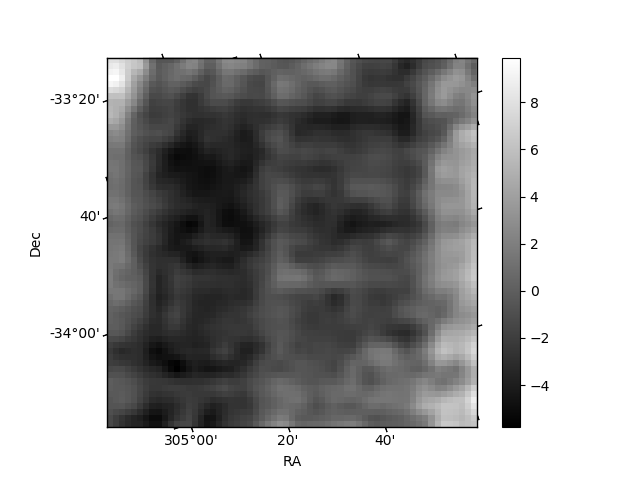
Quadrant B |
|---|---|---|---|
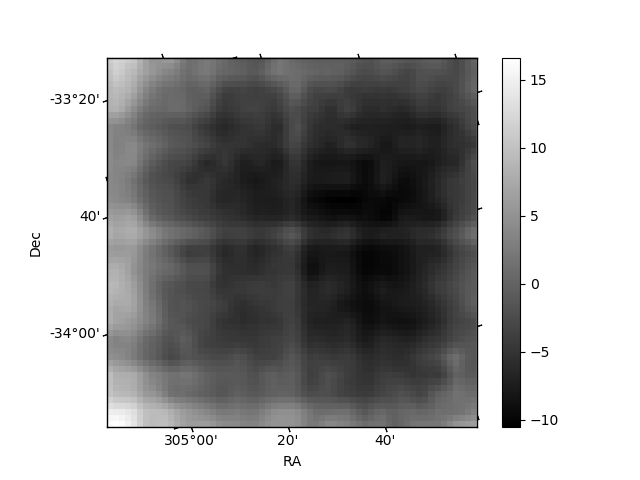
| Quadrant D | 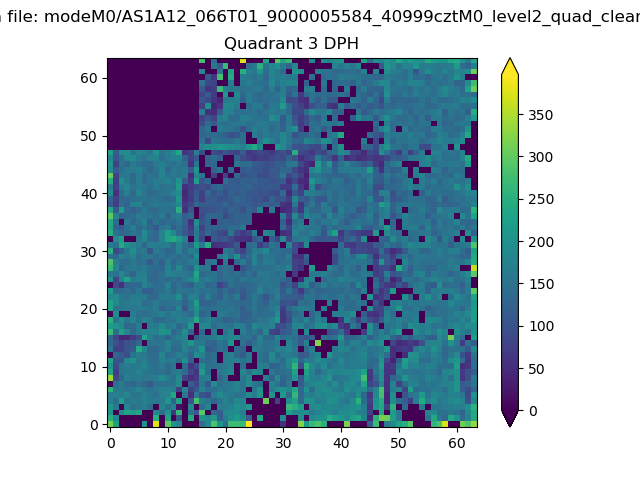 |
 |
Quadrant C |
| Plot type | Count rate plots | Images |
|---|---|---|
| Comparison with Poisson distribution Blue bars denote a histogram of data divided into 1 sec bins. Red curve is a Poisson curve with rate = median count rate of data. |
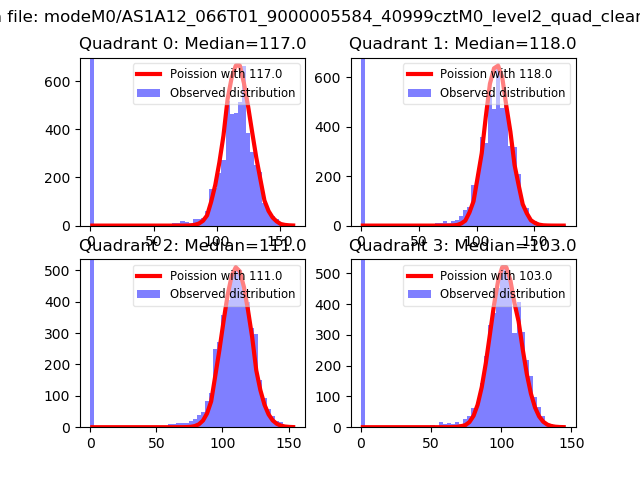 |
 |
| Quadrant-wise count rates Data is divided into 100 sec bins |
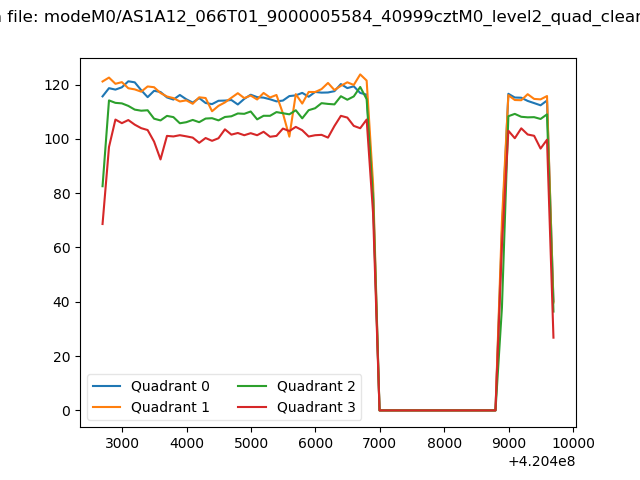 |
|
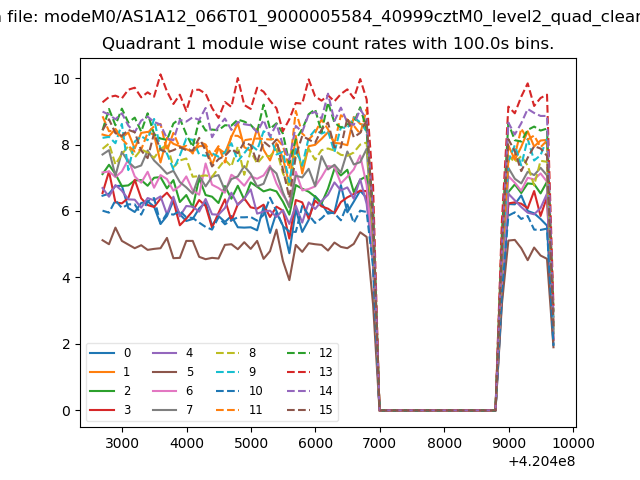
| Module-wise count rates for Quadrant A Data is divided into 100 sec bins |
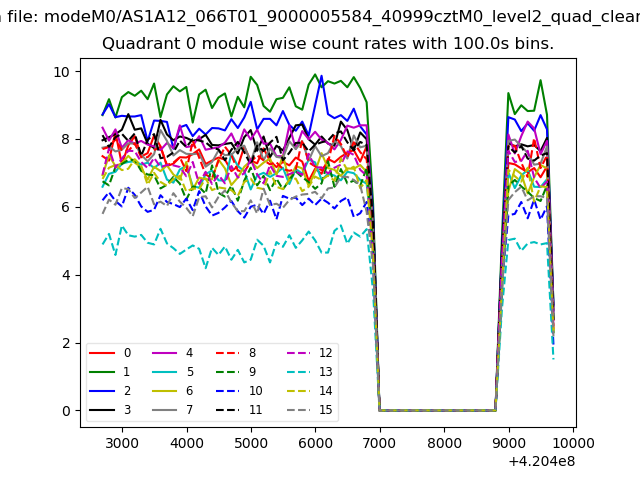 |
 |
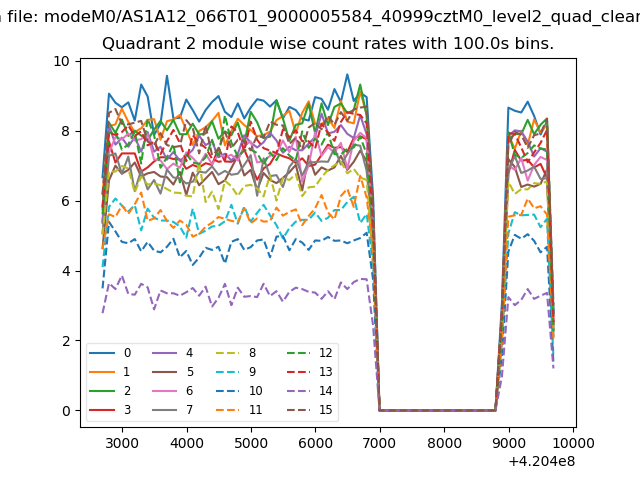
| Module-wise count rates for Quadrant B Data is divided into 100 sec bins |
 |
 |
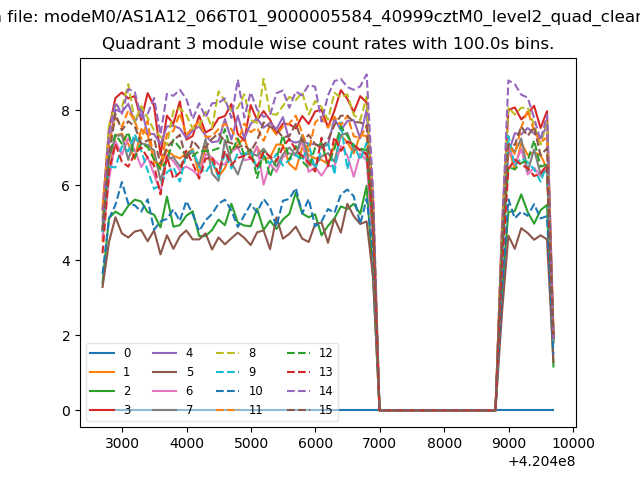
| Module-wise count rates for Quadrant C Data is divided into 100 sec bins |
 |
 |
| Module-wise count rates for Quadrant D Data is divided into 100 sec bins |
 |
 |
| Parameter | Plot |
|---|---|
| CZT HV Monitor | 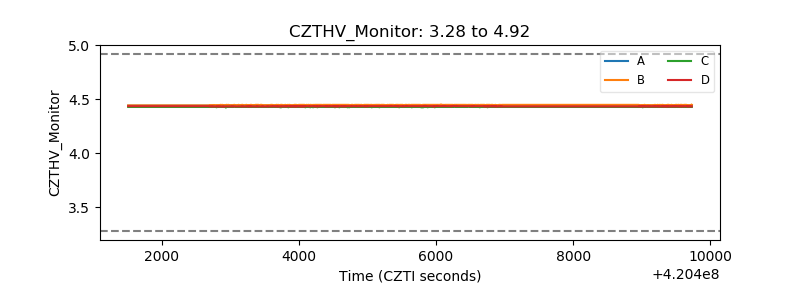 |
| D_VDD | 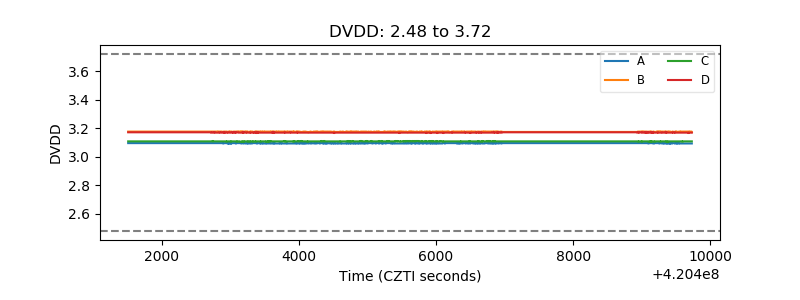 |
| Temperature 1 | 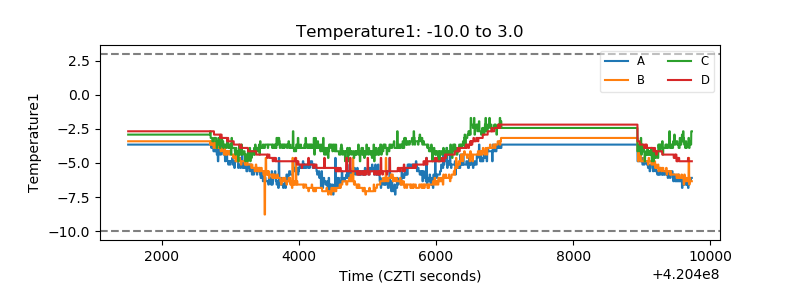 |
| Veto HV Monitor |  |
| Veto LLD | 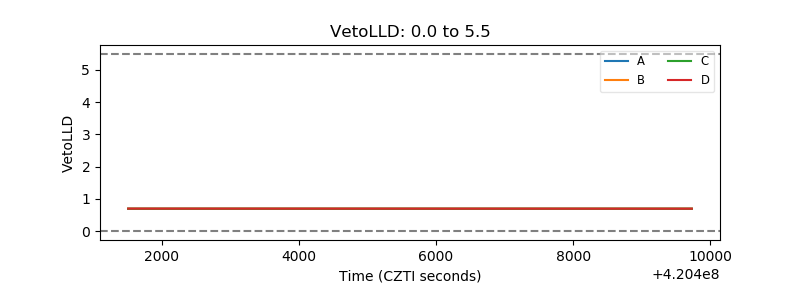 |
| Alpha Counter |  |
| _CPM_Rate |  |
| CZT Counter | 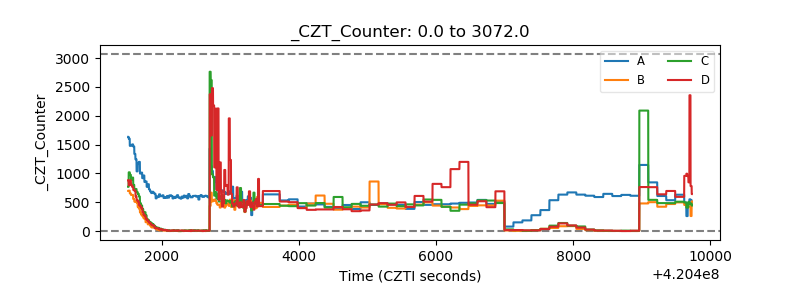 |
| +2.5 Volts monitor | 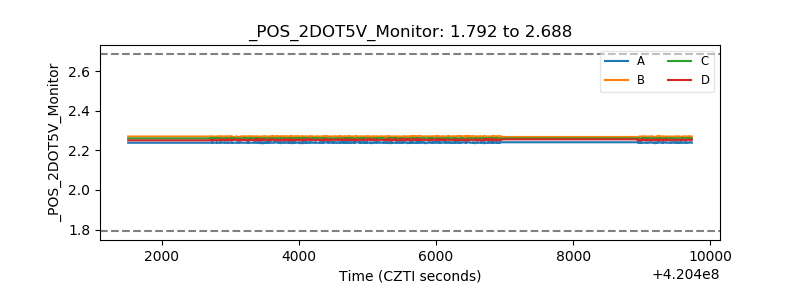 |
| +5 Volts monitor |  |
| _ROLL_ROT | 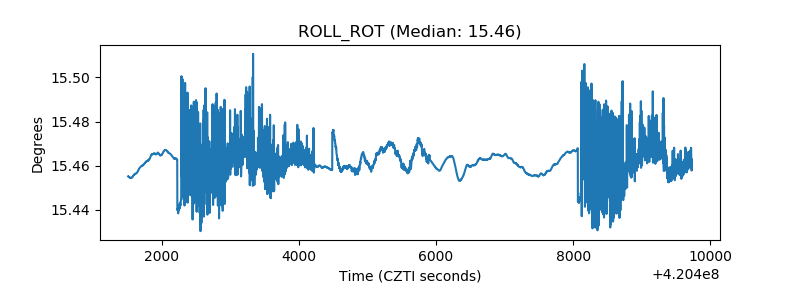 |
| _Roll_DEC | 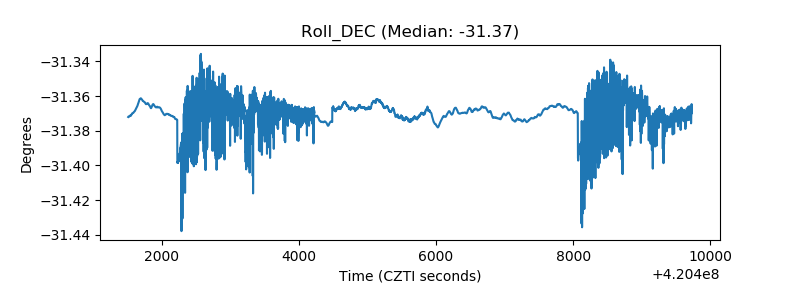 |
| _Roll_RA | 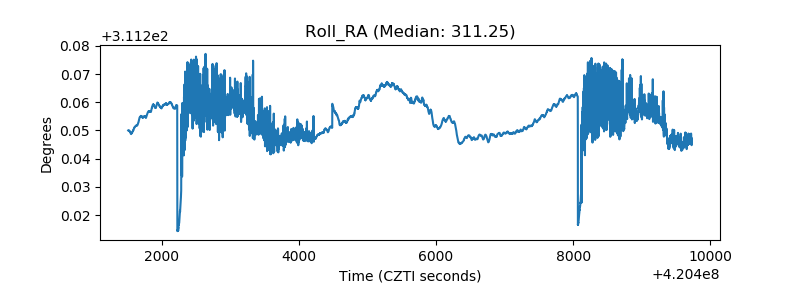 |
| Veto Counter |  |