| Param | Original file | Final file |
|---|---|---|
| Filename | modeM0/AS1A12_066T01_9000005584_41000cztM0_level2.fits | modeM0/AS1A12_066T01_9000005584_41000cztM0_level2_quad_clean.evt |
| Size (bytes) | 329,757,120 | 90,132,480 |
| Size | 314.5 MB | 86.0 MB |
| Events in quadrant A | 2,860,463 | 612,185 |
| Events in quadrant B | 2,505,472 | 620,320 |
| Events in quadrant C | 2,698,973 | 585,358 |
| Events in quadrant D | 3,715,687 | 528,675 |
| Mode SS | |||
|---|---|---|---|
| Quadrant | BADHDUFLAG | Total packets | Discarded packets |
| A | 0 | 112 | 0 |
| B | 0 | 112 | 0 |
| C | 0 | 112 | 0 |
| D | 0 | 112 | 0 |
| Mode M0 | |||
|---|---|---|---|
| Quadrant | BADHDUFLAG | Total packets | Discarded packets |
| A | 0 | 11873 | 3 |
| B | 0 | 11326 | 2 |
| C | 0 | 11452 | 2 |
| D | 0 | 14933 | 2 |
| Mode M9 | |||
|---|---|---|---|
| Quadrant | BADHDUFLAG | Total packets | Discarded packets |
| A | 0 | 28 | 0 |
| B | 0 | 28 | 0 |
| C | 0 | 28 | 0 |
| D | 0 | 29 | 0 |
| Quadrant | Total seconds | Saturated seconds | Saturation percentage |
|---|---|---|---|
| A | 5467 | 9 | 0.164624% |
| B | 5467 | 23 | 0.420706% |
| C | 5467 | 53 | 0.969453% |
| D | 5467 | 242 | 4.426559% |
Noise dominated data is calculated using 1-second bins in cleaned event files. If a bin has >2000 counts, and if more than 50% of those come from <1% of pixels, then it is considered to be noise-dominated and hence unusable.
| Quadrant | # 1 sec bins | Bins with >0 counts | Bins with >2000 counts | High rate bins dominated by noise | Noise dominated (total time) | Noise dominated (detector-on time) | Marked lightcurve |
|---|---|---|---|---|---|---|---|
| A | 7111 | 5468 | 4 | 4 | 0.06% | 0.07% | 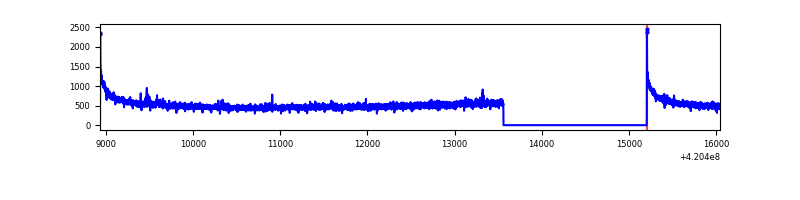 |
| B | 7110 | 5466 | 11 | 11 | 0.15% | 0.20% | 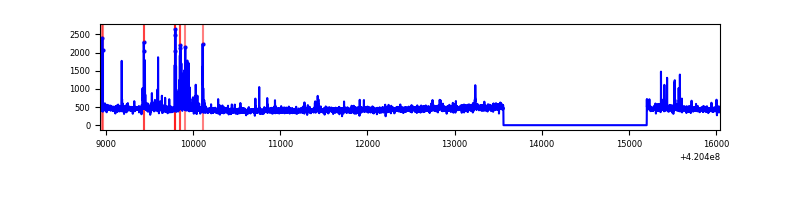 |
| C | 7110 | 5466 | 44 | 44 | 0.62% | 0.80% | 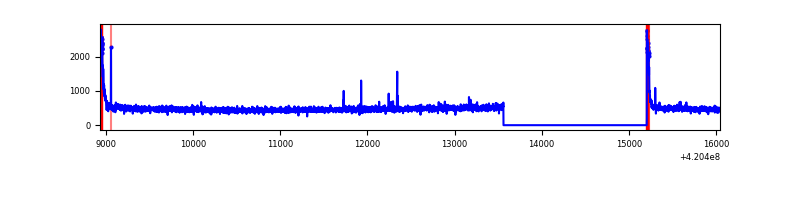 |
| D | 7110 | 5466 | 229 | 229 | 3.22% | 4.19% | 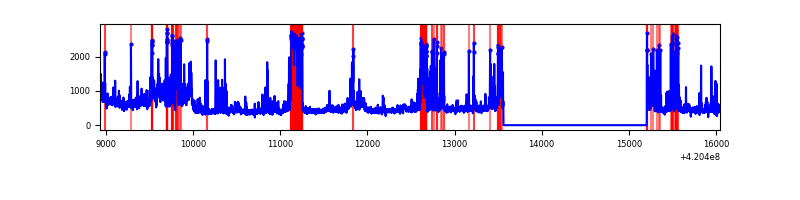 |
Top three noisy pixels from each quadrant. If the there are fewer than three noisy pixels in the level2.evt file, extra rows are filled as -1
| Pixel properties | Quadrant properties | ||||||
|---|---|---|---|---|---|---|---|
| Quadrant | DetID | PixID | Counts | Sigma | Mean | Median | Sigma |
| A | 10 | 83 | 501903 | 4026.23 | 605 | 591 | 124.5 |
| A | 13 | 248 | 11381 | 86.65 | 605 | 591 | 124.5 |
| A | 13 | 254 | 7838 | 58.2 | 605 | 591 | 124.5 |
| B | 5 | 255 | 147448 | 1253.18 | 599 | 581 | 117.2 |
| B | 12 | 111 | 14845 | 121.71 | 599 | 581 | 117.2 |
| B | 11 | 111 | 14072 | 115.12 | 599 | 581 | 117.2 |
| C | 15 | 214 | 234682 | 1687.29 | 590 | 592 | 138.7 |
| C | 0 | 10 | 137436 | 986.35 | 590 | 592 | 138.7 |
| C | 12 | 249 | 15136 | 104.83 | 590 | 592 | 138.7 |
| D | 13 | 249 | 613201 | 4315.43 | 579 | 563 | 142.0 |
| D | 6 | 239 | 365377 | 2569.75 | 579 | 563 | 142.0 |
| D | 2 | 249 | 224212 | 1575.39 | 579 | 563 | 142.0 |
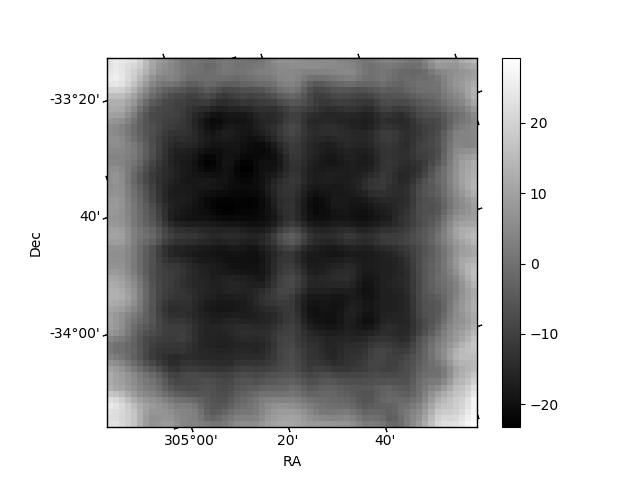
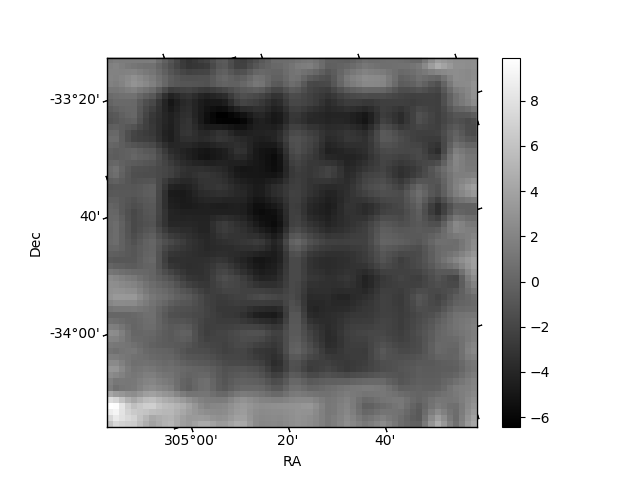
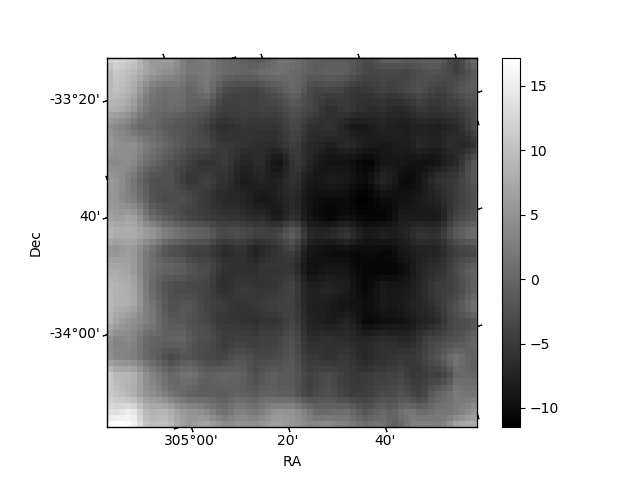
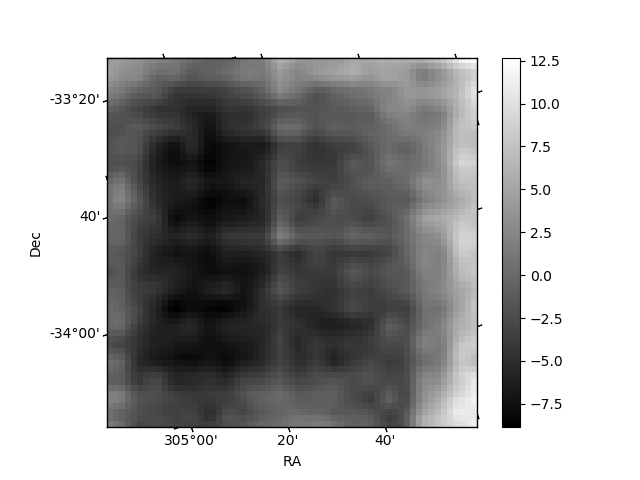
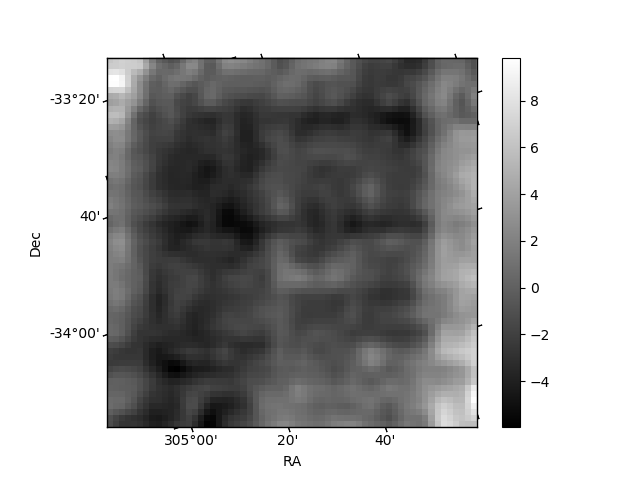
Histogram calculated using DETX and DETY for each event in the final _common_clean file
| Quadrant A | 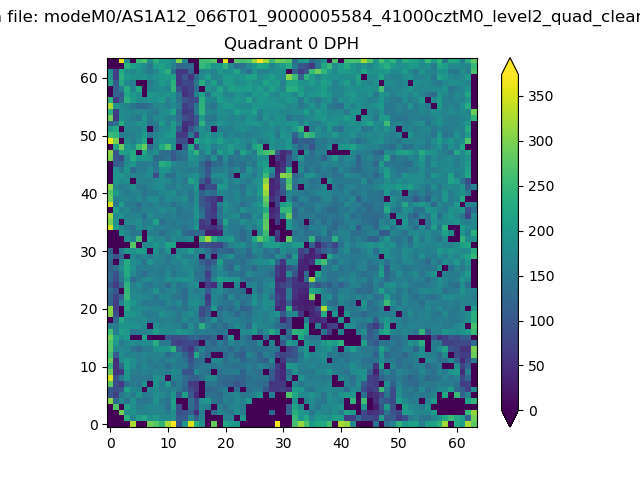 |
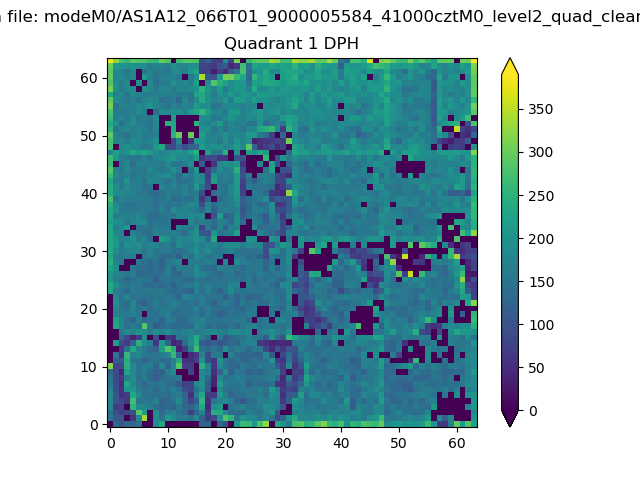 |
Quadrant B |
|---|---|---|---|
| Quadrant D | 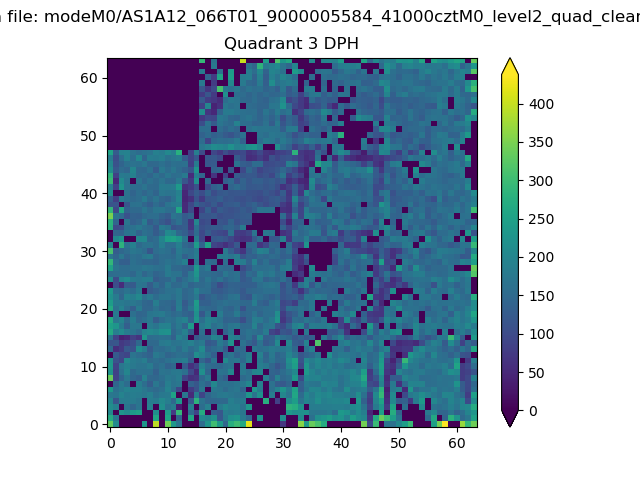 |
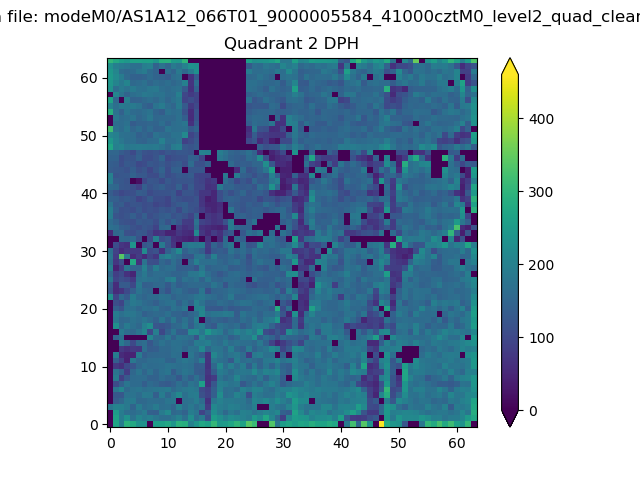 |
Quadrant C |
| Plot type | Count rate plots | Images |
|---|---|---|
| Comparison with Poisson distribution Blue bars denote a histogram of data divided into 1 sec bins. Red curve is a Poisson curve with rate = median count rate of data. |
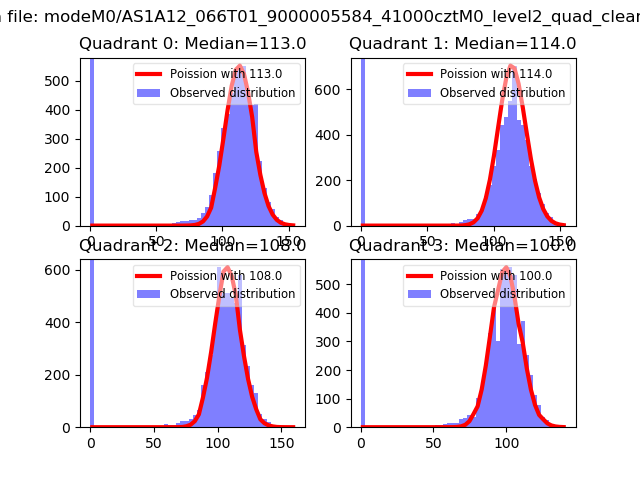 |
 |
| Quadrant-wise count rates Data is divided into 100 sec bins |
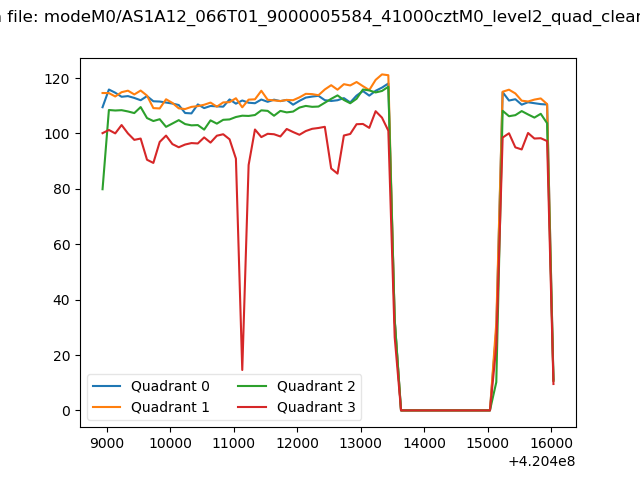 |
|
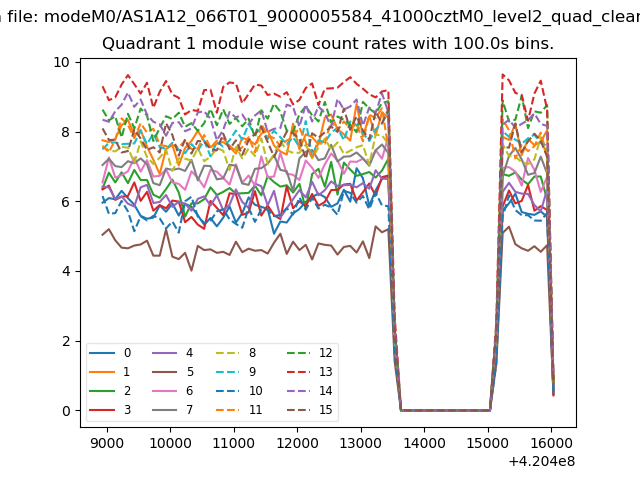
| Module-wise count rates for Quadrant A Data is divided into 100 sec bins |
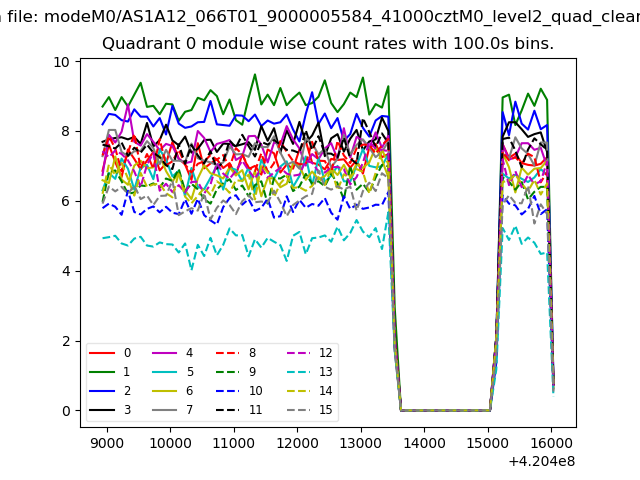 |
 |
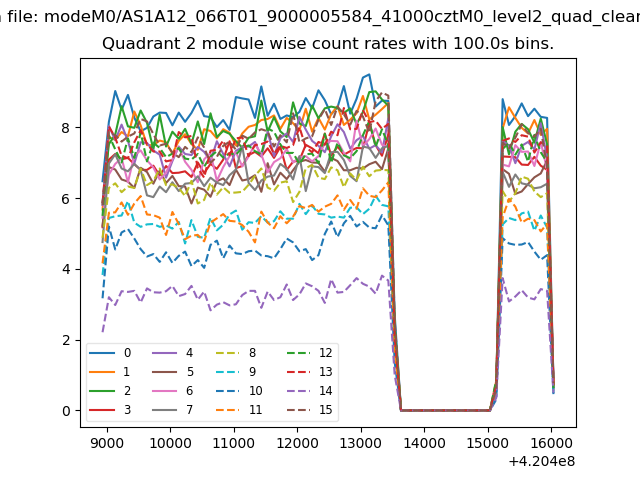
| Module-wise count rates for Quadrant B Data is divided into 100 sec bins |
 |
 |
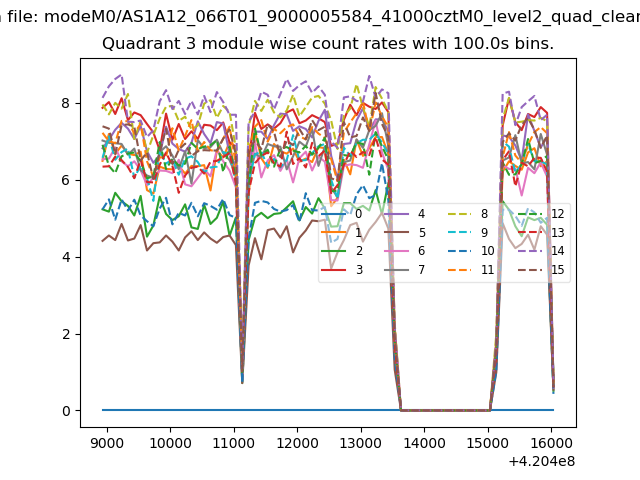
| Module-wise count rates for Quadrant C Data is divided into 100 sec bins |
 |
 |
| Module-wise count rates for Quadrant D Data is divided into 100 sec bins |
 |
 |
| Parameter | Plot |
|---|---|
| CZT HV Monitor | 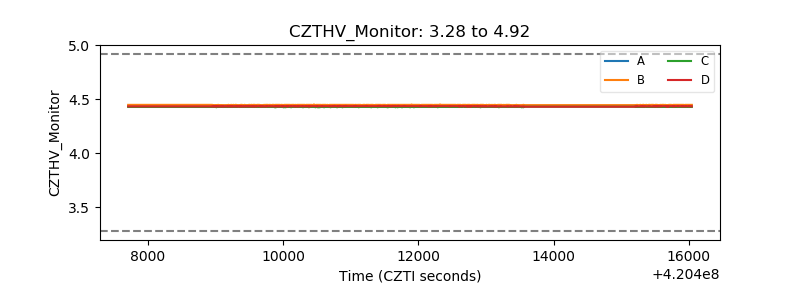 |
| D_VDD | 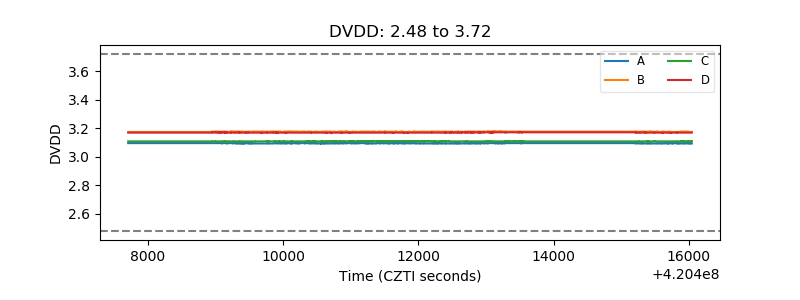 |
| Temperature 1 | 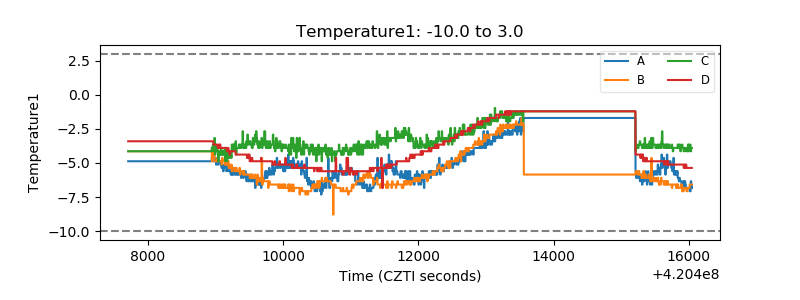 |
| Veto HV Monitor | 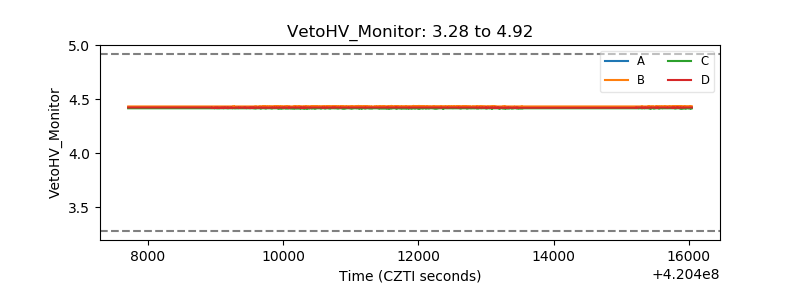 |
| Veto LLD | 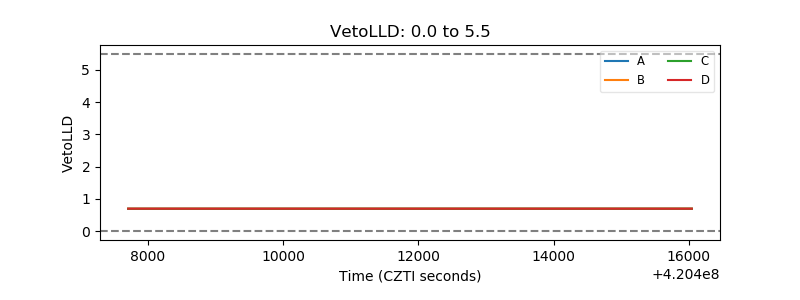 |
| Alpha Counter | 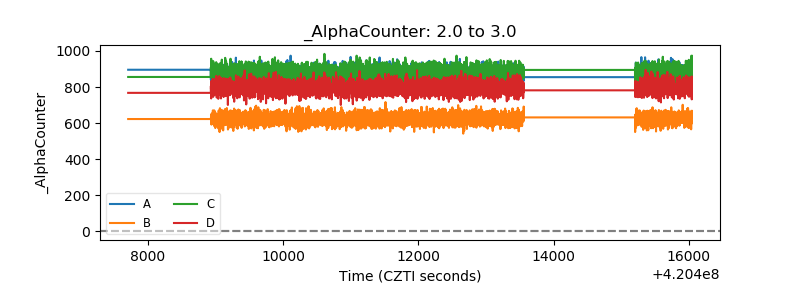 |
| _CPM_Rate | 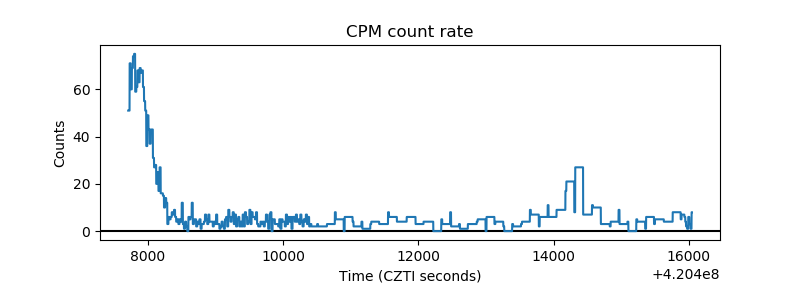 |
| CZT Counter | 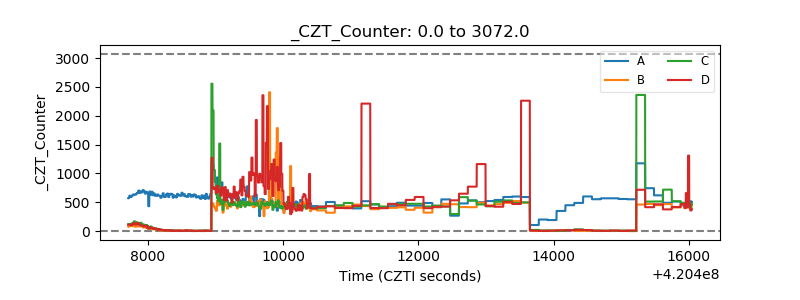 |
| +2.5 Volts monitor | 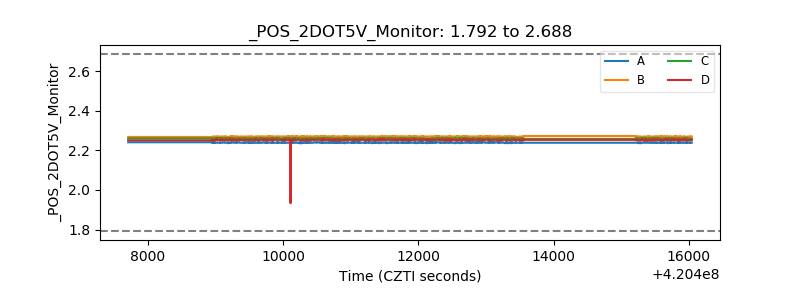 |
| +5 Volts monitor | 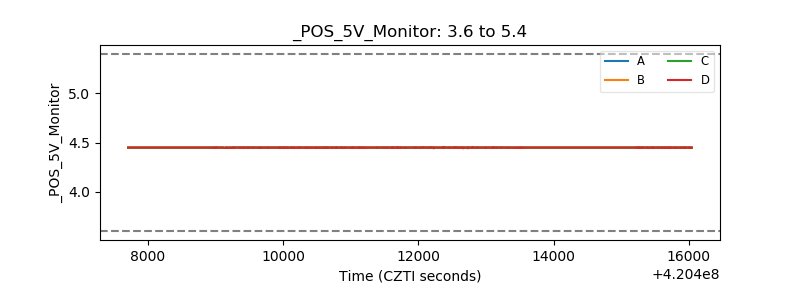 |
| _ROLL_ROT | 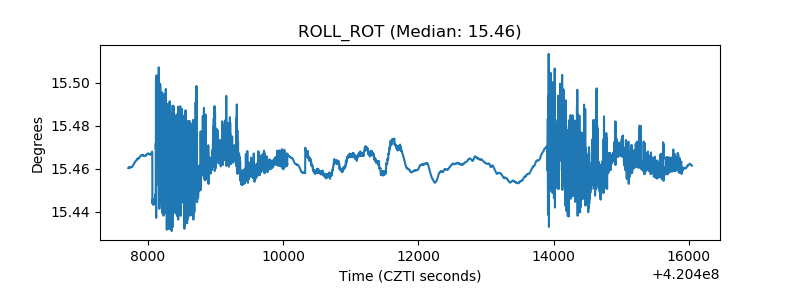 |
| _Roll_DEC | 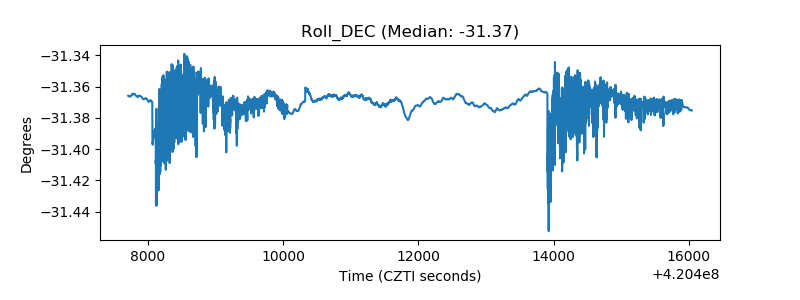 |
| _Roll_RA | 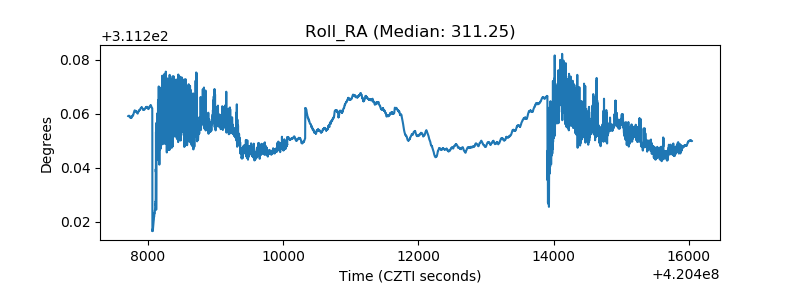 |
| Veto Counter | 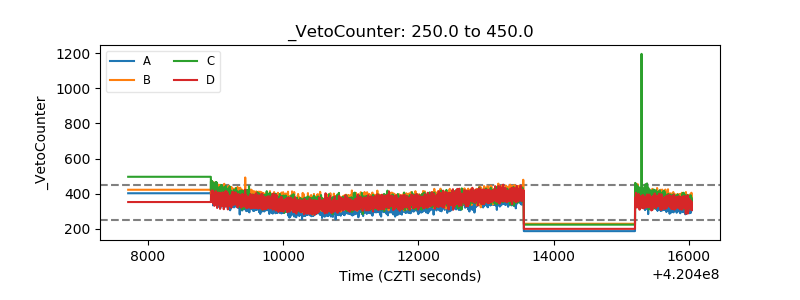 |