| Param | Original file | Final file |
|---|---|---|
| Filename | modeM0/AS1A12_066T01_9000005584_41001cztM0_level2.fits | modeM0/AS1A12_066T01_9000005584_41001cztM0_level2_quad_clean.evt |
| Size (bytes) | 73,166,400 | 20,825,280 |
| Size | 69.8 MB | 19.9 MB |
| Events in quadrant A | 702,443 | 140,076 |
| Events in quadrant B | 567,383 | 141,374 |
| Events in quadrant C | 639,665 | 130,741 |
| Events in quadrant D | 697,568 | 123,640 |
| Mode SS | |||
|---|---|---|---|
| Quadrant | BADHDUFLAG | Total packets | Discarded packets |
| A | 0 | 26 | 0 |
| B | 0 | 26 | 0 |
| C | 0 | 26 | 0 |
| D | 0 | 26 | 0 |
| Mode M0 | |||
|---|---|---|---|
| Quadrant | BADHDUFLAG | Total packets | Discarded packets |
| A | 0 | 2882 | 1 |
| B | 0 | 2579 | 1 |
| C | 0 | 2702 | 1 |
| D | 0 | 3004 | 1 |
| Mode M9 | |||
|---|---|---|---|
| Quadrant | BADHDUFLAG | Total packets | Discarded packets |
| A | 0 | 11 | 0 |
| B | 0 | 11 | 0 |
| C | 0 | 11 | 0 |
| D | 0 | 12 | 0 |
| Quadrant | Total seconds | Saturated seconds | Saturation percentage |
|---|---|---|---|
| A | 1261 | 5 | 0.396511% |
| B | 1261 | 3 | 0.237906% |
| C | 1261 | 21 | 1.665345% |
| D | 1261 | 31 | 2.458366% |
Noise dominated data is calculated using 1-second bins in cleaned event files. If a bin has >2000 counts, and if more than 50% of those come from <1% of pixels, then it is considered to be noise-dominated and hence unusable.
| Quadrant | # 1 sec bins | Bins with >0 counts | Bins with >2000 counts | High rate bins dominated by noise | Noise dominated (total time) | Noise dominated (detector-on time) | Marked lightcurve |
|---|---|---|---|---|---|---|---|
| A | 1261 | 1261 | 2 | 2 | 0.16% | 0.16% | 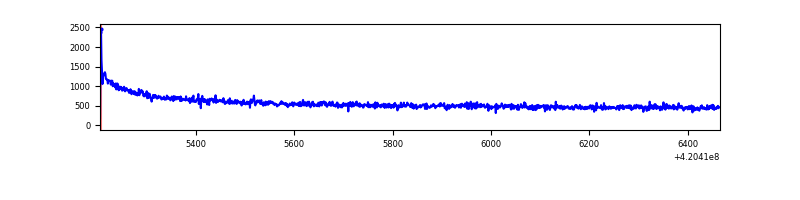 |
| B | 1260 | 1260 | 0 | 0 | 0.00% | 0.00% | 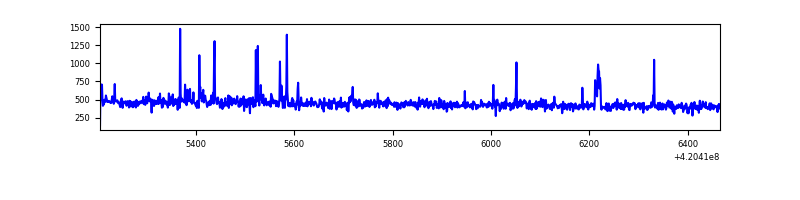 |
| C | 1260 | 1260 | 17 | 17 | 1.35% | 1.35% | 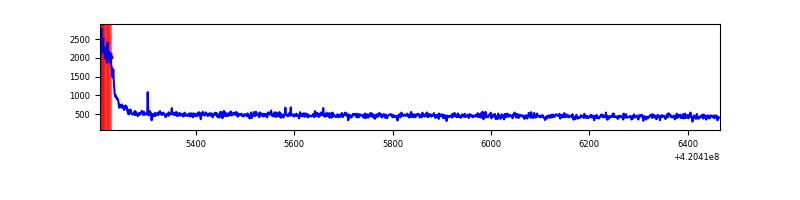 |
| D | 1260 | 1260 | 29 | 29 | 2.30% | 2.30% | 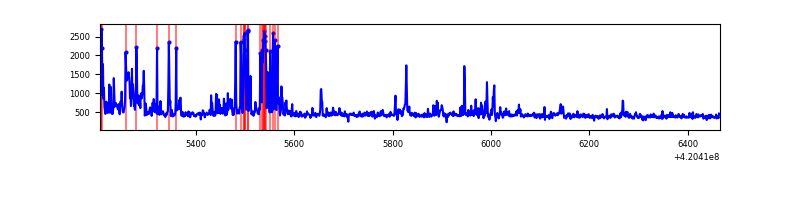 |
Top three noisy pixels from each quadrant. If the there are fewer than three noisy pixels in the level2.evt file, extra rows are filled as -1
| Pixel properties | Quadrant properties | ||||||
|---|---|---|---|---|---|---|---|
| Quadrant | DetID | PixID | Counts | Sigma | Mean | Median | Sigma |
| A | 10 | 83 | 169064 | 5745.36 | 136 | 134 | 29.4 |
| A | 12 | 189 | 2914 | 94.55 | 136 | 134 | 29.4 |
| A | 13 | 254 | 1912 | 60.47 | 136 | 134 | 29.4 |
| B | 5 | 255 | 18288 | 625.49 | 137 | 133 | 29.0 |
| B | 4 | 81 | 4402 | 147.08 | 137 | 133 | 29.0 |
| B | 12 | 111 | 3567 | 118.31 | 137 | 133 | 29.0 |
| C | 15 | 214 | 58334 | 1735.34 | 134 | 134 | 33.5 |
| C | 0 | 10 | 51585 | 1534.11 | 134 | 134 | 33.5 |
| C | 14 | 254 | 5829 | 169.81 | 134 | 134 | 33.5 |
| D | 2 | 249 | 77495 | 2235.53 | 132 | 127 | 34.6 |
| D | 13 | 249 | 77488 | 2235.32 | 132 | 127 | 34.6 |
| D | 2 | 153 | 12266 | 350.75 | 132 | 127 | 34.6 |
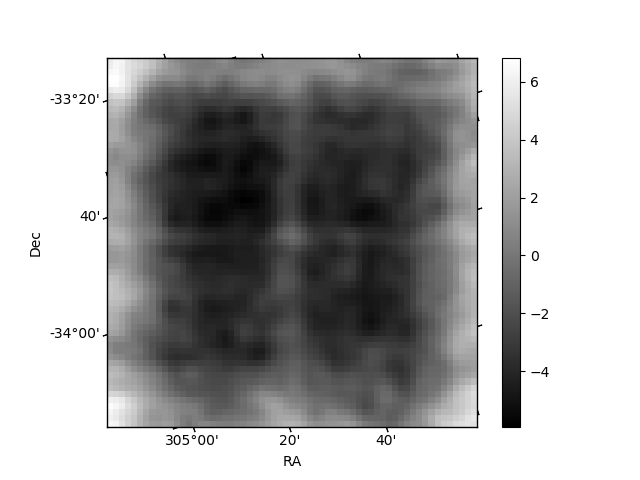
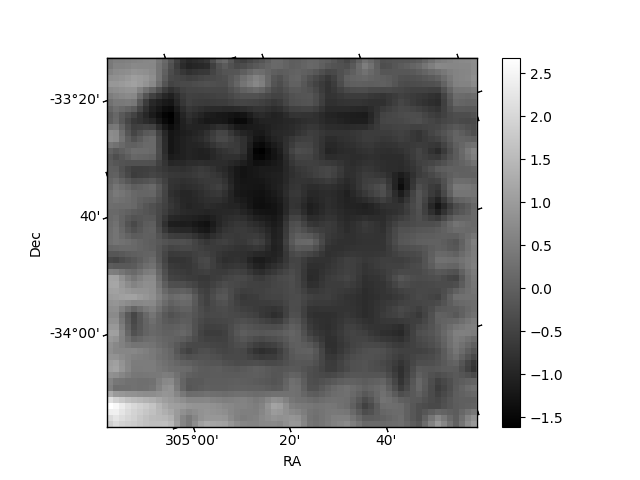
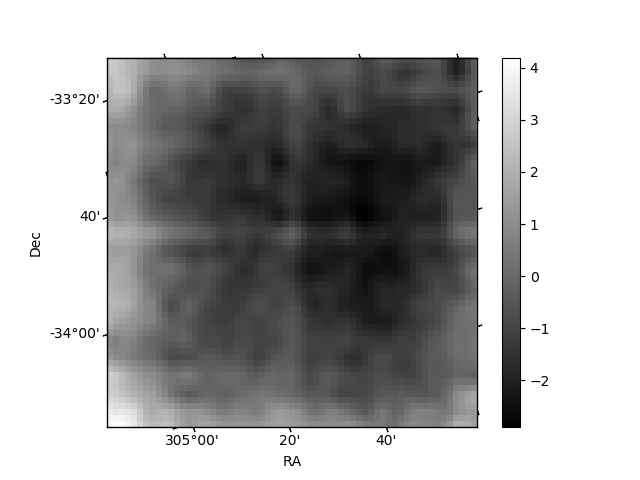
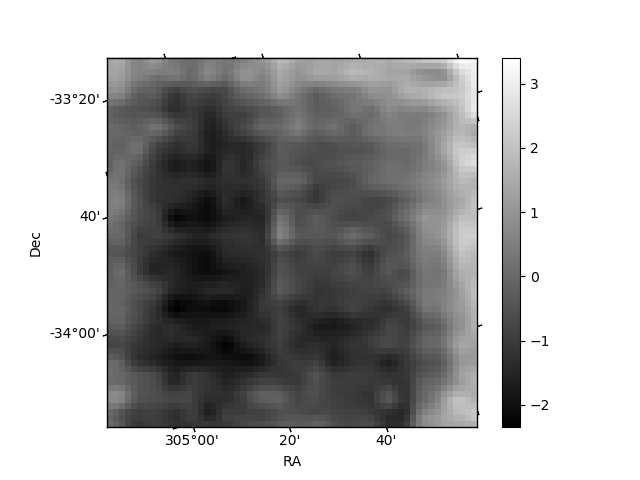
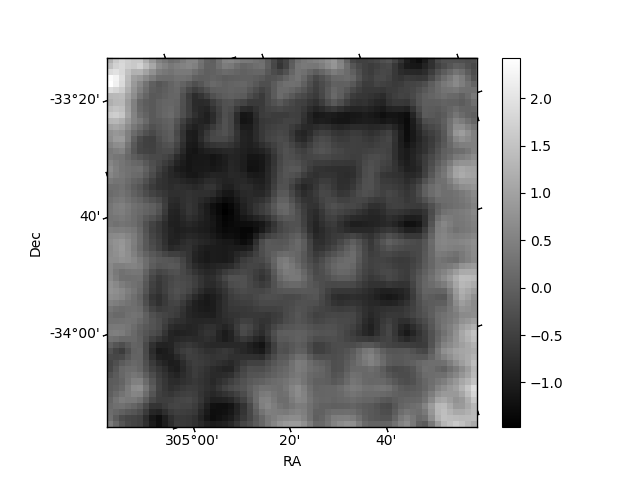
Histogram calculated using DETX and DETY for each event in the final _common_clean file
| Quadrant A | 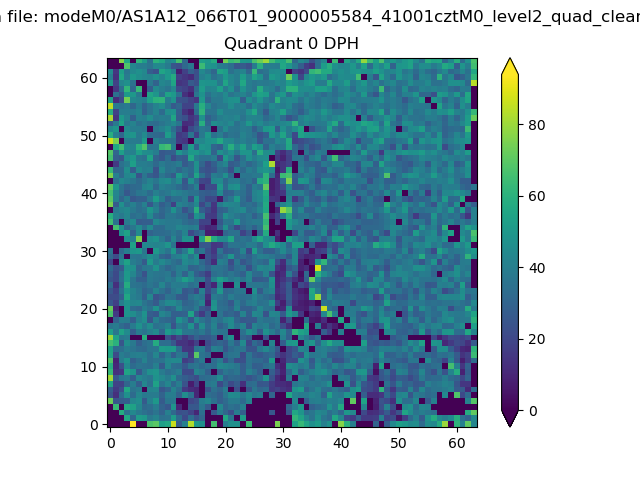 |
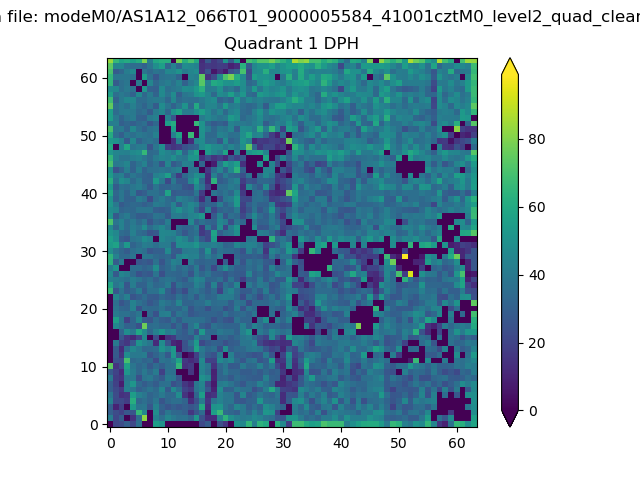 |
Quadrant B |
|---|---|---|---|
| Quadrant D | 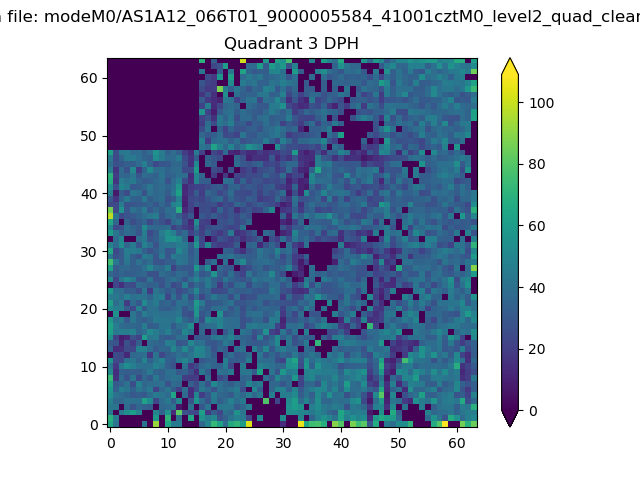 |
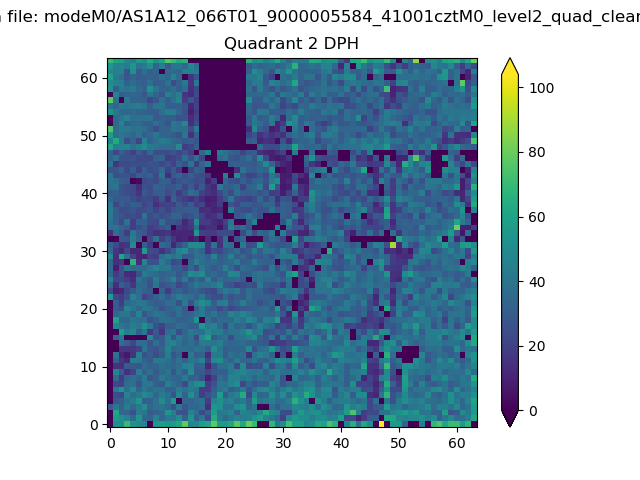 |
Quadrant C |
| Plot type | Count rate plots | Images |
|---|---|---|
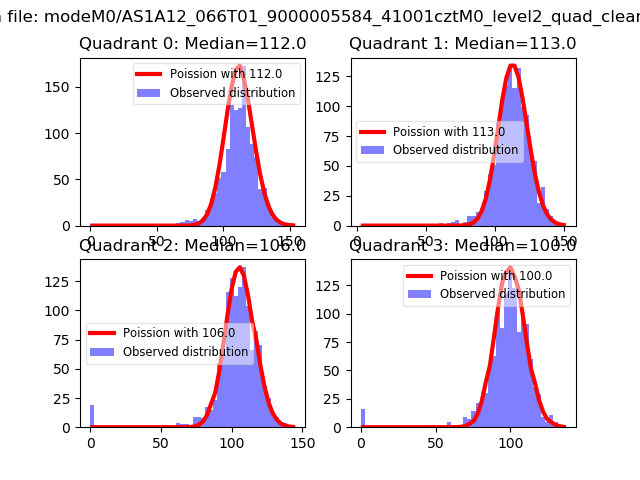
| Comparison with Poisson distribution Blue bars denote a histogram of data divided into 1 sec bins. Red curve is a Poisson curve with rate = median count rate of data. |
 |
 |
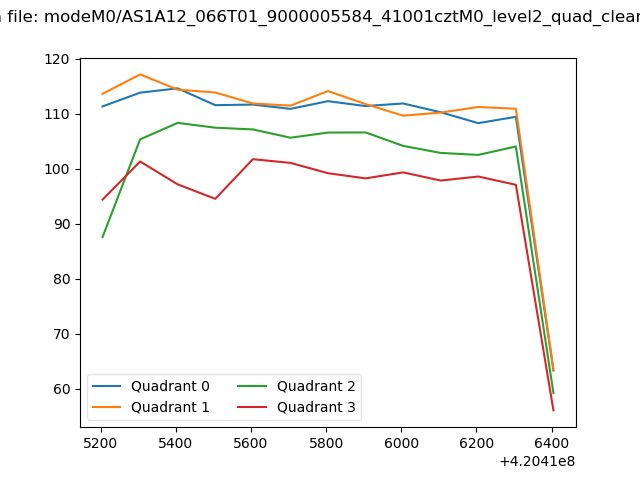
| Quadrant-wise count rates Data is divided into 100 sec bins |
 |
|
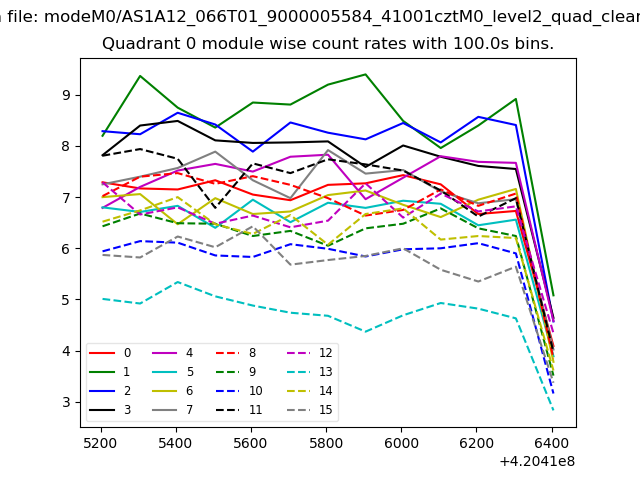
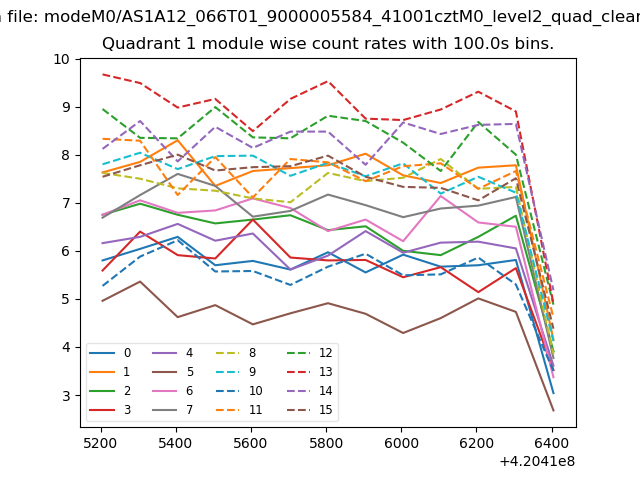
| Module-wise count rates for Quadrant A Data is divided into 100 sec bins |
 |
 |
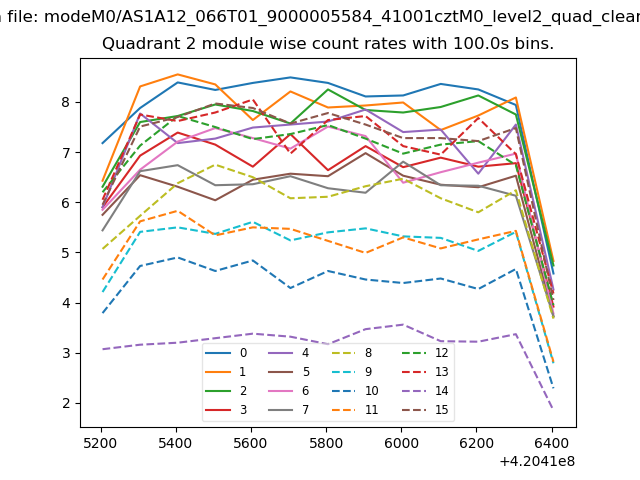
| Module-wise count rates for Quadrant B Data is divided into 100 sec bins |
 |
 |
| Module-wise count rates for Quadrant C Data is divided into 100 sec bins |
 |
 |
| Module-wise count rates for Quadrant D Data is divided into 100 sec bins |
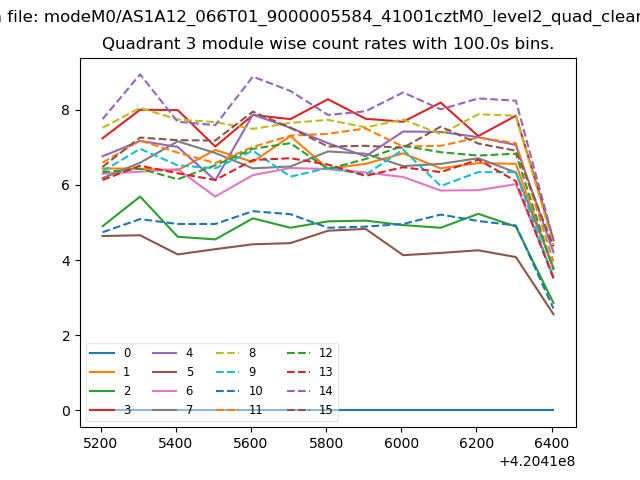 |
 |
| Parameter | Plot |
|---|---|
| CZT HV Monitor | 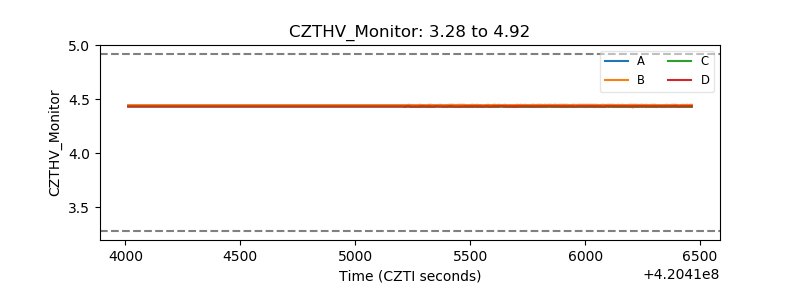 |
| D_VDD | 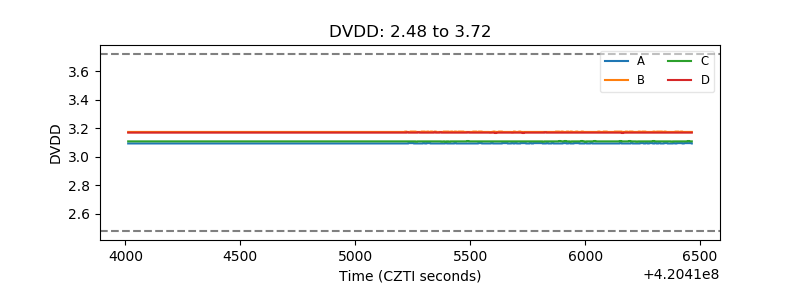 |
| Temperature 1 | 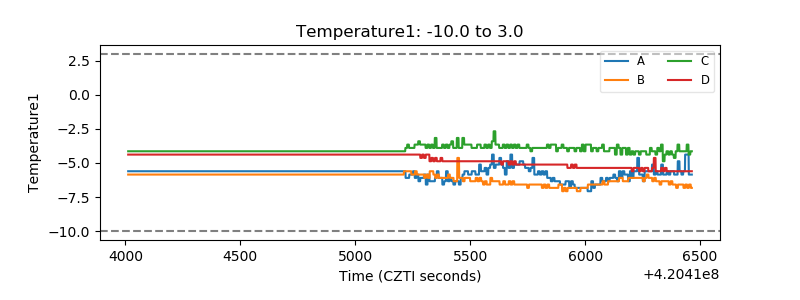 |
| Veto HV Monitor | 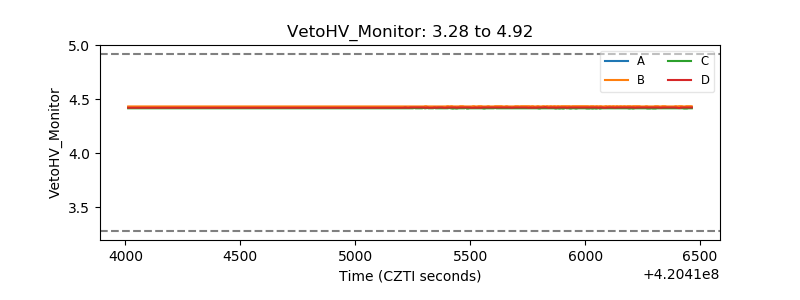 |
| Veto LLD | 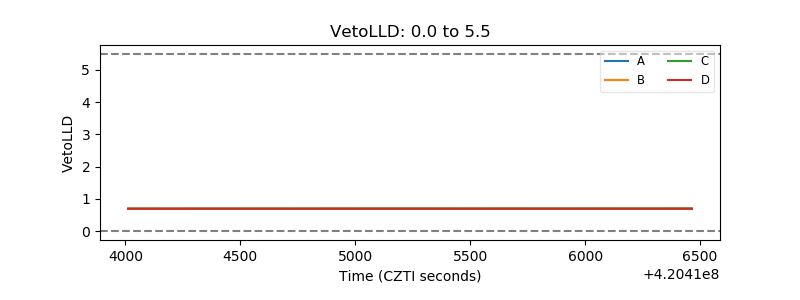 |
| Alpha Counter |  |
| _CPM_Rate |  |
| CZT Counter | 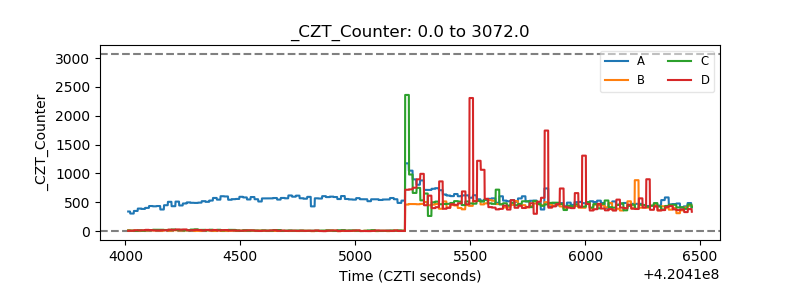 |
| +2.5 Volts monitor | 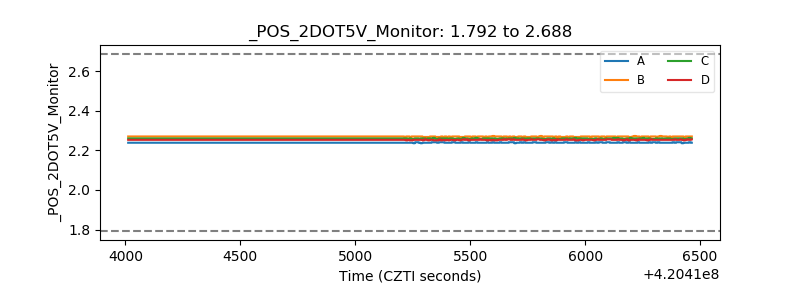 |
| +5 Volts monitor |  |
| _ROLL_ROT | 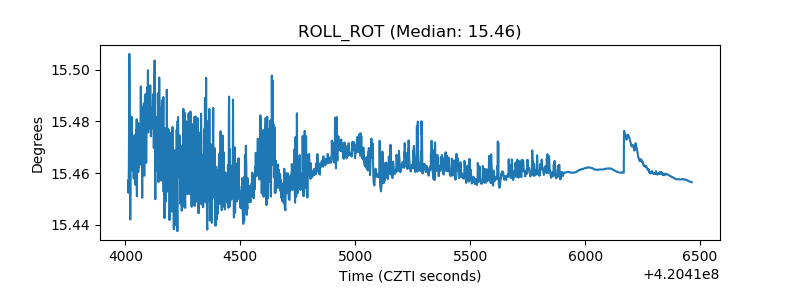 |
| _Roll_DEC | 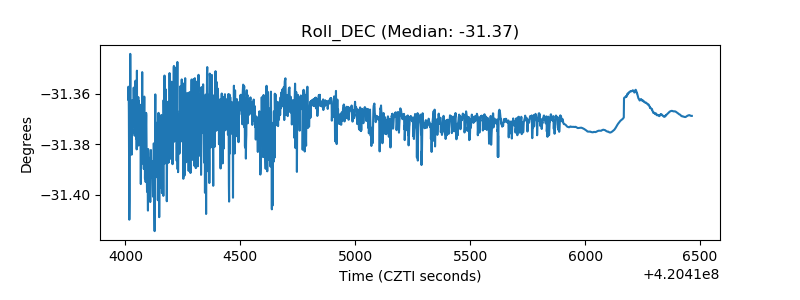 |
| _Roll_RA | 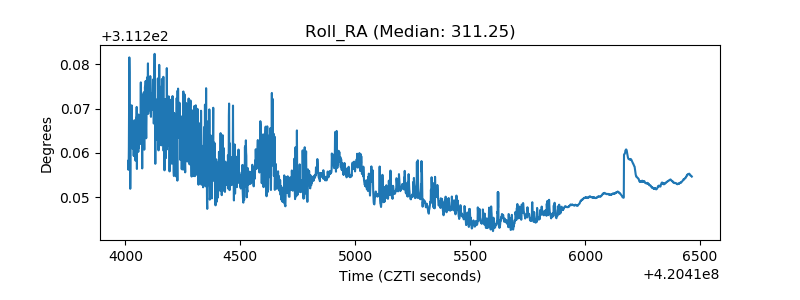 |
| Veto Counter | 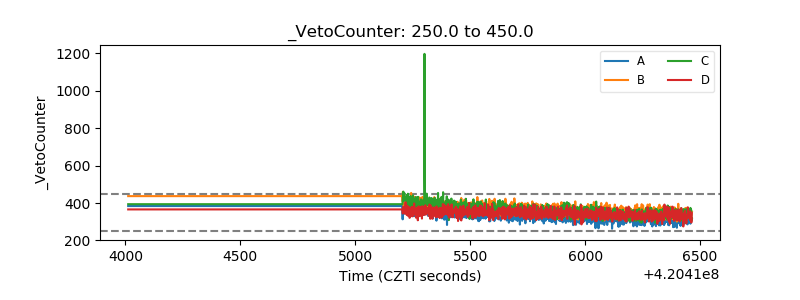 |