| Param | Original file | Final file |
|---|---|---|
| Filename | modeM0/AS1T05_101T01_9000005586_41001cztM0_level2.fits | modeM0/AS1T05_101T01_9000005586_41001cztM0_level2_quad_clean.evt |
| Size (bytes) | 192,666,240 | 55,802,880 |
| Size | 183.7 MB | 53.2 MB |
| Events in quadrant A | 1,810,013 | 373,110 |
| Events in quadrant B | 1,516,895 | 383,944 |
| Events in quadrant C | 1,665,688 | 364,726 |
| Events in quadrant D | 1,876,070 | 329,836 |
| Mode M0 | |||
|---|---|---|---|
| Quadrant | BADHDUFLAG | Total packets | Discarded packets |
| A | 0 | 7419 | 2 |
| B | 0 | 6841 | 1 |
| C | 0 | 7083 | 1 |
| D | 0 | 7947 | 1 |
| Mode SS | |||
|---|---|---|---|
| Quadrant | BADHDUFLAG | Total packets | Discarded packets |
| A | 0 | 68 | 0 |
| B | 0 | 68 | 0 |
| C | 0 | 68 | 0 |
| D | 0 | 68 | 0 |
| Mode M9 | |||
|---|---|---|---|
| Quadrant | BADHDUFLAG | Total packets | Discarded packets |
| A | 0 | 14 | 0 |
| B | 0 | 14 | 0 |
| C | 0 | 14 | 0 |
| D | 0 | 14 | 0 |
| Quadrant | Total seconds | Saturated seconds | Saturation percentage |
|---|---|---|---|
| A | 3358 | 9 | 0.268017% |
| B | 3358 | 9 | 0.268017% |
| C | 3358 | 13 | 0.387135% |
| D | 3358 | 100 | 2.977963% |
Noise dominated data is calculated using 1-second bins in cleaned event files. If a bin has >2000 counts, and if more than 50% of those come from <1% of pixels, then it is considered to be noise-dominated and hence unusable.
| Quadrant | # 1 sec bins | Bins with >0 counts | Bins with >2000 counts | High rate bins dominated by noise | Noise dominated (total time) | Noise dominated (detector-on time) | Marked lightcurve |
|---|---|---|---|---|---|---|---|
| A | 4732 | 3359 | 2 | 2 | 0.04% | 0.06% | 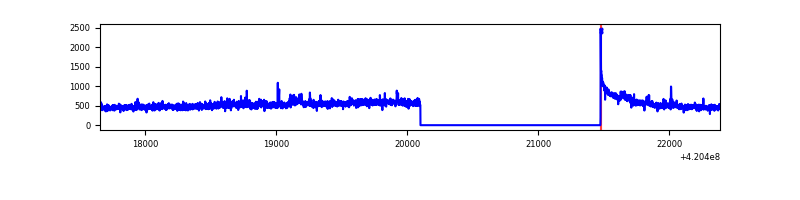 |
| B | 4732 | 3358 | 5 | 5 | 0.11% | 0.15% | 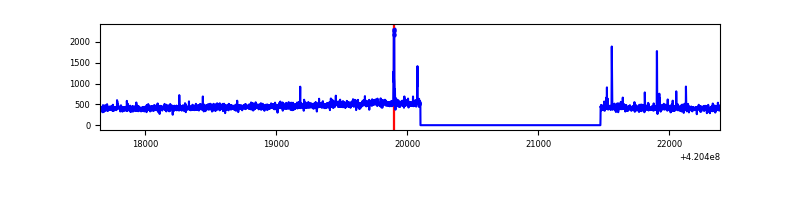 |
| C | 4731 | 3357 | 7 | 7 | 0.15% | 0.21% | 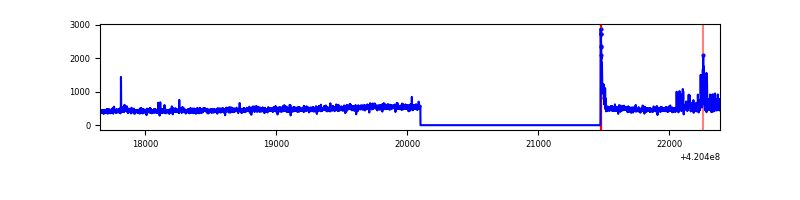 |
| D | 4732 | 3359 | 92 | 92 | 1.94% | 2.74% | 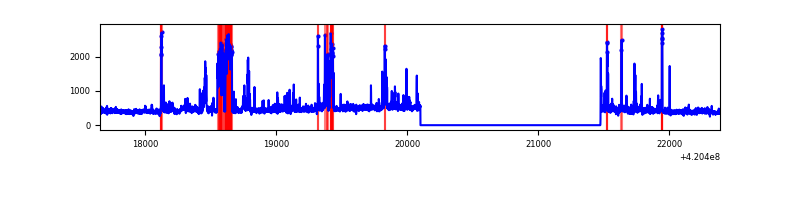 |
Top three noisy pixels from each quadrant. If the there are fewer than three noisy pixels in the level2.evt file, extra rows are filled as -1
| Pixel properties | Quadrant properties | ||||||
|---|---|---|---|---|---|---|---|
| Quadrant | DetID | PixID | Counts | Sigma | Mean | Median | Sigma |
| A | 10 | 83 | 305356 | 3931.33 | 374 | 365 | 77.6 |
| A | 12 | 189 | 46229 | 591.19 | 374 | 365 | 77.6 |
| A | 13 | 248 | 5816 | 70.26 | 374 | 365 | 77.6 |
| B | 5 | 255 | 19361 | 261.84 | 370 | 359 | 72.6 |
| B | 5 | 32 | 16459 | 221.85 | 370 | 359 | 72.6 |
| B | 0 | 189 | 13805 | 185.28 | 370 | 359 | 72.6 |
| C | 15 | 214 | 144758 | 1686.3 | 361 | 363 | 85.6 |
| C | 14 | 254 | 74565 | 866.56 | 361 | 363 | 85.6 |
| C | 0 | 10 | 32419 | 374.36 | 361 | 363 | 85.6 |
| D | 13 | 249 | 302427 | 3463.64 | 359 | 348 | 87.2 |
| D | 2 | 249 | 63599 | 725.24 | 359 | 348 | 87.2 |
| D | 1 | 47 | 54259 | 618.14 | 359 | 348 | 87.2 |
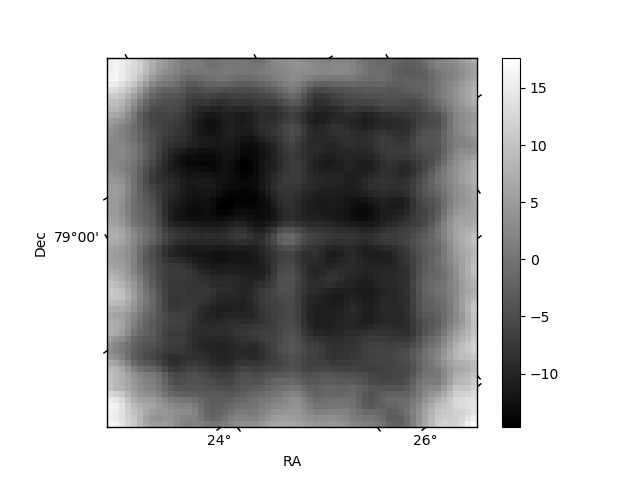
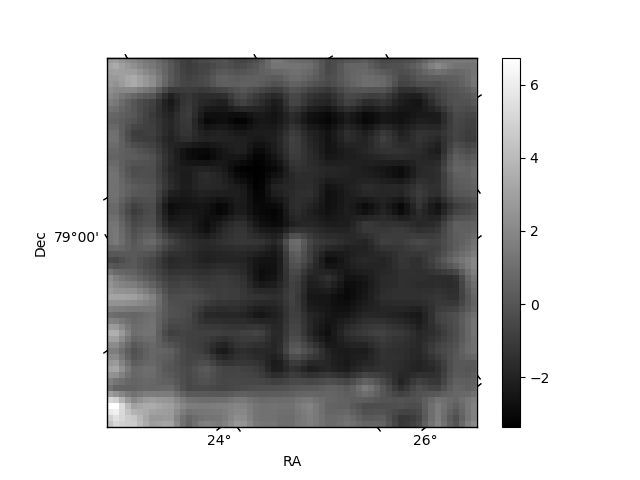
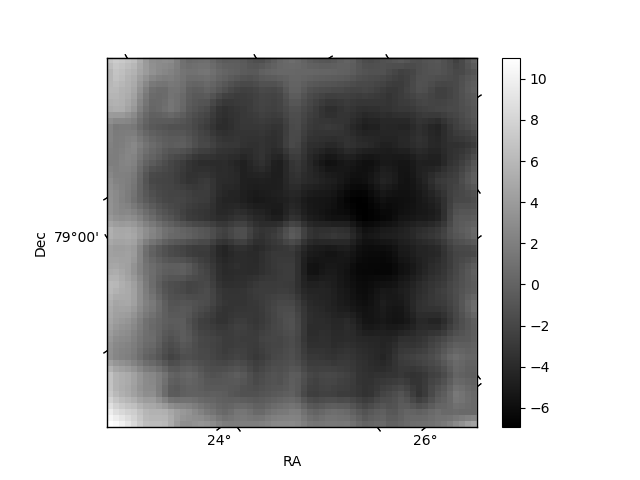
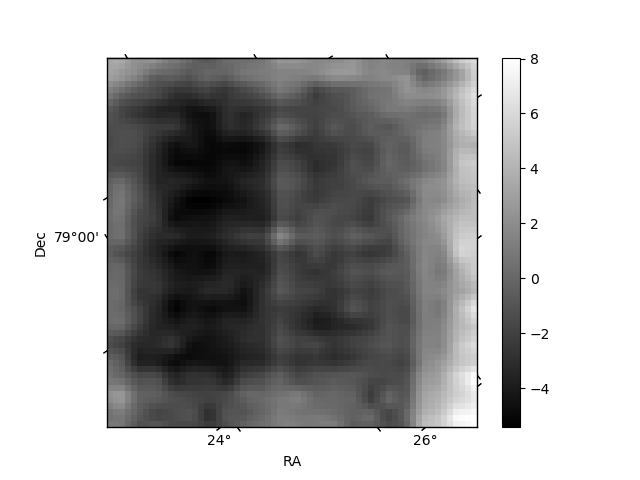
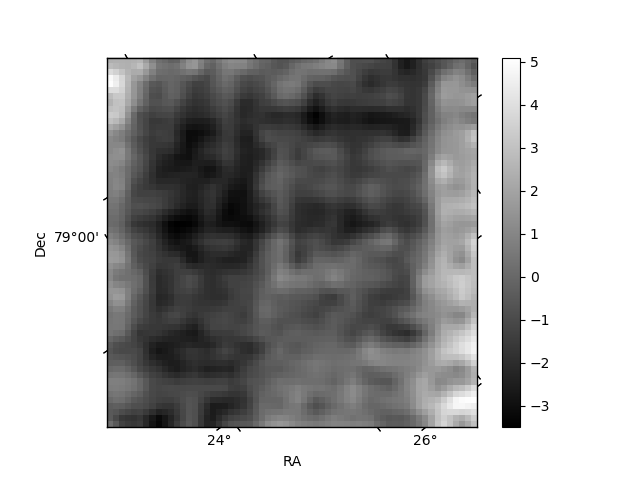
Histogram calculated using DETX and DETY for each event in the final _common_clean file
| Quadrant A | 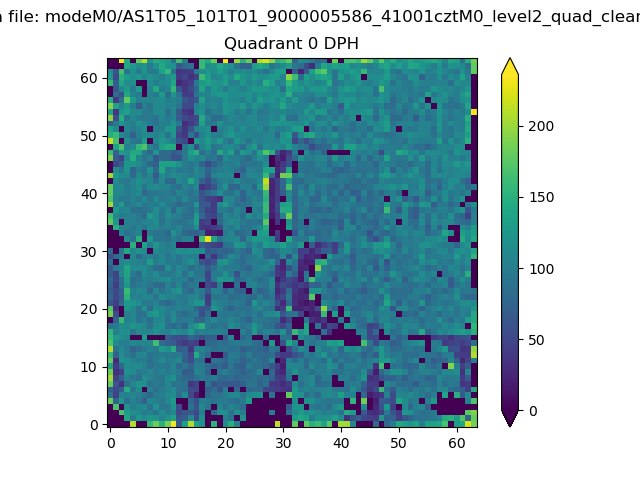 |
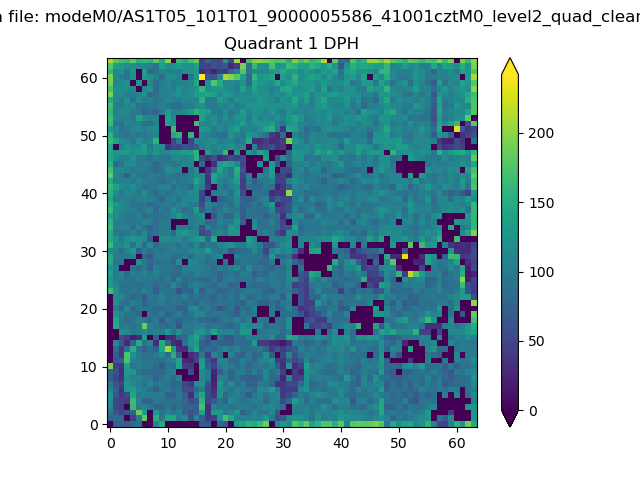 |
Quadrant B |
|---|---|---|---|
| Quadrant D | 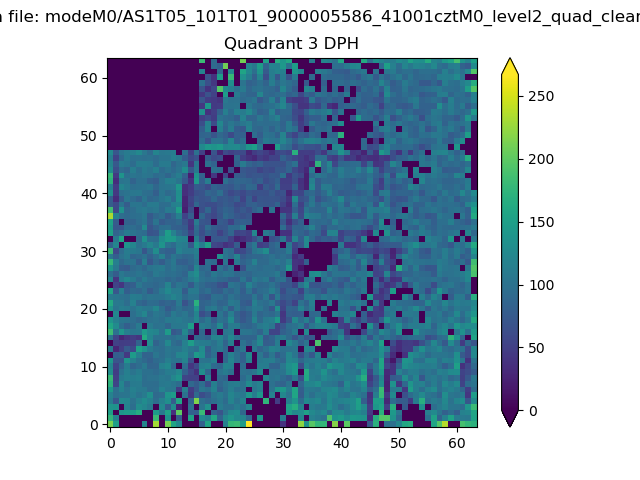 |
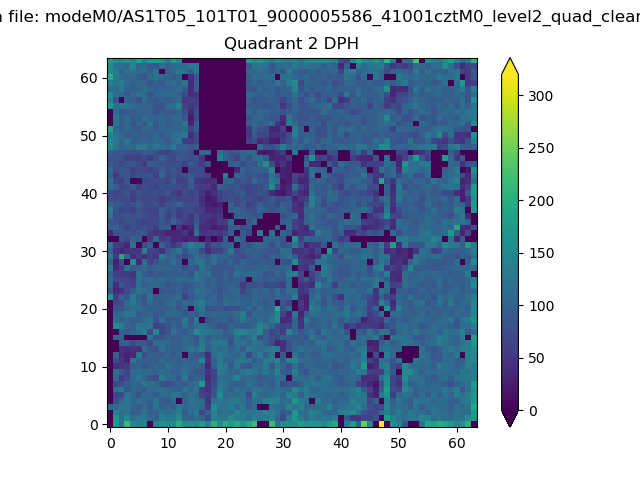 |
Quadrant C |
| Plot type | Count rate plots | Images |
|---|---|---|
| Comparison with Poisson distribution Blue bars denote a histogram of data divided into 1 sec bins. Red curve is a Poisson curve with rate = median count rate of data. |
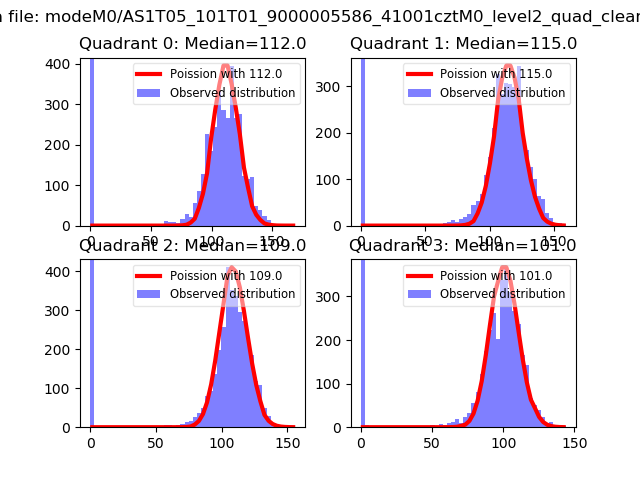 |
 |
| Quadrant-wise count rates Data is divided into 100 sec bins |
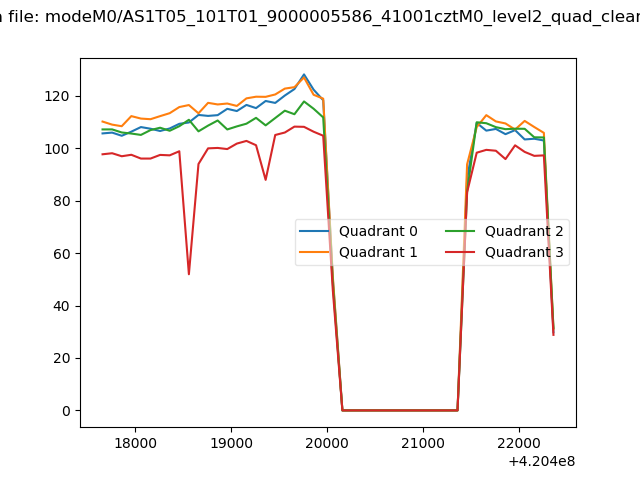 |
|
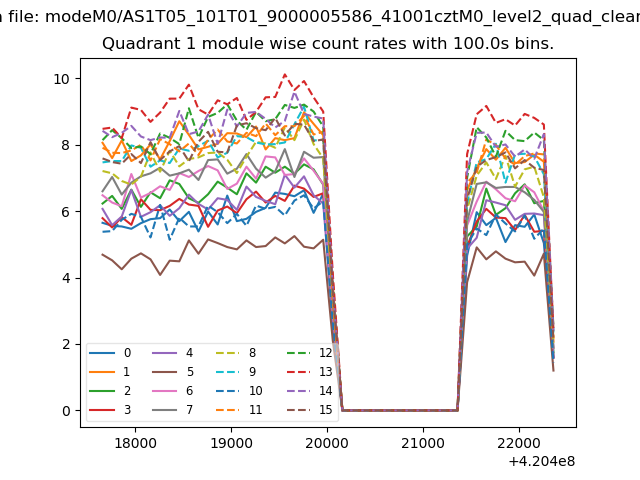
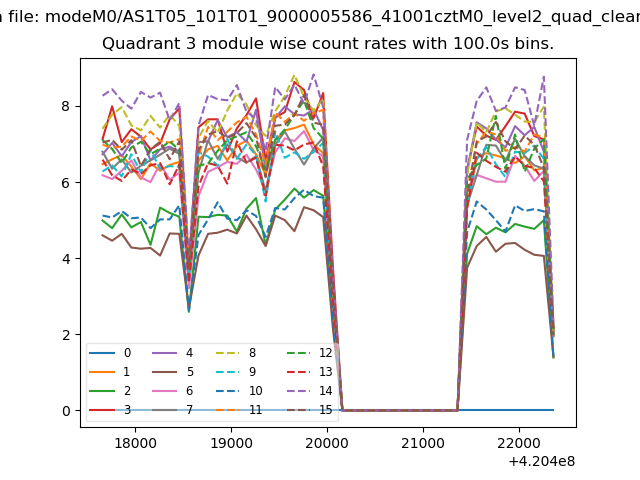
| Module-wise count rates for Quadrant A Data is divided into 100 sec bins |
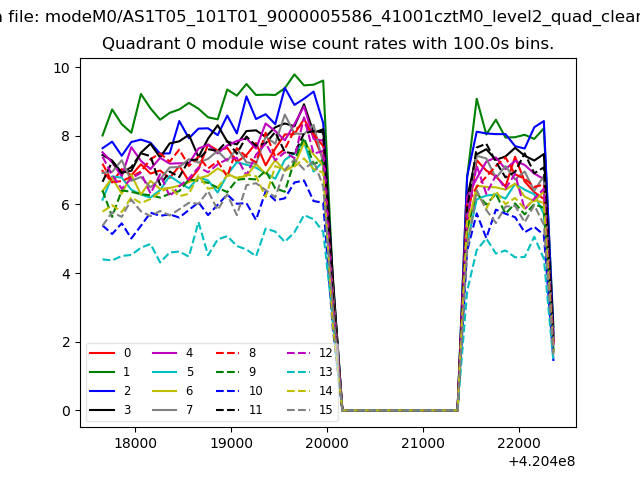 |
 |
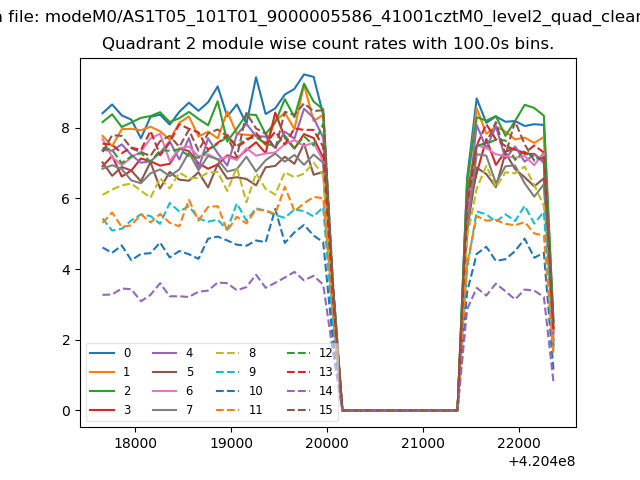
| Module-wise count rates for Quadrant B Data is divided into 100 sec bins |
 |
 |
| Module-wise count rates for Quadrant C Data is divided into 100 sec bins |
 |
 |
| Module-wise count rates for Quadrant D Data is divided into 100 sec bins |
 |
 |
| Parameter | Plot |
|---|---|
| CZT HV Monitor | 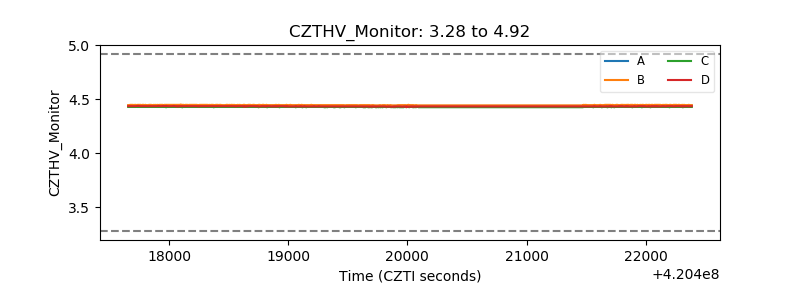 |
| D_VDD | 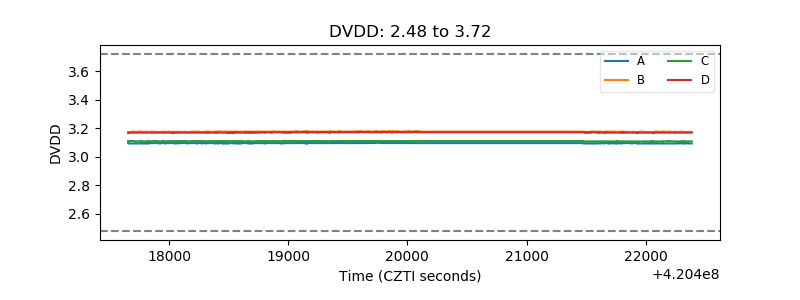 |
| Temperature 1 | 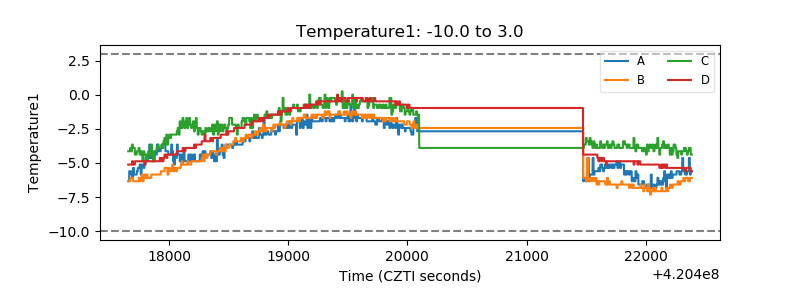 |
| Veto HV Monitor | 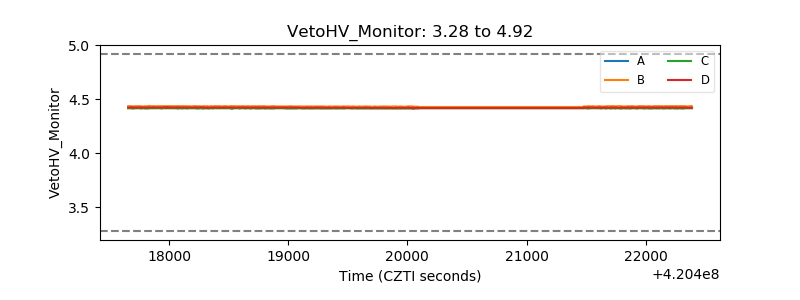 |
| Veto LLD | 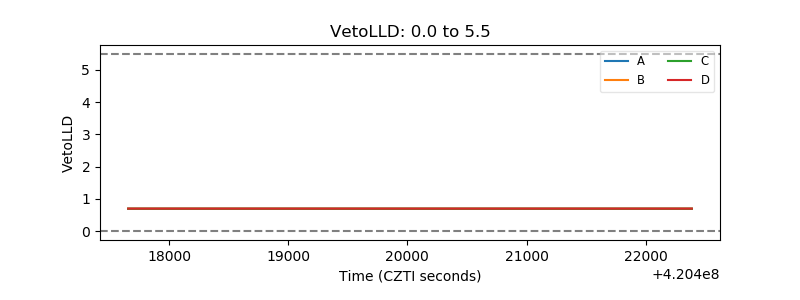 |
| Alpha Counter | 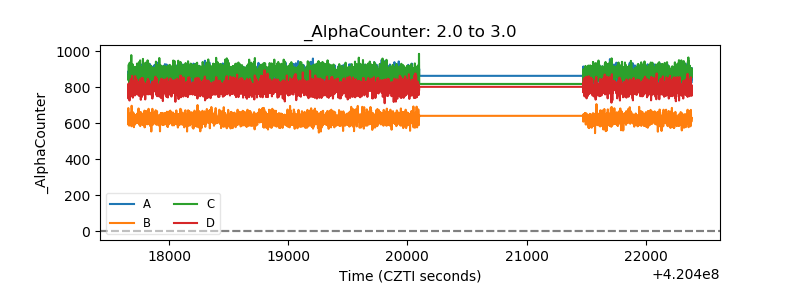 |
| _CPM_Rate | 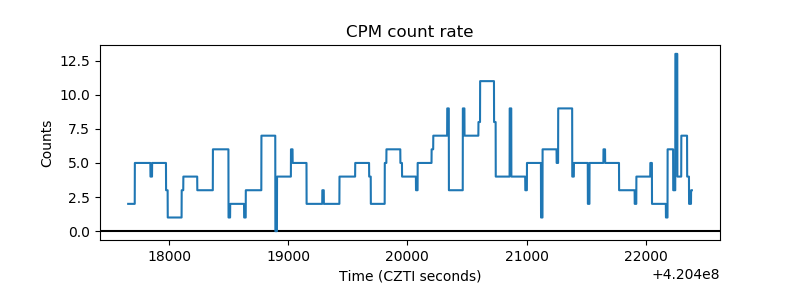 |
| CZT Counter | 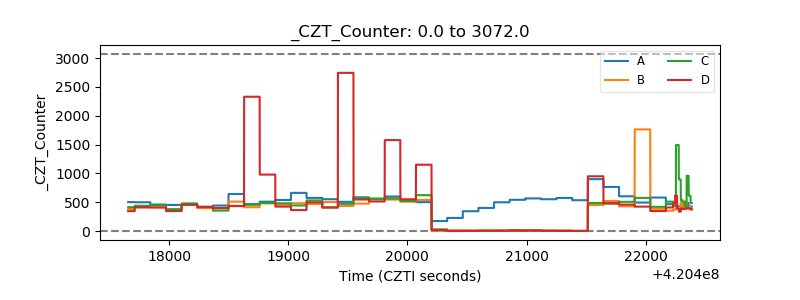 |
| +2.5 Volts monitor |  |
| +5 Volts monitor |  |
| _ROLL_ROT | 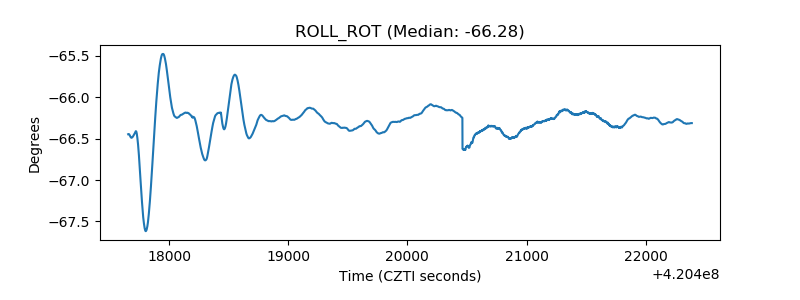 |
| _Roll_DEC | 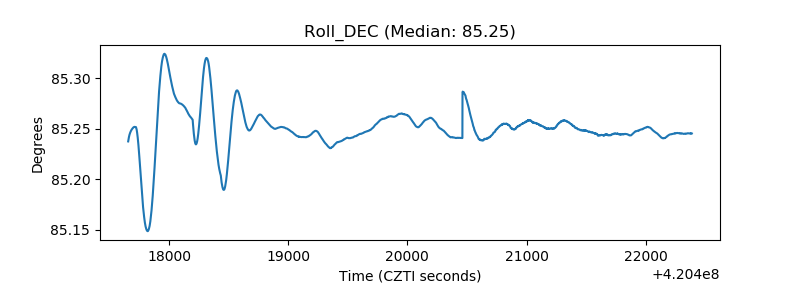 |
| _Roll_RA | 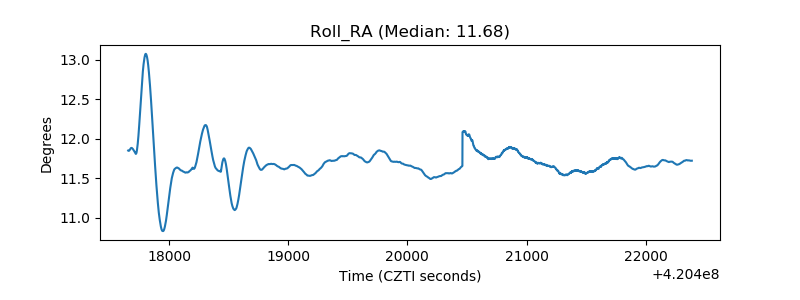 |
| Veto Counter | 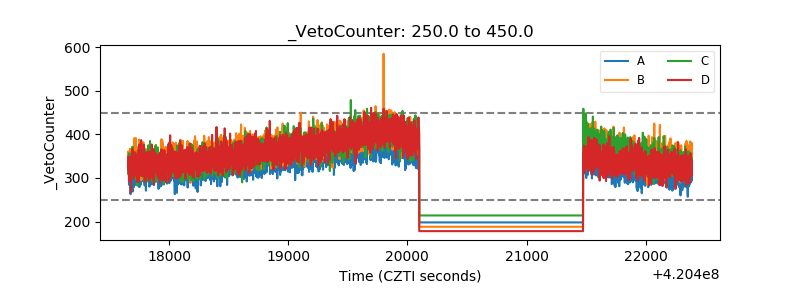 |