| Param | Original file | Final file |
|---|---|---|
| Filename | modeM0/AS1T05_101T01_9000005586_41002cztM0_level2.fits | modeM0/AS1T05_101T01_9000005586_41002cztM0_level2_quad_clean.evt |
| Size (bytes) | 340,050,240 | 97,462,080 |
| Size | 324.3 MB | 92.9 MB |
| Events in quadrant A | 3,096,389 | 644,813 |
| Events in quadrant B | 2,639,601 | 662,613 |
| Events in quadrant C | 2,897,229 | 639,189 |
| Events in quadrant D | 3,484,452 | 582,747 |
| Mode M0 | |||
|---|---|---|---|
| Quadrant | BADHDUFLAG | Total packets | Discarded packets |
| A | 0 | 13006 | 3 |
| B | 0 | 12341 | 2 |
| C | 0 | 12590 | 2 |
| D | 0 | 14928 | 2 |
| Mode SS | |||
|---|---|---|---|
| Quadrant | BADHDUFLAG | Total packets | Discarded packets |
| A | 0 | 124 | 0 |
| B | 0 | 124 | 0 |
| C | 0 | 124 | 0 |
| D | 0 | 124 | 0 |
| Mode M9 | |||
|---|---|---|---|
| Quadrant | BADHDUFLAG | Total packets | Discarded packets |
| A | 0 | 25 | 0 |
| B | 0 | 25 | 0 |
| C | 0 | 25 | 0 |
| D | 0 | 26 | 0 |
| Quadrant | Total seconds | Saturated seconds | Saturation percentage |
|---|---|---|---|
| A | 6030 | 9 | 0.149254% |
| B | 6030 | 21 | 0.348259% |
| C | 6030 | 19 | 0.315091% |
| D | 6030 | 138 | 2.288557% |
Noise dominated data is calculated using 1-second bins in cleaned event files. If a bin has >2000 counts, and if more than 50% of those come from <1% of pixels, then it is considered to be noise-dominated and hence unusable.
| Quadrant | # 1 sec bins | Bins with >0 counts | Bins with >2000 counts | High rate bins dominated by noise | Noise dominated (total time) | Noise dominated (detector-on time) | Marked lightcurve |
|---|---|---|---|---|---|---|---|
| A | 7342 | 6031 | 4 | 4 | 0.05% | 0.07% | 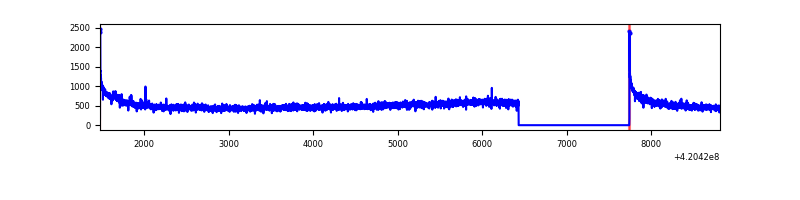 |
| B | 7341 | 6030 | 7 | 7 | 0.10% | 0.12% | 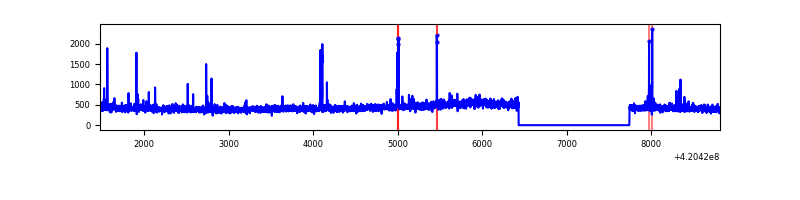 |
| C | 7341 | 6030 | 13 | 13 | 0.18% | 0.22% | 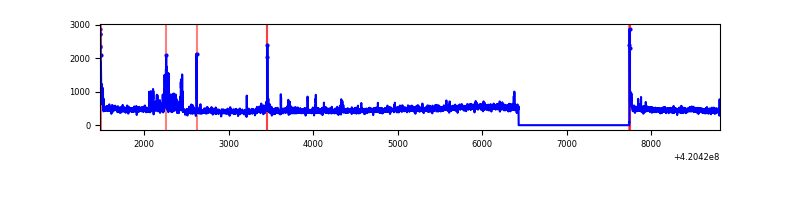 |
| D | 7342 | 6031 | 140 | 140 | 1.91% | 2.32% | 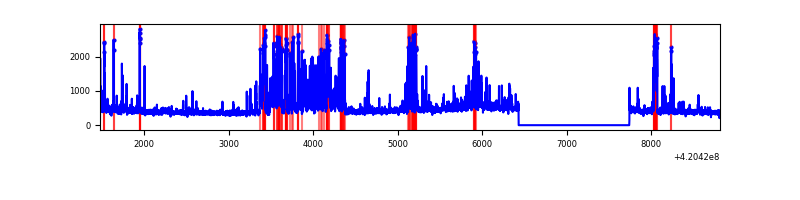 |
Top three noisy pixels from each quadrant. If the there are fewer than three noisy pixels in the level2.evt file, extra rows are filled as -1
| Pixel properties | Quadrant properties | ||||||
|---|---|---|---|---|---|---|---|
| Quadrant | DetID | PixID | Counts | Sigma | Mean | Median | Sigma |
| A | 10 | 83 | 573118 | 4309.03 | 642 | 625 | 132.9 |
| A | 12 | 189 | 27614 | 203.14 | 642 | 625 | 132.9 |
| A | 13 | 252 | 11706 | 83.4 | 642 | 625 | 132.9 |
| B | 5 | 255 | 65806 | 522.9 | 642 | 625 | 124.7 |
| B | 0 | 186 | 25924 | 202.95 | 642 | 625 | 124.7 |
| B | 12 | 111 | 16005 | 123.38 | 642 | 625 | 124.7 |
| C | 15 | 214 | 260970 | 1771.34 | 629 | 632 | 147.0 |
| C | 14 | 254 | 107832 | 729.39 | 629 | 632 | 147.0 |
| C | 0 | 10 | 48180 | 323.52 | 629 | 632 | 147.0 |
| D | 13 | 249 | 770960 | 5094.09 | 621 | 603 | 151.2 |
| D | 2 | 249 | 160365 | 1056.45 | 621 | 603 | 151.2 |
| D | 12 | 233 | 72927 | 478.25 | 621 | 603 | 151.2 |
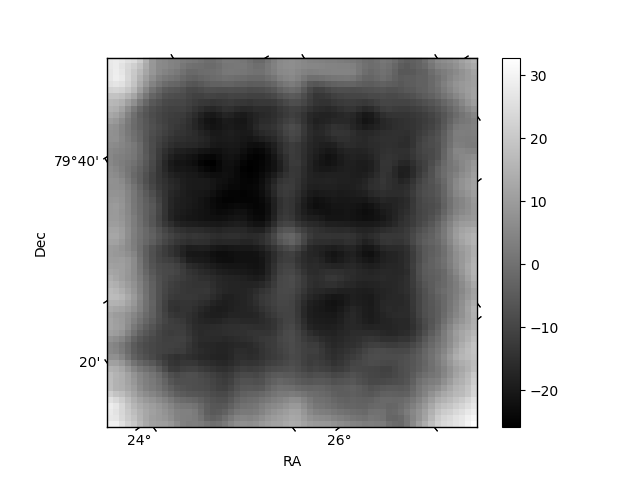
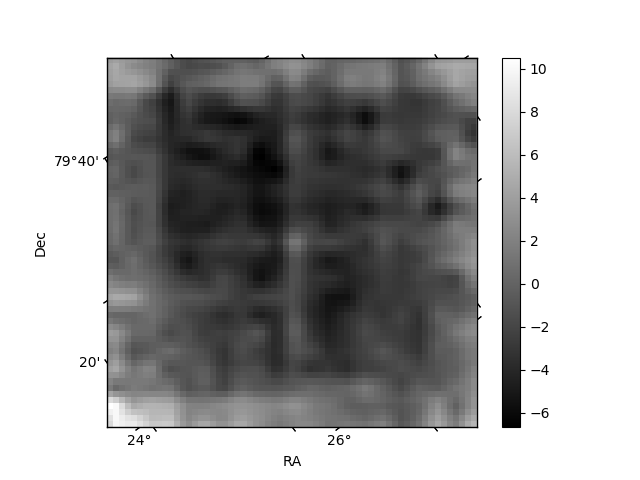
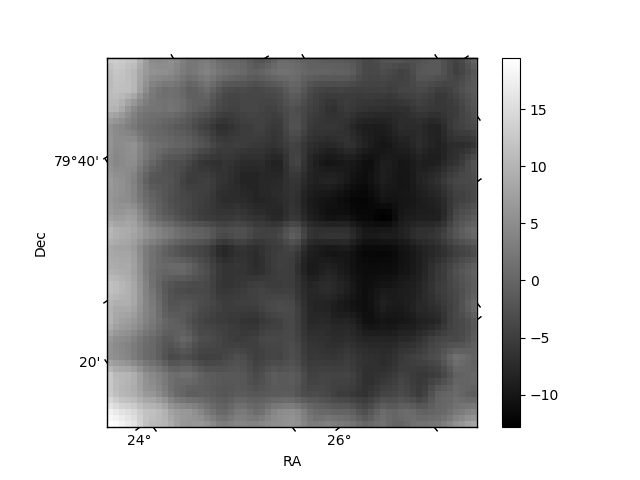
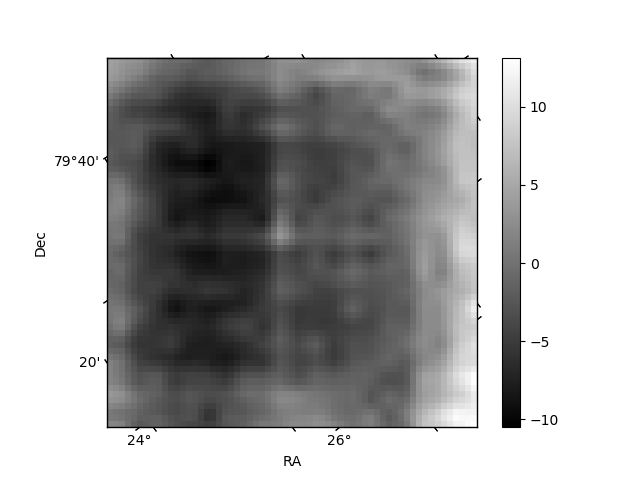
Histogram calculated using DETX and DETY for each event in the final _common_clean file
| Quadrant A | 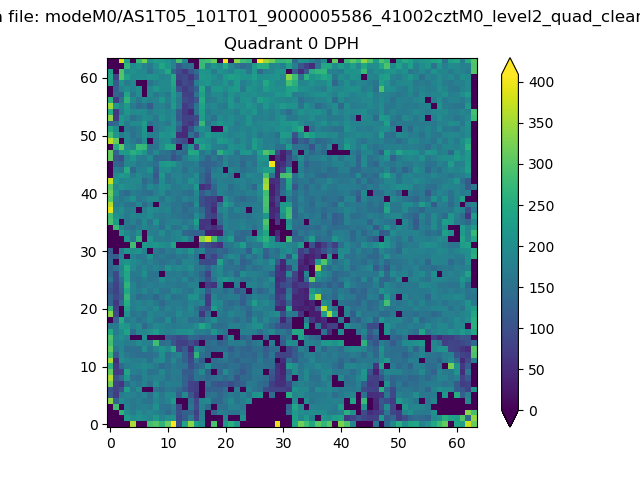 |
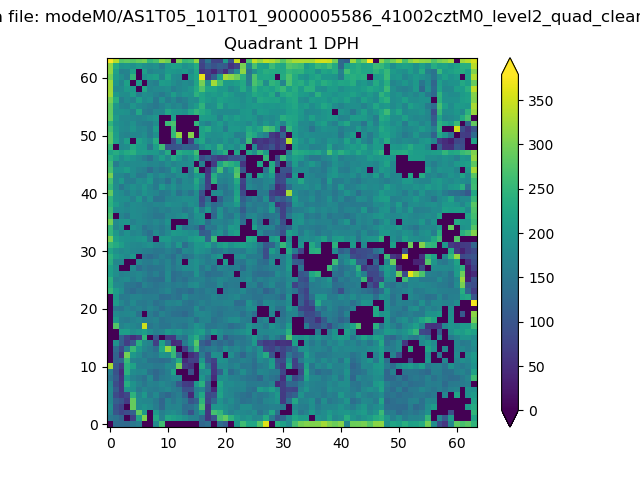 |
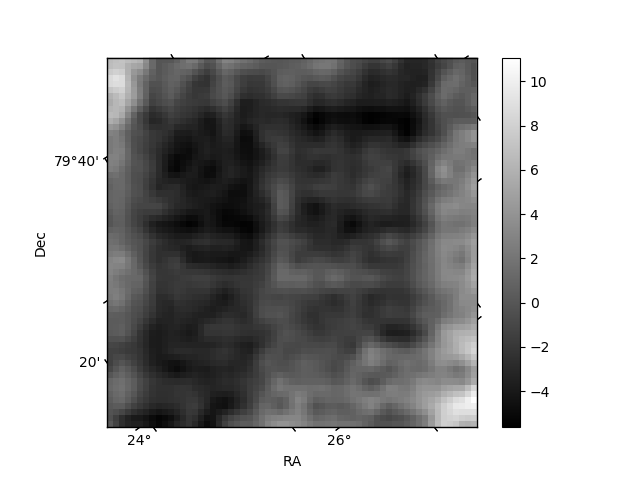
Quadrant B |
|---|---|---|---|
| Quadrant D | 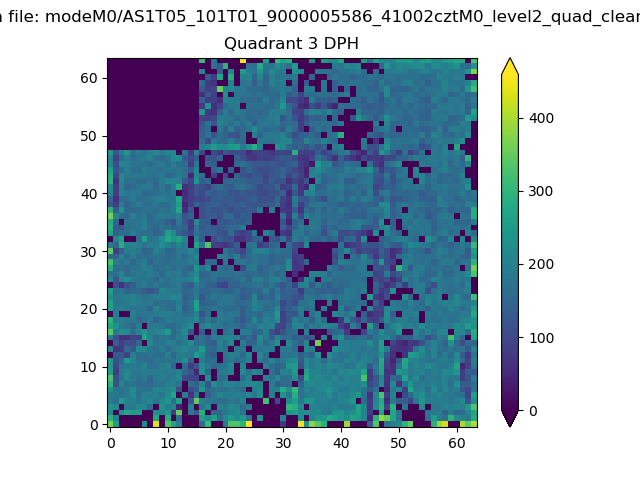 |
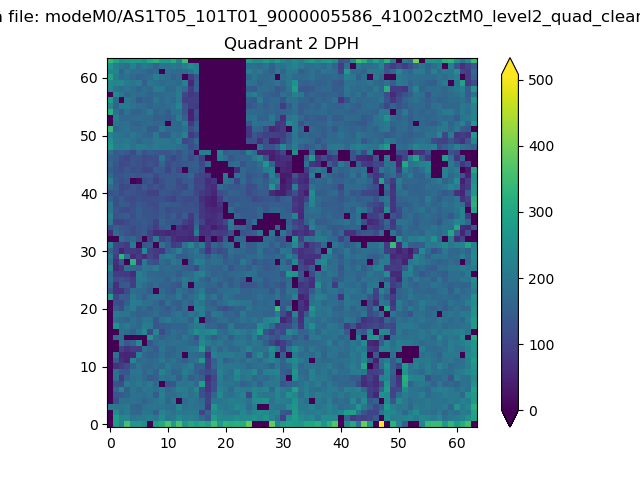 |
Quadrant C |
| Plot type | Count rate plots | Images |
|---|---|---|
| Comparison with Poisson distribution Blue bars denote a histogram of data divided into 1 sec bins. Red curve is a Poisson curve with rate = median count rate of data. |
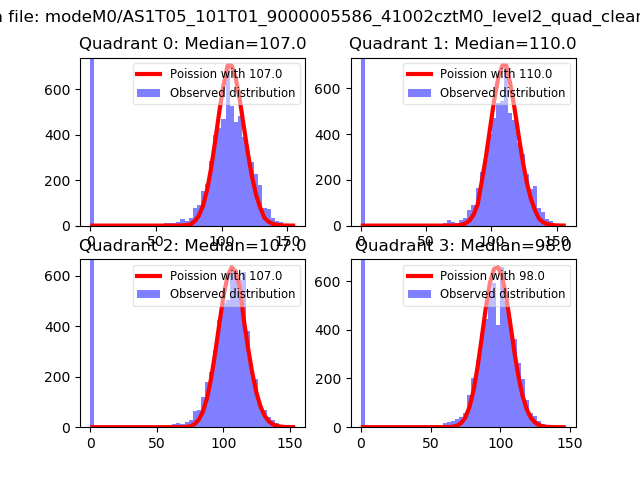 |
 |
| Quadrant-wise count rates Data is divided into 100 sec bins |
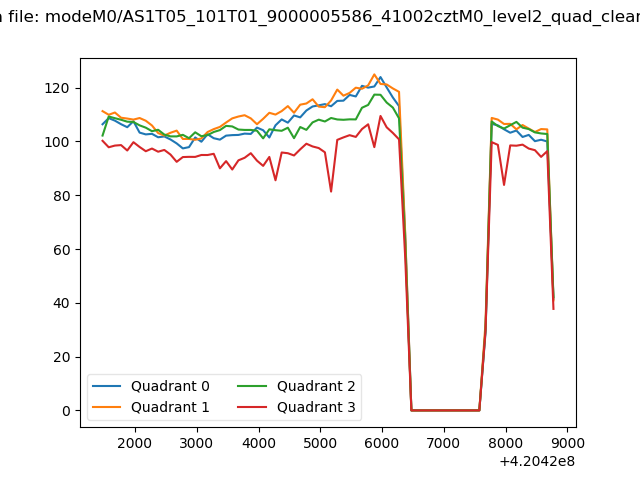 |
|
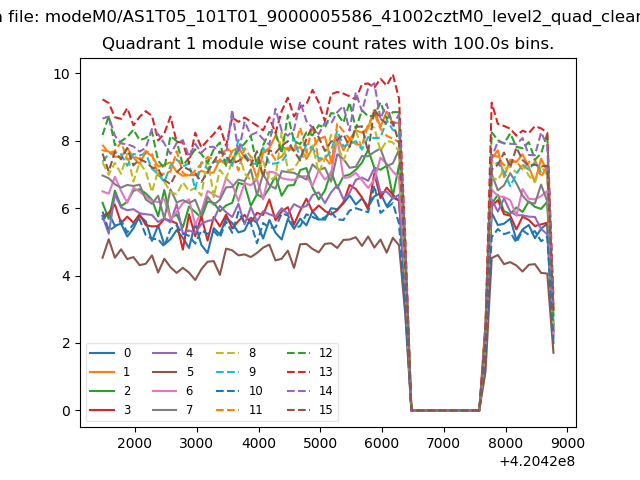
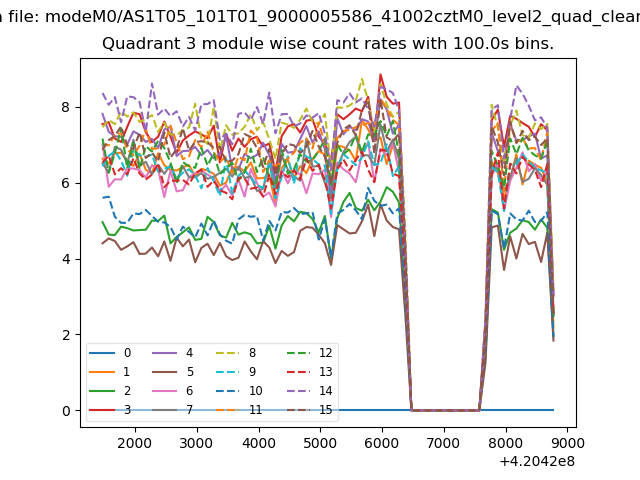
| Module-wise count rates for Quadrant A Data is divided into 100 sec bins |
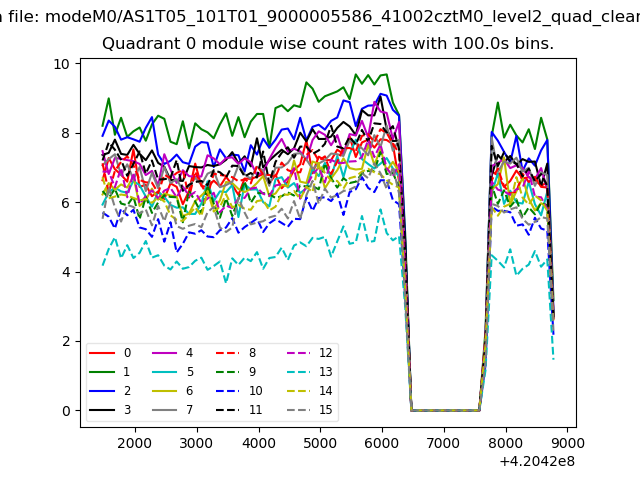 |
 |
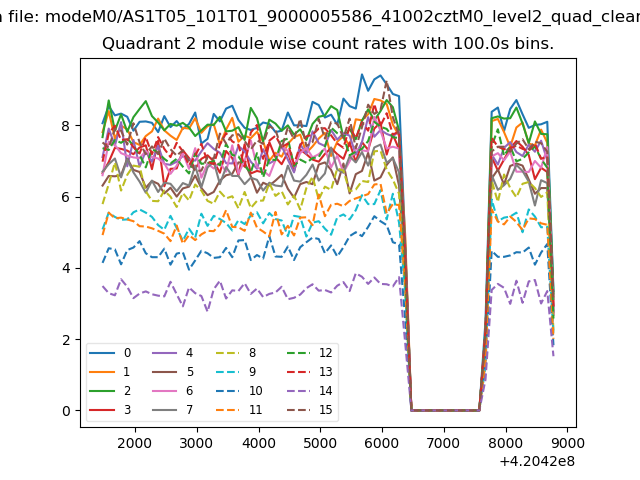
| Module-wise count rates for Quadrant B Data is divided into 100 sec bins |
 |
 |
| Module-wise count rates for Quadrant C Data is divided into 100 sec bins |
 |
 |
| Module-wise count rates for Quadrant D Data is divided into 100 sec bins |
 |
 |
| Parameter | Plot |
|---|---|
| CZT HV Monitor | 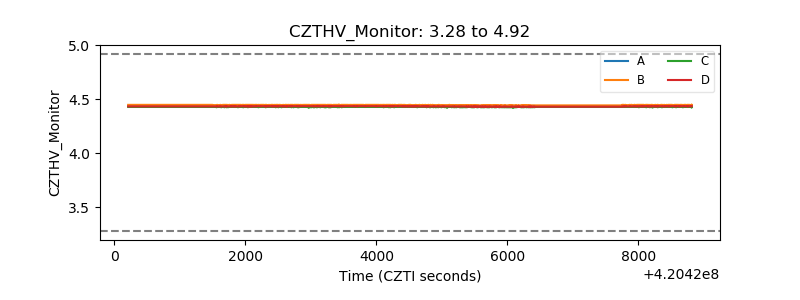 |
| D_VDD | 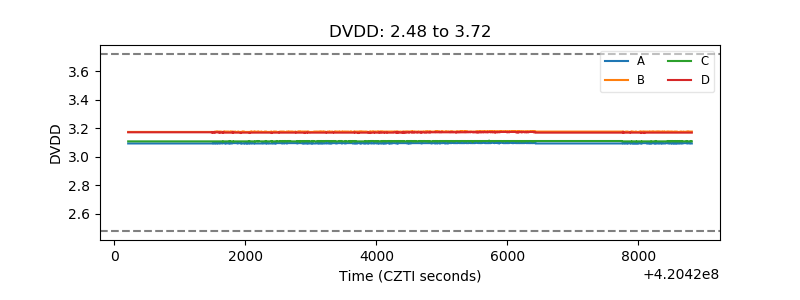 |
| Temperature 1 | 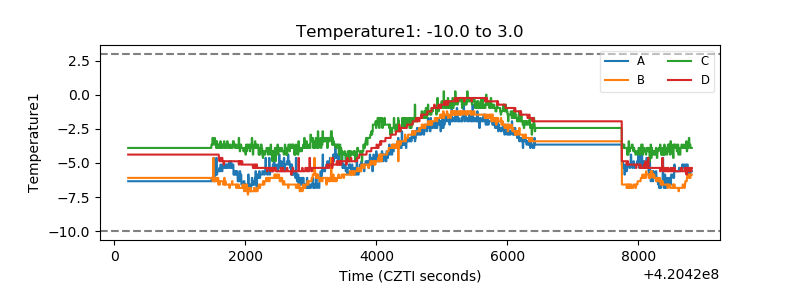 |
| Veto HV Monitor | 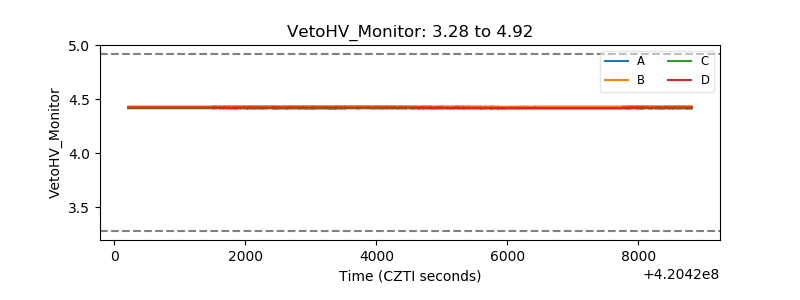 |
| Veto LLD | 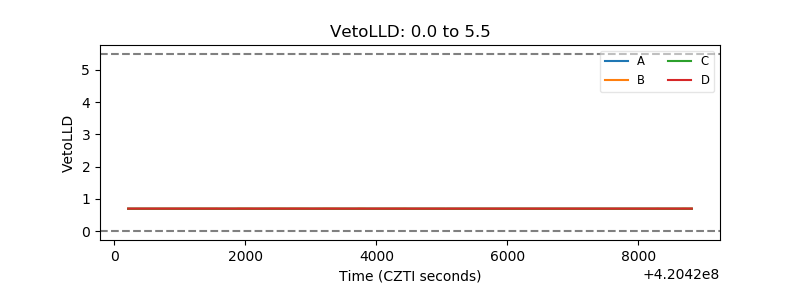 |
| Alpha Counter | 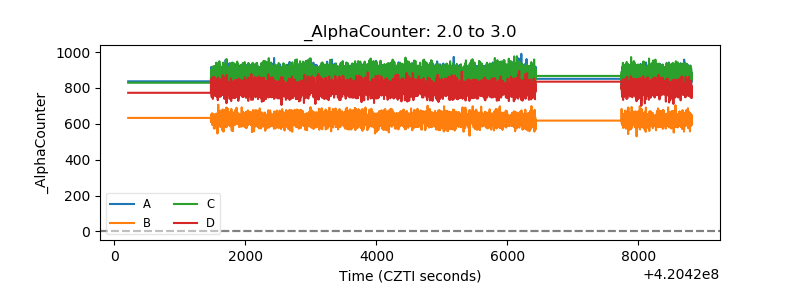 |
| _CPM_Rate | 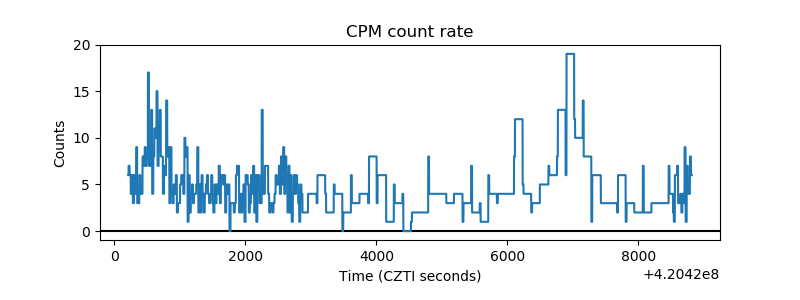 |
| CZT Counter | 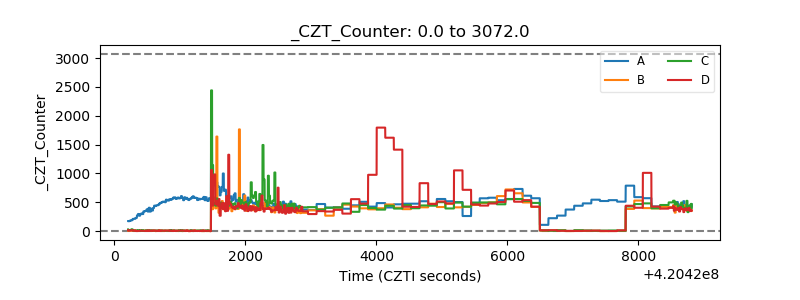 |
| +2.5 Volts monitor |  |
| +5 Volts monitor | 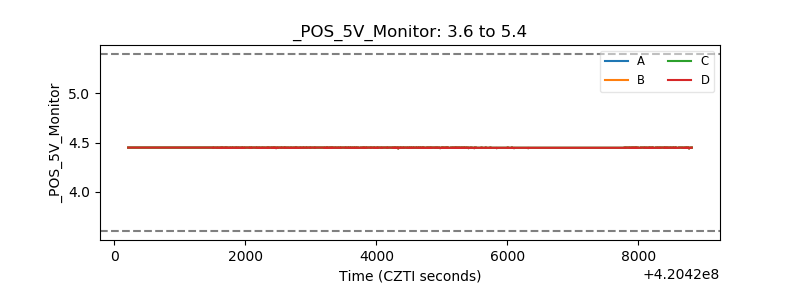 |
| _ROLL_ROT | 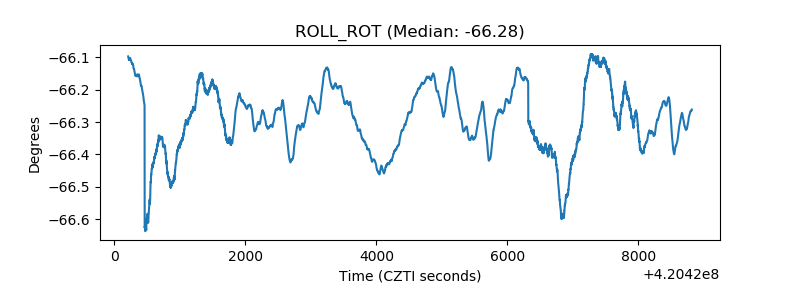 |
| _Roll_DEC | 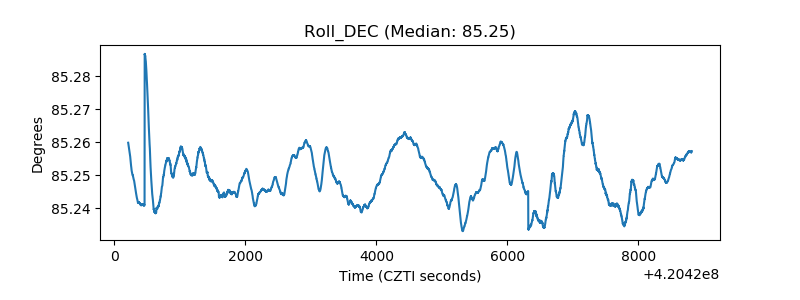 |
| _Roll_RA | 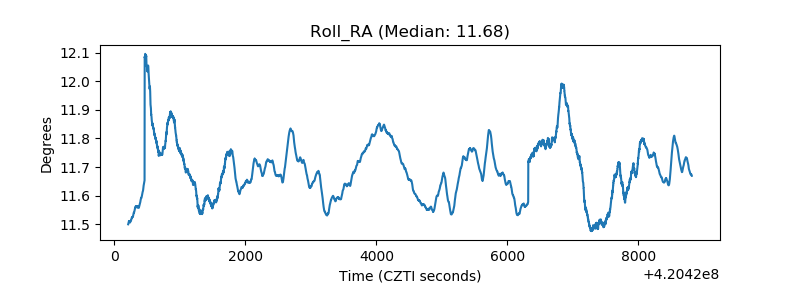 |
| Veto Counter | 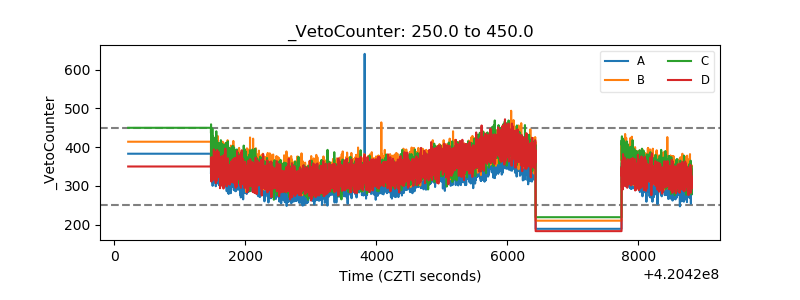 |