| Param | Original file | Final file |
|---|---|---|
| Filename | modeM0/AS1T05_101T01_9000005586_41005cztM0_level2.fits | modeM0/AS1T05_101T01_9000005586_41005cztM0_level2_quad_clean.evt |
| Size (bytes) | 521,208,000 | 154,886,400 |
| Size | 497.1 MB | 147.7 MB |
| Events in quadrant A | 4,948,765 | 1,035,780 |
| Events in quadrant B | 4,205,141 | 1,056,021 |
| Events in quadrant C | 4,679,621 | 1,013,717 |
| Events in quadrant D | 4,711,322 | 916,142 |
| Mode M0 | |||
|---|---|---|---|
| Quadrant | BADHDUFLAG | Total packets | Discarded packets |
| A | 0 | 20447 | 5 |
| B | 0 | 19542 | 2 |
| C | 0 | 20308 | 2 |
| D | 0 | 21376 | 2 |
| Mode SS | |||
|---|---|---|---|
| Quadrant | BADHDUFLAG | Total packets | Discarded packets |
| A | 0 | 196 | 0 |
| B | 0 | 196 | 0 |
| C | 0 | 196 | 0 |
| D | 0 | 196 | 0 |
| Mode M9 | |||
|---|---|---|---|
| Quadrant | BADHDUFLAG | Total packets | Discarded packets |
| A | 0 | 27 | 0 |
| B | 0 | 27 | 0 |
| C | 0 | 27 | 0 |
| D | 0 | 27 | 0 |
| Quadrant | Total seconds | Saturated seconds | Saturation percentage |
|---|---|---|---|
| A | 9631 | 11 | 0.114215% |
| B | 9633 | 11 | 0.114191% |
| C | 9633 | 54 | 0.560573% |
| D | 9633 | 162 | 1.681719% |
Noise dominated data is calculated using 1-second bins in cleaned event files. If a bin has >2000 counts, and if more than 50% of those come from <1% of pixels, then it is considered to be noise-dominated and hence unusable.
| Quadrant | # 1 sec bins | Bins with >0 counts | Bins with >2000 counts | High rate bins dominated by noise | Noise dominated (total time) | Noise dominated (detector-on time) | Marked lightcurve |
|---|---|---|---|---|---|---|---|
| A | 12288 | 9634 | 4 | 4 | 0.03% | 0.04% | 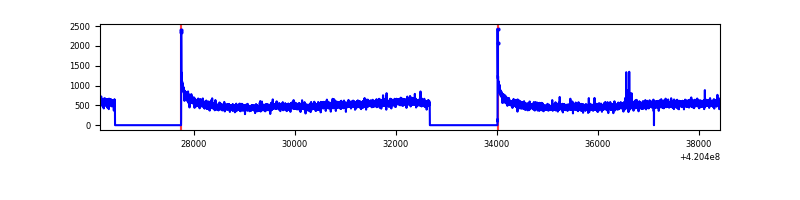 |
| B | 12288 | 9635 | 2 | 2 | 0.02% | 0.02% | 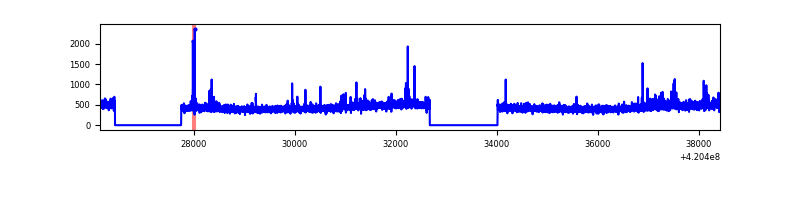 |
| C | 12288 | 9635 | 41 | 41 | 0.33% | 0.43% | 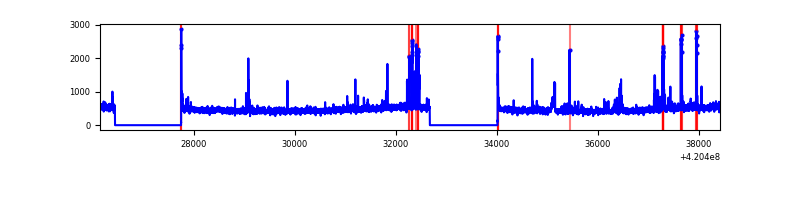 |
| D | 12288 | 9635 | 148 | 148 | 1.20% | 1.54% | 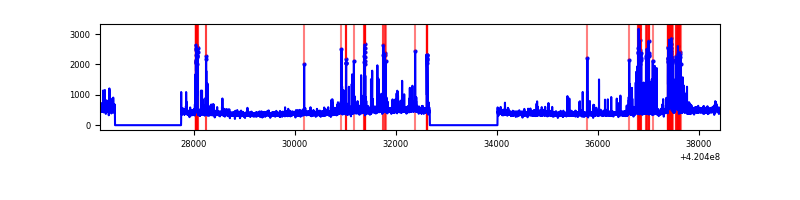 |
Top three noisy pixels from each quadrant. If the there are fewer than three noisy pixels in the level2.evt file, extra rows are filled as -1
| Pixel properties | Quadrant properties | ||||||
|---|---|---|---|---|---|---|---|
| Quadrant | DetID | PixID | Counts | Sigma | Mean | Median | Sigma |
| A | 10 | 83 | 844866 | 3951.08 | 1044 | 1022 | 213.6 |
| A | 13 | 252 | 29429 | 133.01 | 1044 | 1022 | 213.6 |
| A | 13 | 254 | 16207 | 71.1 | 1044 | 1022 | 213.6 |
| B | 0 | 186 | 74514 | 365.57 | 1038 | 1009 | 201.1 |
| B | 5 | 255 | 37771 | 182.83 | 1038 | 1009 | 201.1 |
| B | 12 | 111 | 25566 | 122.13 | 1038 | 1009 | 201.1 |
| C | 15 | 214 | 410551 | 1732.94 | 1013 | 1015 | 236.3 |
| C | 14 | 254 | 159518 | 670.7 | 1013 | 1015 | 236.3 |
| C | 12 | 249 | 84031 | 351.28 | 1013 | 1015 | 236.3 |
| D | 12 | 233 | 358809 | 1456.19 | 1012 | 981 | 245.7 |
| D | 2 | 249 | 212406 | 860.4 | 1012 | 981 | 245.7 |
| D | 13 | 249 | 100218 | 403.85 | 1012 | 981 | 245.7 |
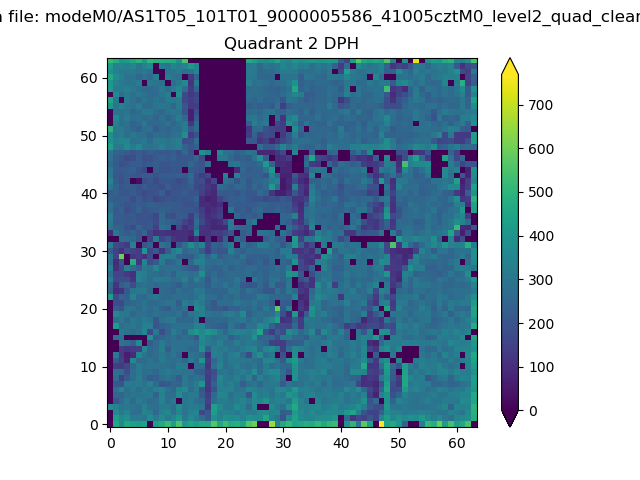
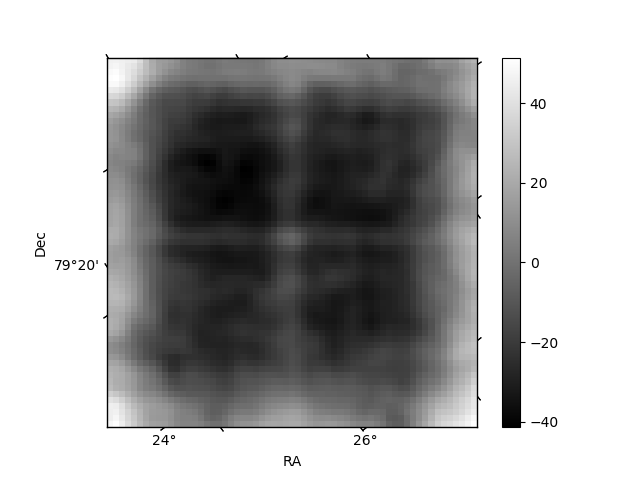
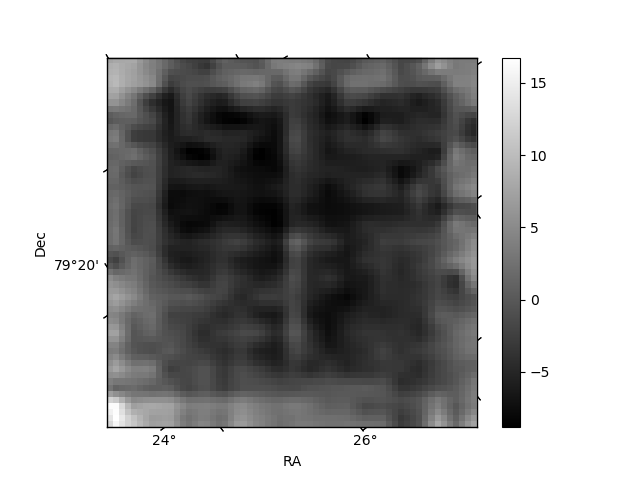
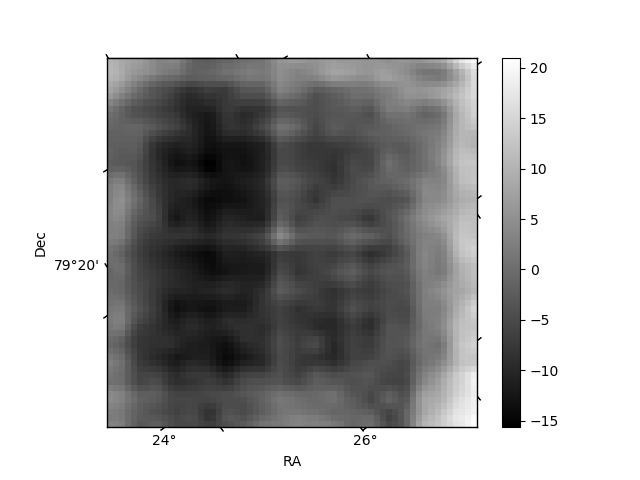
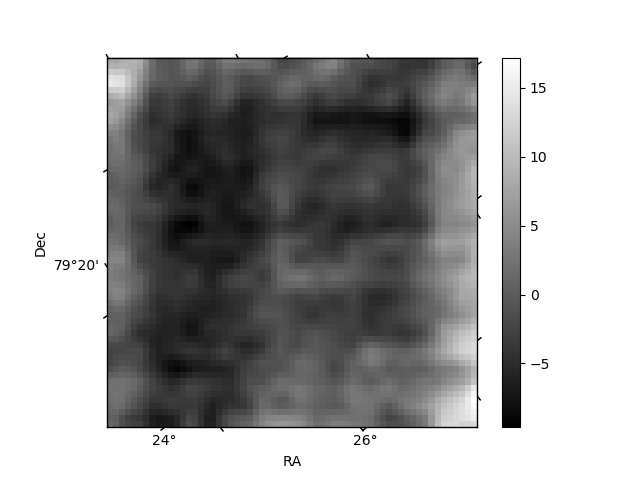
Histogram calculated using DETX and DETY for each event in the final _common_clean file
| Quadrant A | 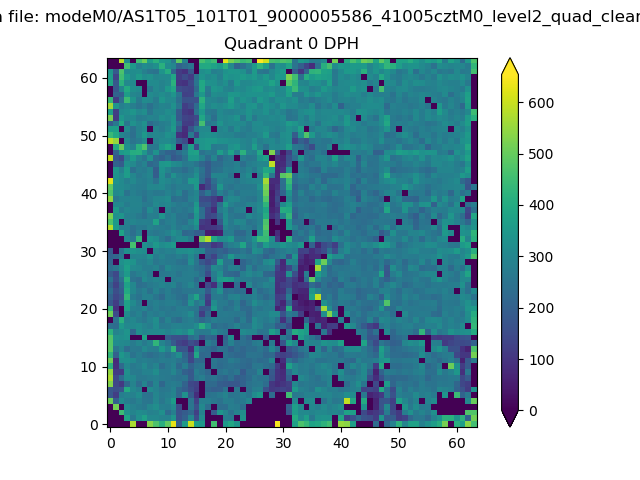 |
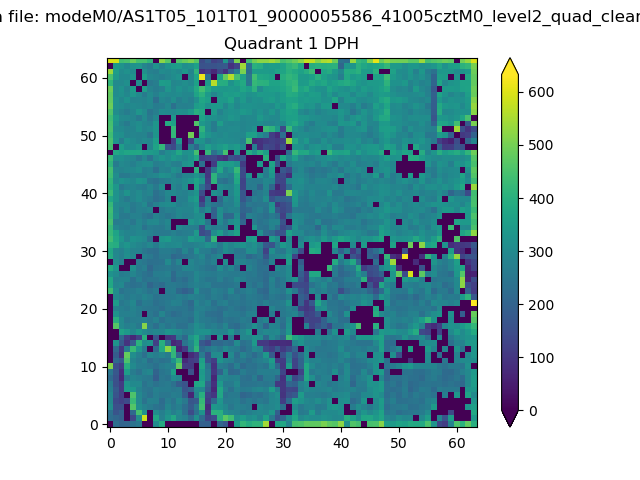 |
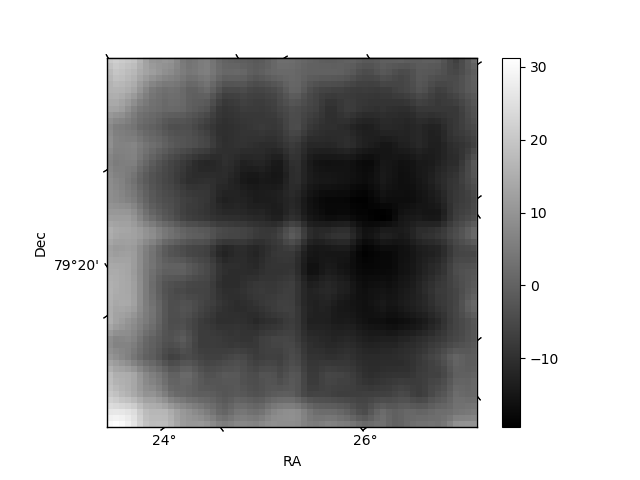
Quadrant B |
|---|---|---|---|
| Quadrant D | 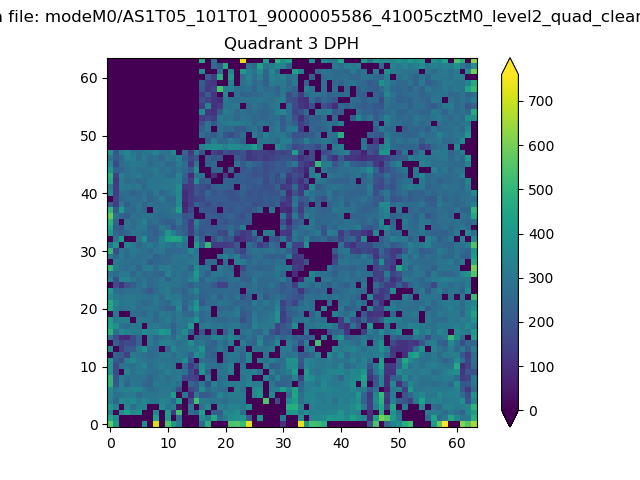 |
 |
Quadrant C |
| Plot type | Count rate plots | Images |
|---|---|---|
| Comparison with Poisson distribution Blue bars denote a histogram of data divided into 1 sec bins. Red curve is a Poisson curve with rate = median count rate of data. |
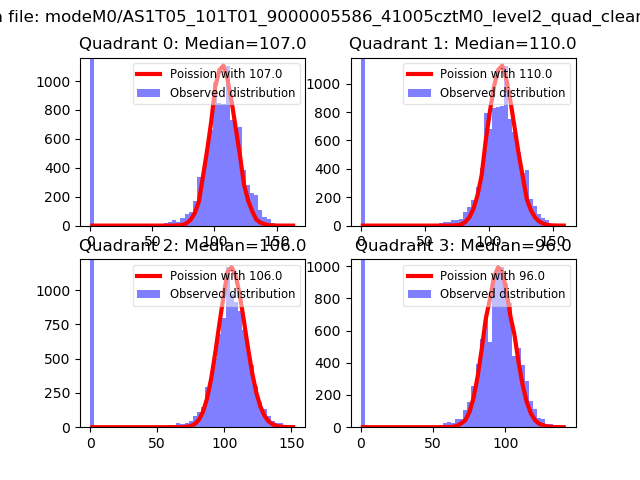 |
 |
| Quadrant-wise count rates Data is divided into 100 sec bins |
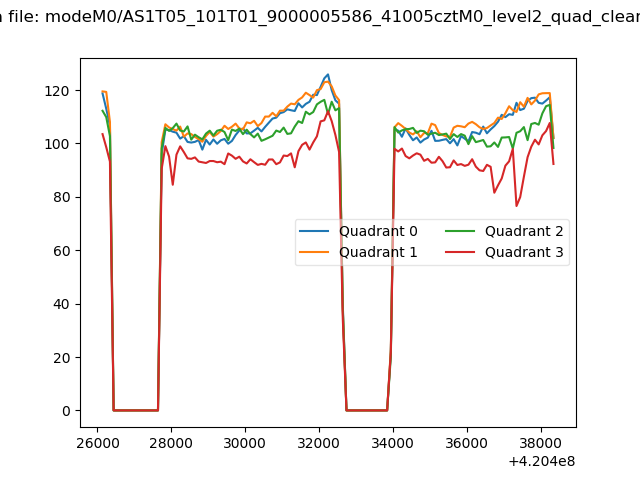 |
|
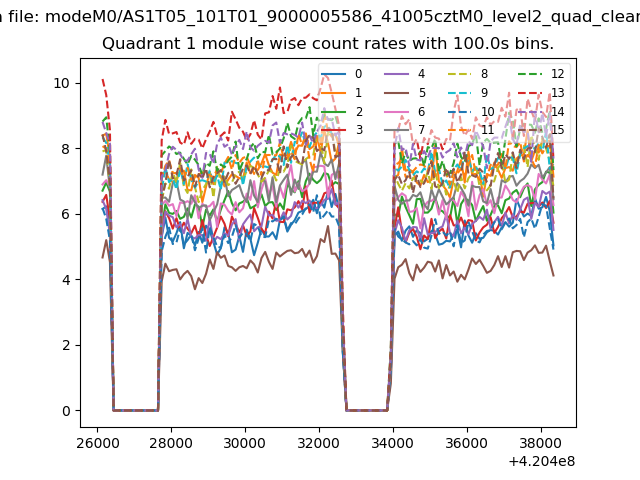
| Module-wise count rates for Quadrant A Data is divided into 100 sec bins |
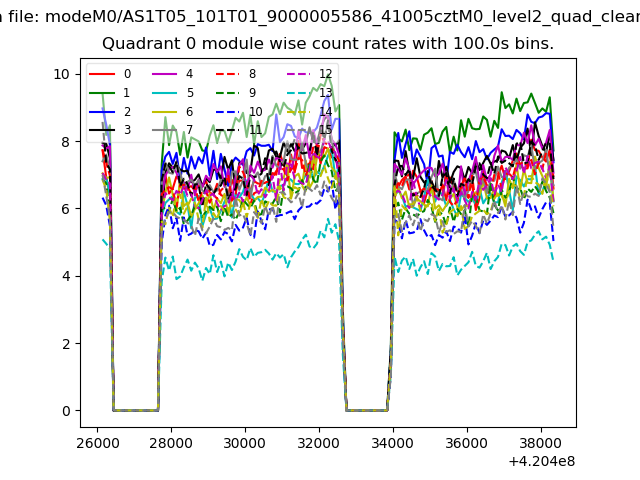 |
 |
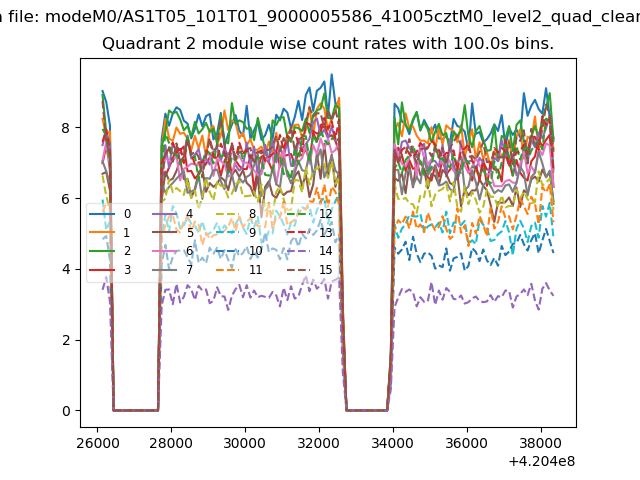
| Module-wise count rates for Quadrant B Data is divided into 100 sec bins |
 |
 |
| Module-wise count rates for Quadrant C Data is divided into 100 sec bins |
 |
 |
| Module-wise count rates for Quadrant D Data is divided into 100 sec bins |
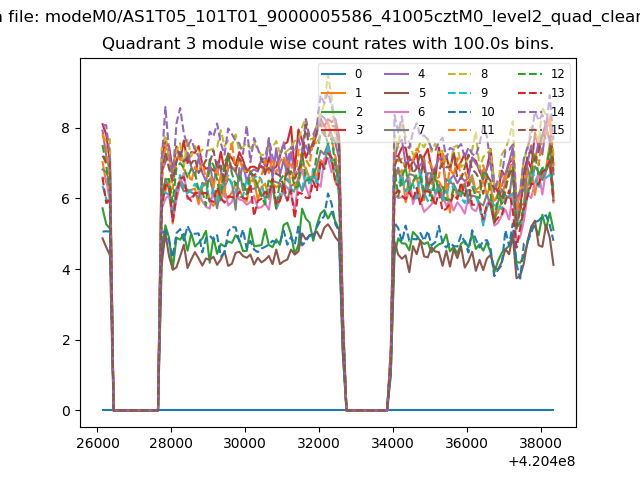 |
 |
| Parameter | Plot |
|---|---|
| CZT HV Monitor | 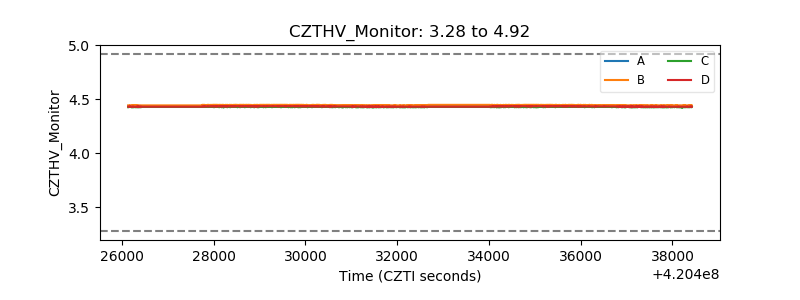 |
| D_VDD | 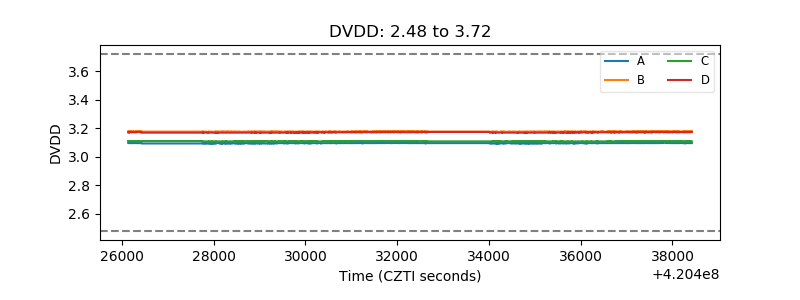 |
| Temperature 1 | 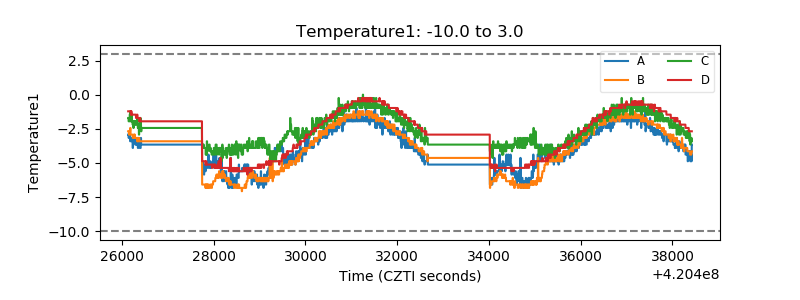 |
| Veto HV Monitor | 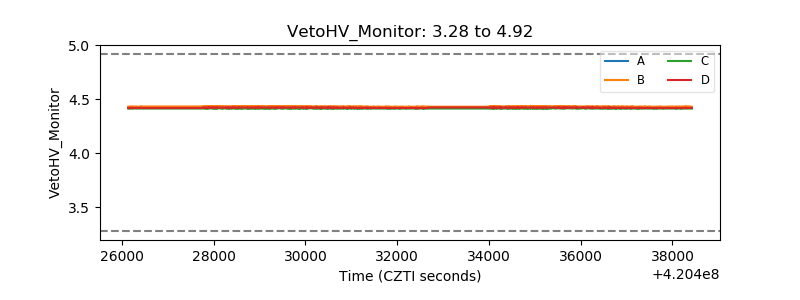 |
| Veto LLD | 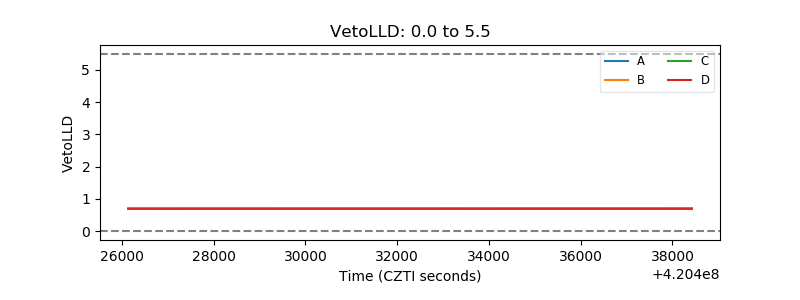 |
| Alpha Counter | 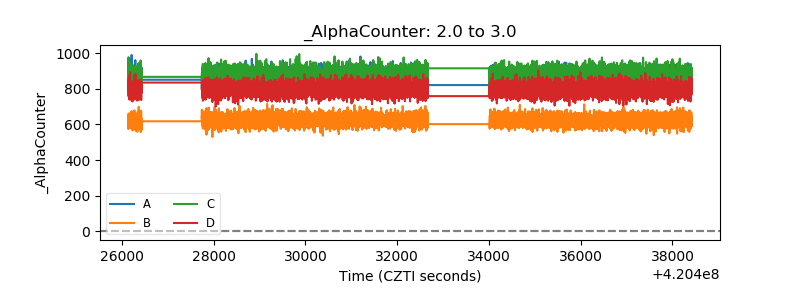 |
| _CPM_Rate | 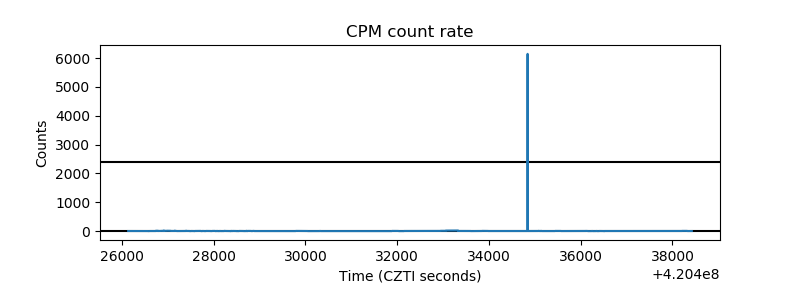 |
| CZT Counter | 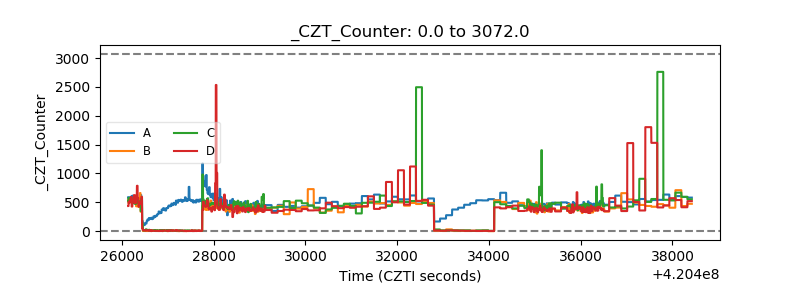 |
| +2.5 Volts monitor |  |
| +5 Volts monitor | 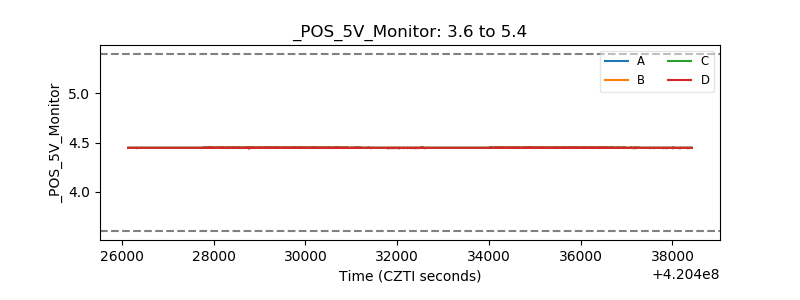 |
| _ROLL_ROT | 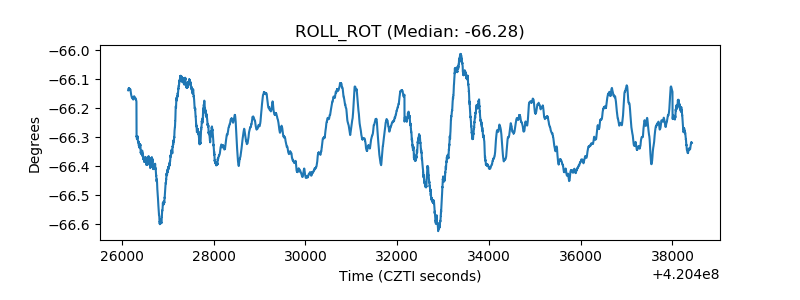 |
| _Roll_DEC | 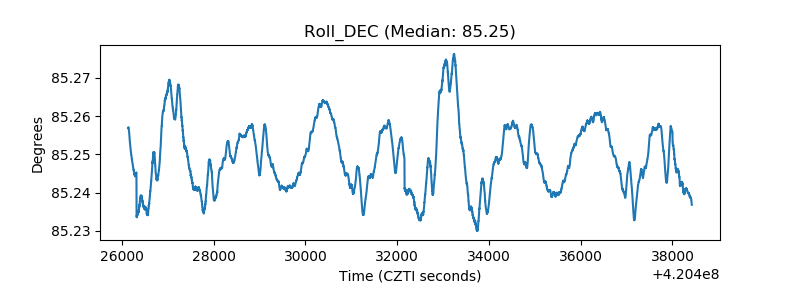 |
| _Roll_RA | 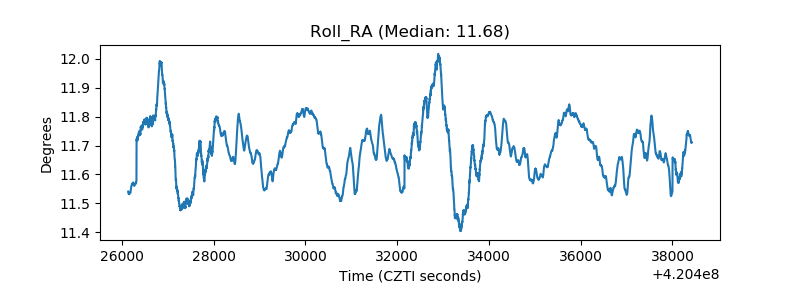 |
| Veto Counter | 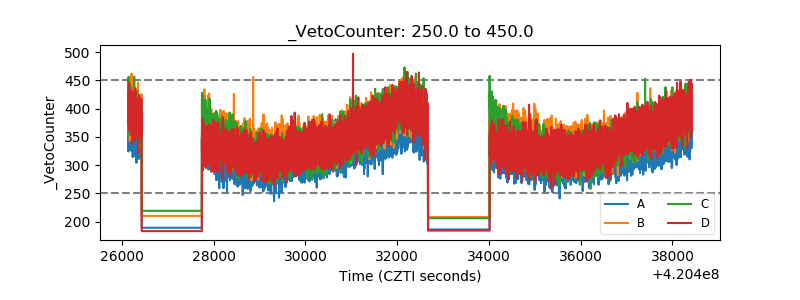 |