| Param | Original file | Final file |
|---|---|---|
| Filename | modeM0/AS1A12_029T02_9000005590_41013cztM0_level2.fits | modeM0/AS1A12_029T02_9000005590_41013cztM0_level2_quad_clean.evt |
| Size (bytes) | 309,219,840 | 84,816,000 |
| Size | 294.9 MB | 80.9 MB |
| Events in quadrant A | 2,635,220 | 569,757 |
| Events in quadrant B | 2,163,774 | 583,508 |
| Events in quadrant C | 2,693,369 | 559,456 |
| Events in quadrant D | 3,568,553 | 509,027 |
| Mode SS | |||
|---|---|---|---|
| Quadrant | BADHDUFLAG | Total packets | Discarded packets |
| A | 0 | 102 | 0 |
| B | 0 | 102 | 0 |
| C | 0 | 102 | 0 |
| D | 0 | 102 | 0 |
| Mode M0 | |||
|---|---|---|---|
| Quadrant | BADHDUFLAG | Total packets | Discarded packets |
| A | 0 | 10948 | 3 |
| B | 0 | 9945 | 2 |
| C | 0 | 11139 | 2 |
| D | 0 | 14024 | 2 |
| Mode M9 | |||
|---|---|---|---|
| Quadrant | BADHDUFLAG | Total packets | Discarded packets |
| A | 0 | 42 | 0 |
| B | 0 | 42 | 0 |
| C | 0 | 42 | 0 |
| D | 0 | 42 | 0 |
| Quadrant | Total seconds | Saturated seconds | Saturation percentage |
|---|---|---|---|
| A | 4943 | 9 | 0.182076% |
| B | 4943 | 6 | 0.121384% |
| C | 4943 | 84 | 1.699373% |
| D | 4943 | 150 | 3.034594% |
Noise dominated data is calculated using 1-second bins in cleaned event files. If a bin has >2000 counts, and if more than 50% of those come from <1% of pixels, then it is considered to be noise-dominated and hence unusable.
| Quadrant | # 1 sec bins | Bins with >0 counts | Bins with >2000 counts | High rate bins dominated by noise | Noise dominated (total time) | Noise dominated (detector-on time) | Marked lightcurve |
|---|---|---|---|---|---|---|---|
| A | 9130 | 4945 | 5 | 5 | 0.05% | 0.10% | 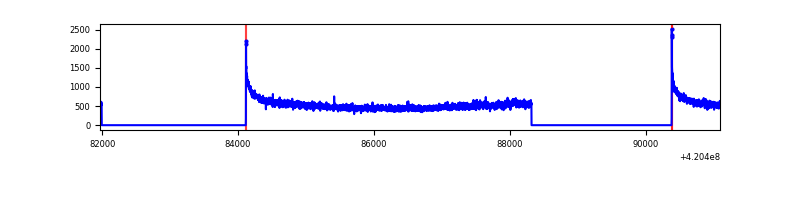 |
| B | 9130 | 4945 | 0 | 0 | 0.00% | 0.00% | 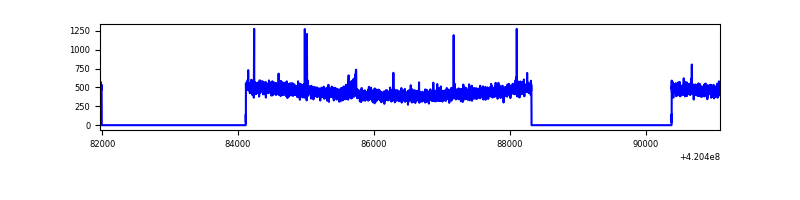 |
| C | 9130 | 4945 | 70 | 70 | 0.77% | 1.42% | 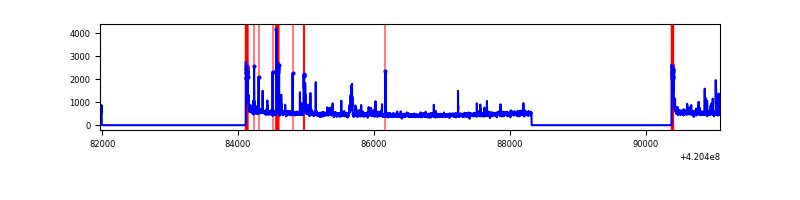 |
| D | 9130 | 4945 | 159 | 159 | 1.74% | 3.22% | 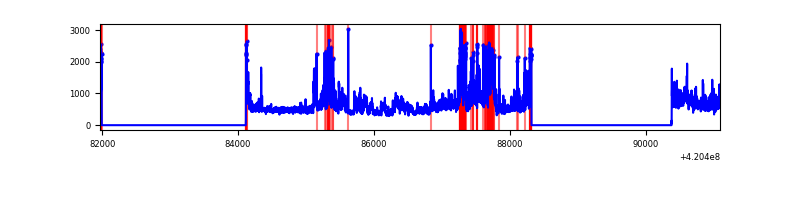 |
Top three noisy pixels from each quadrant. If the there are fewer than three noisy pixels in the level2.evt file, extra rows are filled as -1
| Pixel properties | Quadrant properties | ||||||
|---|---|---|---|---|---|---|---|
| Quadrant | DetID | PixID | Counts | Sigma | Mean | Median | Sigma |
| A | 10 | 83 | 474206 | 4243.94 | 545 | 534 | 111.6 |
| A | 12 | 189 | 42311 | 374.31 | 545 | 534 | 111.6 |
| A | 13 | 254 | 7615 | 63.44 | 545 | 534 | 111.6 |
| B | 12 | 111 | 13442 | 120.97 | 545 | 530 | 106.7 |
| B | 0 | 190 | 12878 | 115.69 | 545 | 530 | 106.7 |
| B | 11 | 111 | 12295 | 110.23 | 545 | 530 | 106.7 |
| C | 15 | 214 | 214799 | 1682.43 | 540 | 544 | 127.3 |
| C | 14 | 254 | 202043 | 1582.27 | 540 | 544 | 127.3 |
| C | 0 | 10 | 127250 | 994.96 | 540 | 544 | 127.3 |
| D | 12 | 79 | 746798 | 5742.81 | 533 | 520 | 129.9 |
| D | 13 | 249 | 579913 | 4458.59 | 533 | 520 | 129.9 |
| D | 13 | 171 | 57004 | 434.66 | 533 | 520 | 129.9 |
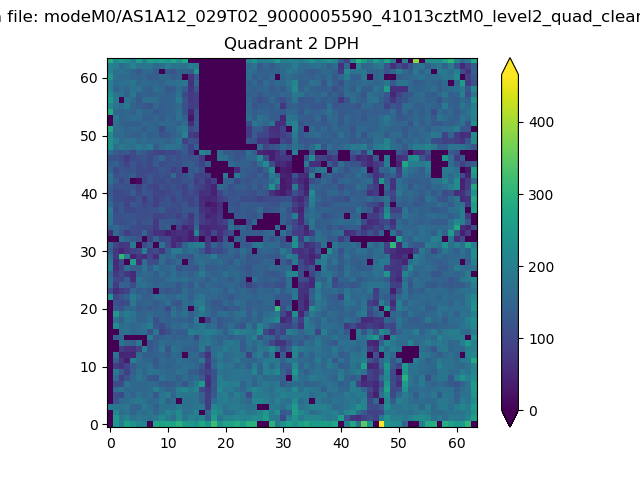
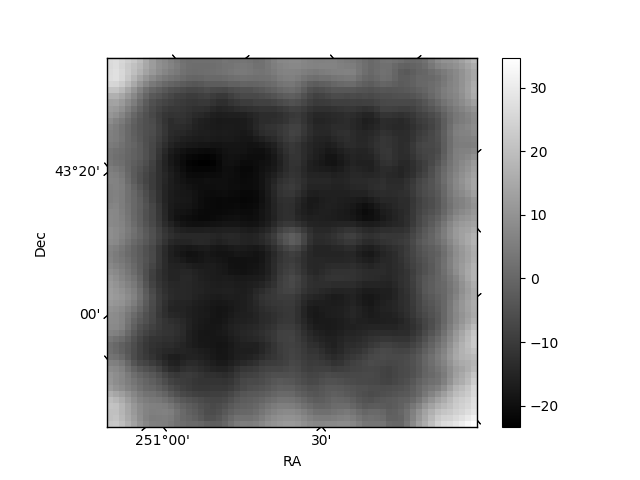
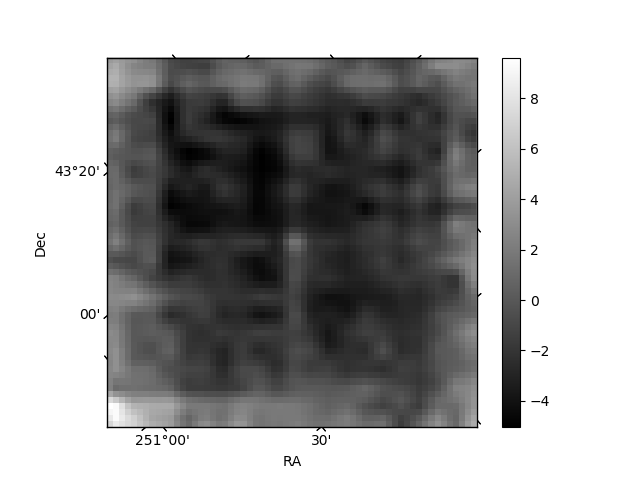
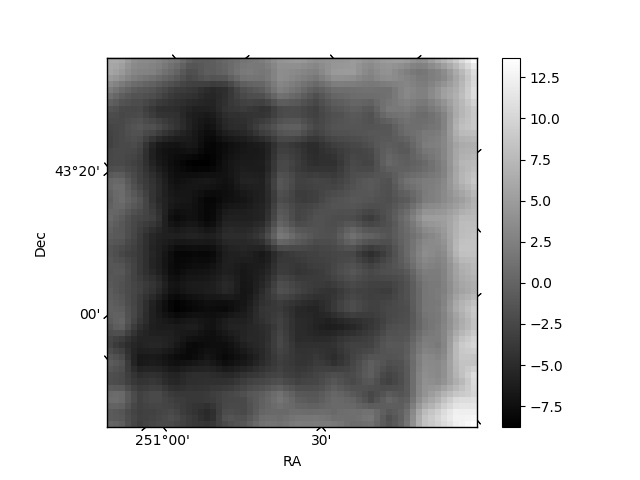
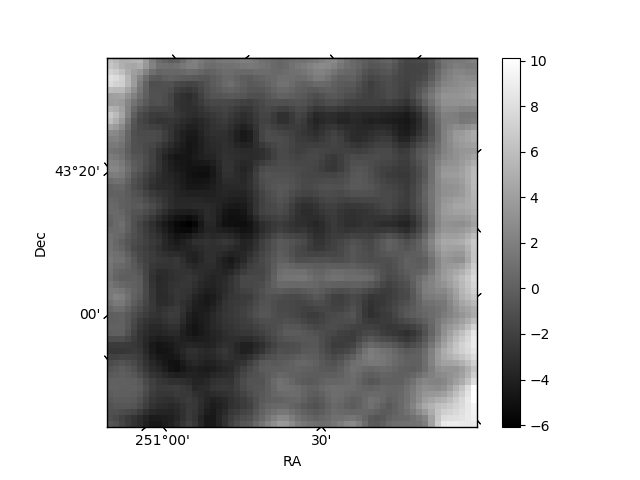
Histogram calculated using DETX and DETY for each event in the final _common_clean file
| Quadrant A | 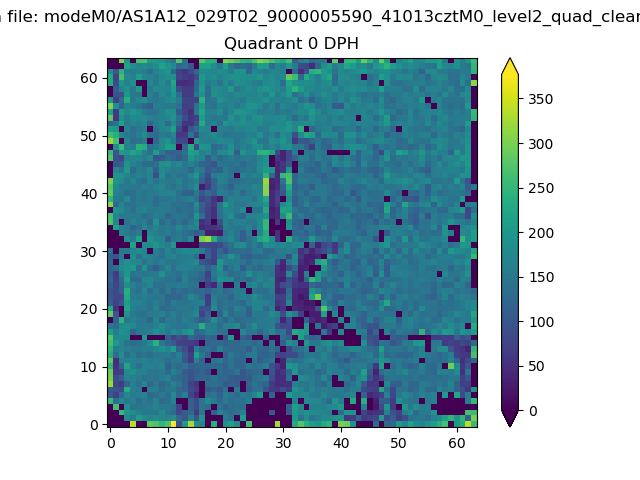 |
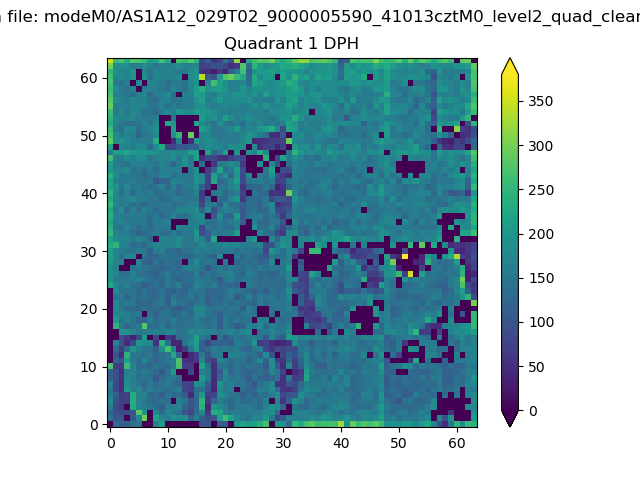 |
Quadrant B |
|---|---|---|---|
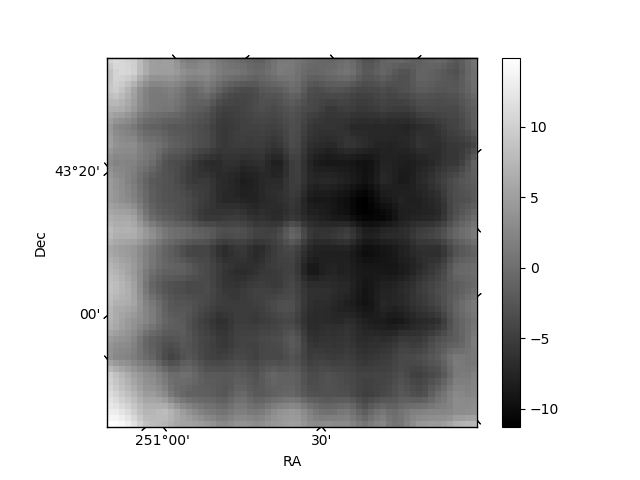
| Quadrant D | 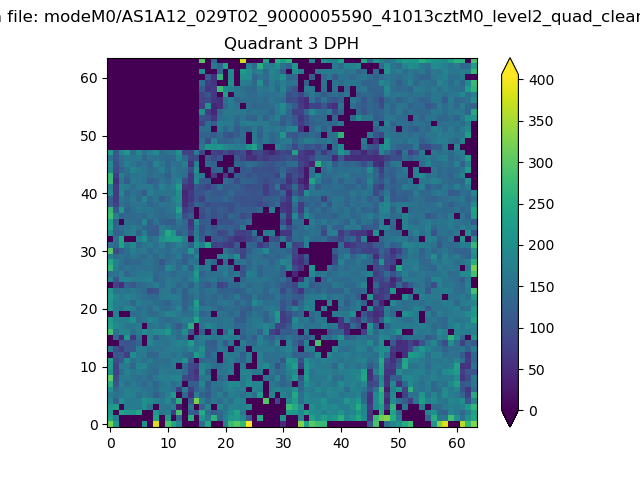 |
 |
Quadrant C |
| Plot type | Count rate plots | Images |
|---|---|---|
| Comparison with Poisson distribution Blue bars denote a histogram of data divided into 1 sec bins. Red curve is a Poisson curve with rate = median count rate of data. |
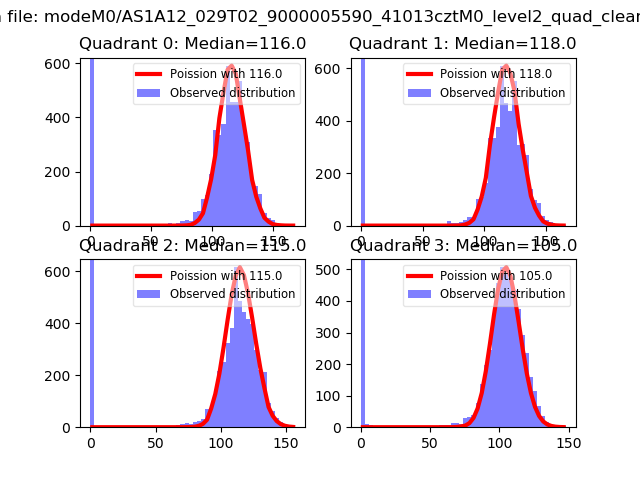 |
 |
| Quadrant-wise count rates Data is divided into 100 sec bins |
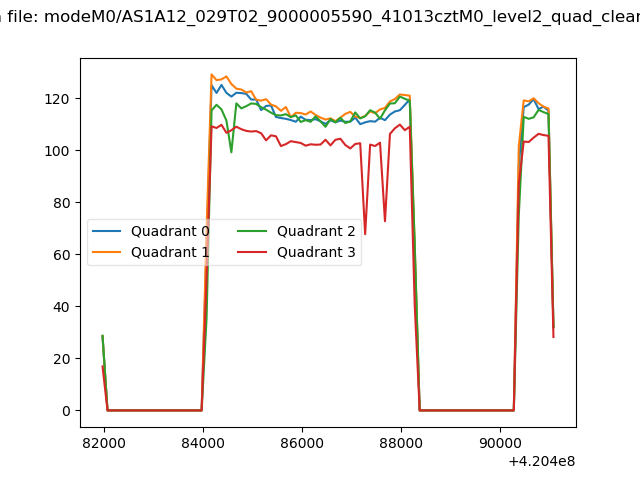 |
|
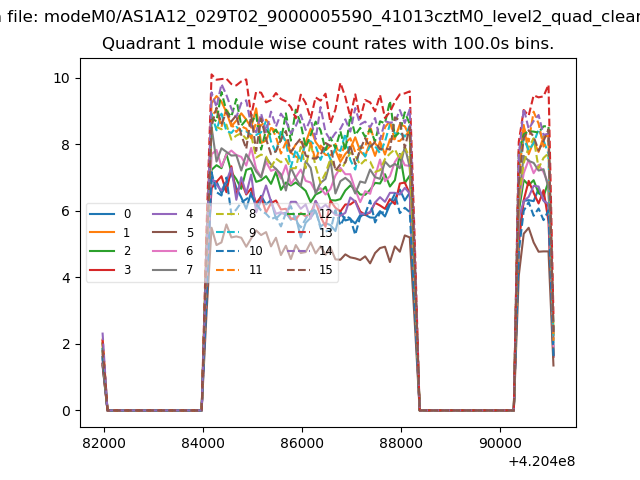
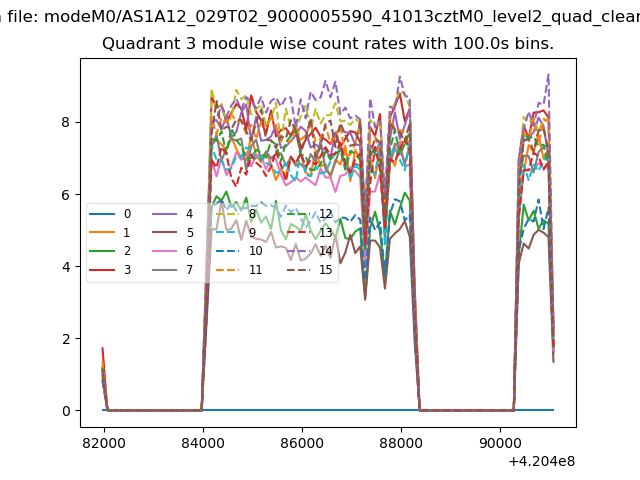
| Module-wise count rates for Quadrant A Data is divided into 100 sec bins |
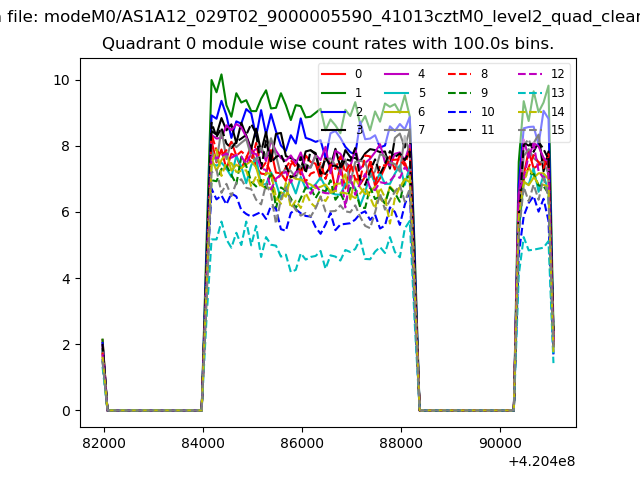 |
 |
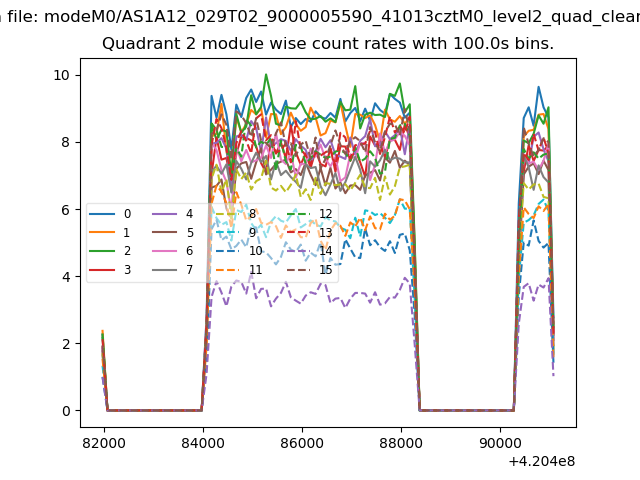
| Module-wise count rates for Quadrant B Data is divided into 100 sec bins |
 |
 |
| Module-wise count rates for Quadrant C Data is divided into 100 sec bins |
 |
 |
| Module-wise count rates for Quadrant D Data is divided into 100 sec bins |
 |
 |
| Parameter | Plot |
|---|---|
| CZT HV Monitor | 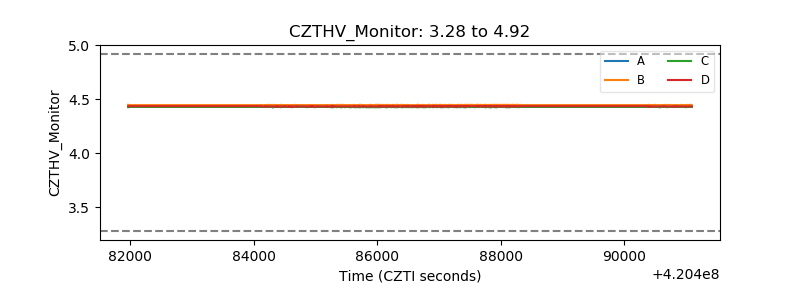 |
| D_VDD | 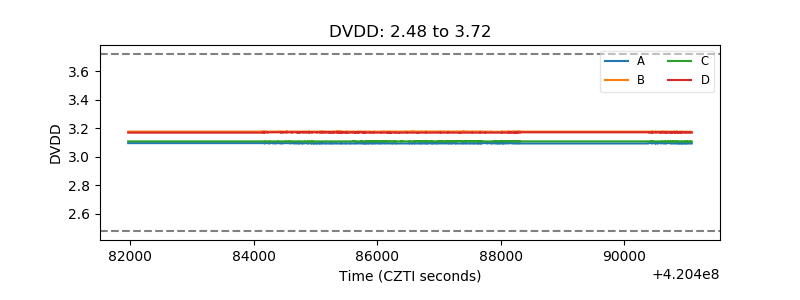 |
| Temperature 1 | 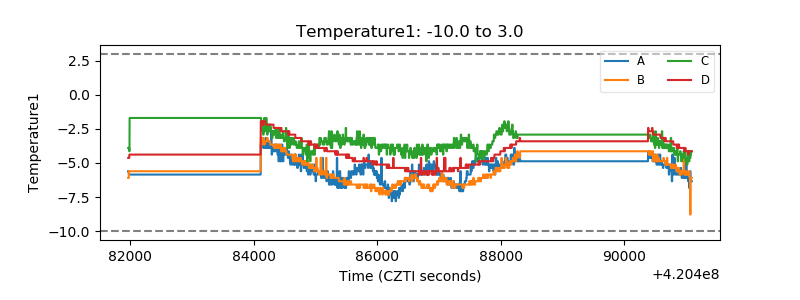 |
| Veto HV Monitor |  |
| Veto LLD | 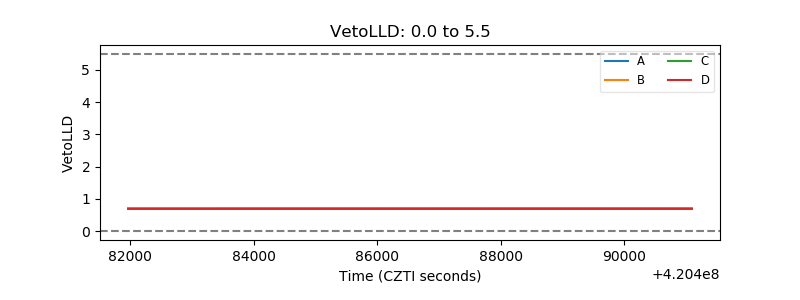 |
| Alpha Counter | 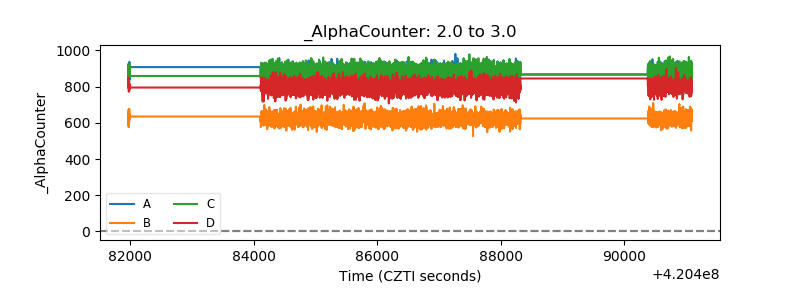 |
| _CPM_Rate | 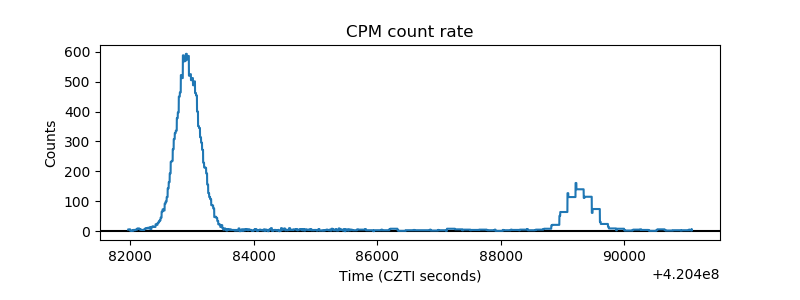 |
| CZT Counter | 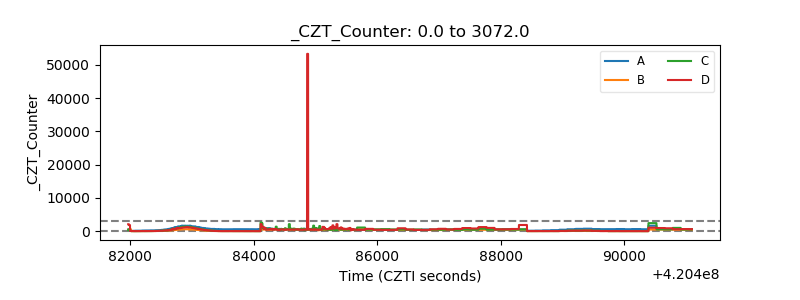 |
| +2.5 Volts monitor | 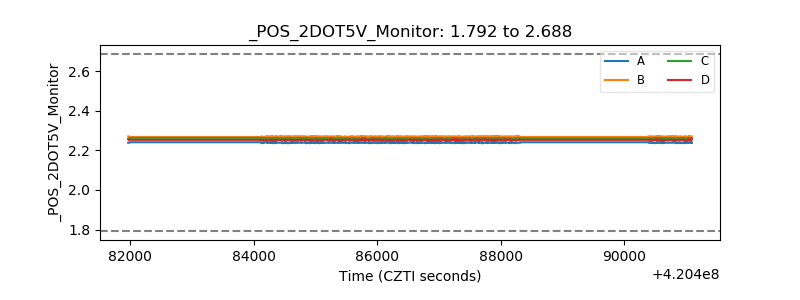 |
| +5 Volts monitor | 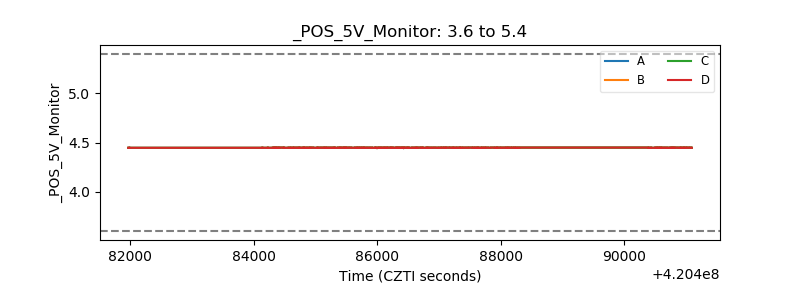 |
| _ROLL_ROT | 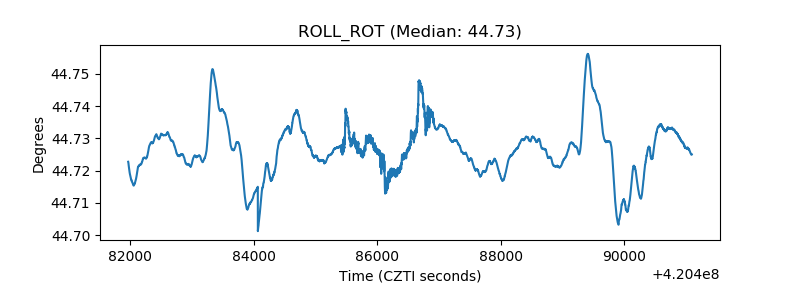 |
| _Roll_DEC | 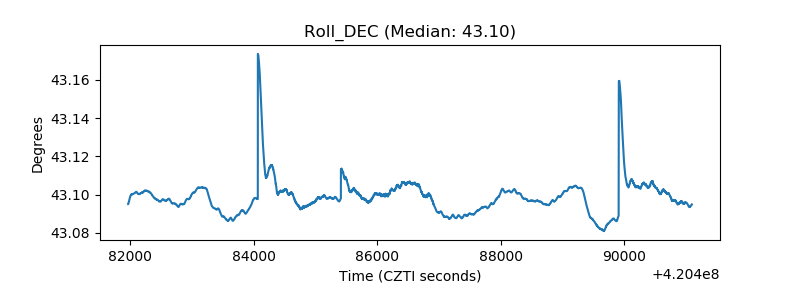 |
| _Roll_RA | 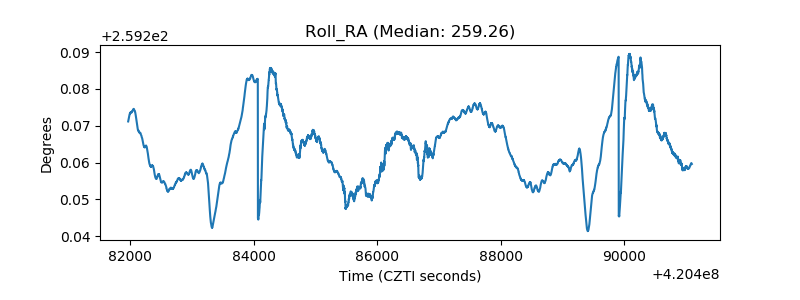 |
| Veto Counter | 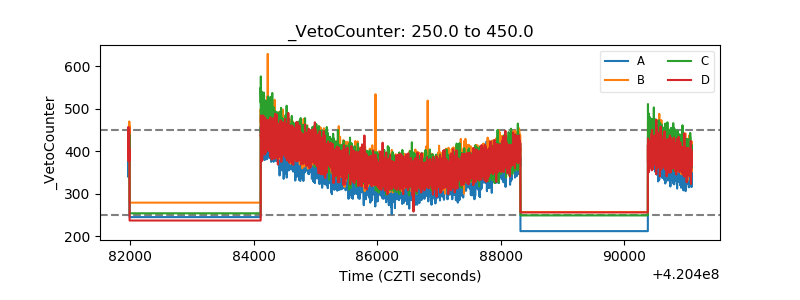 |