| Param | Original file | Final file |
|---|---|---|
| Filename | modeM0/AS1A12_029T02_9000005590_41014cztM0_level2.fits | modeM0/AS1A12_029T02_9000005590_41014cztM0_level2_quad_clean.evt |
| Size (bytes) | 349,715,520 | 98,585,280 |
| Size | 333.5 MB | 94.0 MB |
| Events in quadrant A | 3,109,571 | 653,473 |
| Events in quadrant B | 2,541,744 | 671,774 |
| Events in quadrant C | 2,985,994 | 653,147 |
| Events in quadrant D | 3,851,176 | 596,621 |
| Mode SS | |||
|---|---|---|---|
| Quadrant | BADHDUFLAG | Total packets | Discarded packets |
| A | 0 | 122 | 0 |
| B | 0 | 122 | 0 |
| C | 0 | 122 | 0 |
| D | 0 | 122 | 0 |
| Mode M0 | |||
|---|---|---|---|
| Quadrant | BADHDUFLAG | Total packets | Discarded packets |
| A | 0 | 12822 | 3 |
| B | 0 | 11830 | 2 |
| C | 0 | 12593 | 2 |
| D | 0 | 15571 | 2 |
| Mode M9 | |||
|---|---|---|---|
| Quadrant | BADHDUFLAG | Total packets | Discarded packets |
| A | 0 | 38 | 0 |
| B | 0 | 38 | 0 |
| C | 0 | 38 | 0 |
| D | 0 | 38 | 0 |
| Quadrant | Total seconds | Saturated seconds | Saturation percentage |
|---|---|---|---|
| A | 5869 | 12 | 0.204464% |
| B | 5869 | 4 | 0.068155% |
| C | 5869 | 48 | 0.817857% |
| D | 5869 | 54 | 0.920089% |
Noise dominated data is calculated using 1-second bins in cleaned event files. If a bin has >2000 counts, and if more than 50% of those come from <1% of pixels, then it is considered to be noise-dominated and hence unusable.
| Quadrant | # 1 sec bins | Bins with >0 counts | Bins with >2000 counts | High rate bins dominated by noise | Noise dominated (total time) | Noise dominated (detector-on time) | Marked lightcurve |
|---|---|---|---|---|---|---|---|
| A | 9757 | 5871 | 5 | 5 | 0.05% | 0.09% | 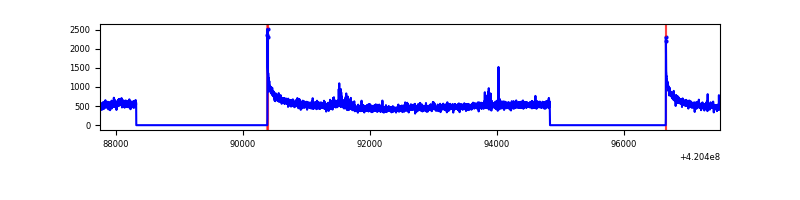 |
| B | 9757 | 5871 | 0 | 0 | 0.00% | 0.00% | 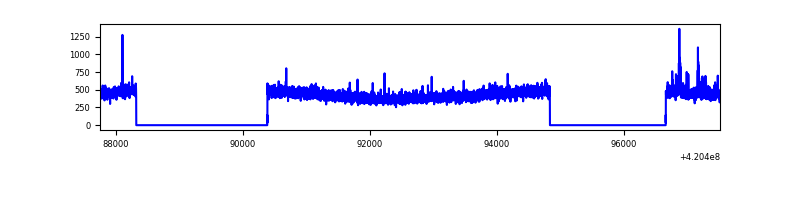 |
| C | 9757 | 5871 | 48 | 48 | 0.49% | 0.82% | 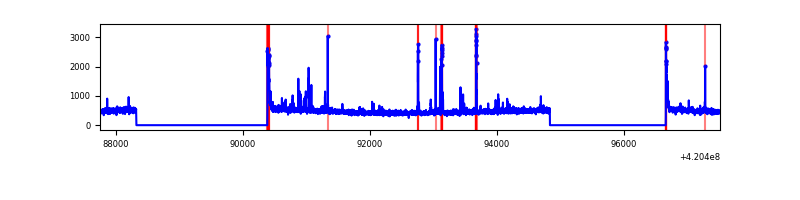 |
| D | 9757 | 5871 | 44 | 44 | 0.45% | 0.75% | 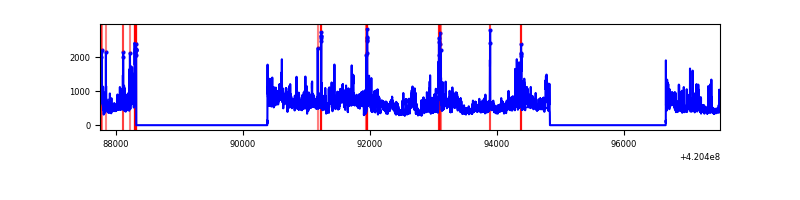 |
Top three noisy pixels from each quadrant. If the there are fewer than three noisy pixels in the level2.evt file, extra rows are filled as -1
| Pixel properties | Quadrant properties | ||||||
|---|---|---|---|---|---|---|---|
| Quadrant | DetID | PixID | Counts | Sigma | Mean | Median | Sigma |
| A | 10 | 83 | 526411 | 4012.07 | 639 | 627 | 131.1 |
| A | 12 | 189 | 81220 | 614.98 | 639 | 627 | 131.1 |
| A | 2 | 79 | 24067 | 178.86 | 639 | 627 | 131.1 |
| B | 0 | 190 | 27464 | 216.36 | 637 | 618 | 124.1 |
| B | 12 | 111 | 15948 | 123.55 | 637 | 618 | 124.1 |
| B | 11 | 111 | 14568 | 112.43 | 637 | 618 | 124.1 |
| C | 15 | 214 | 252177 | 1712.36 | 630 | 635 | 146.9 |
| C | 14 | 254 | 136960 | 928.02 | 630 | 635 | 146.9 |
| C | 0 | 10 | 100490 | 679.76 | 630 | 635 | 146.9 |
| D | 12 | 79 | 863130 | 5686.61 | 624 | 606 | 151.7 |
| D | 13 | 249 | 336195 | 2212.53 | 624 | 606 | 151.7 |
| D | 1 | 47 | 66854 | 436.77 | 624 | 606 | 151.7 |
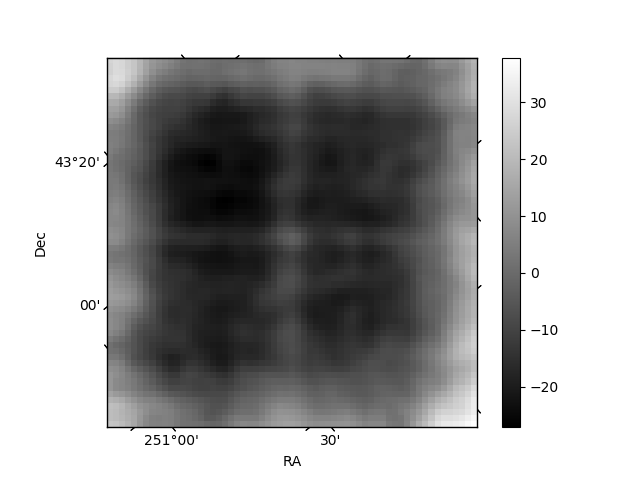
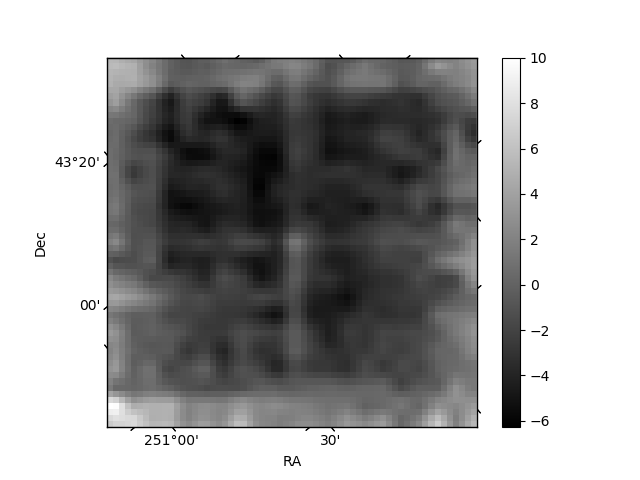
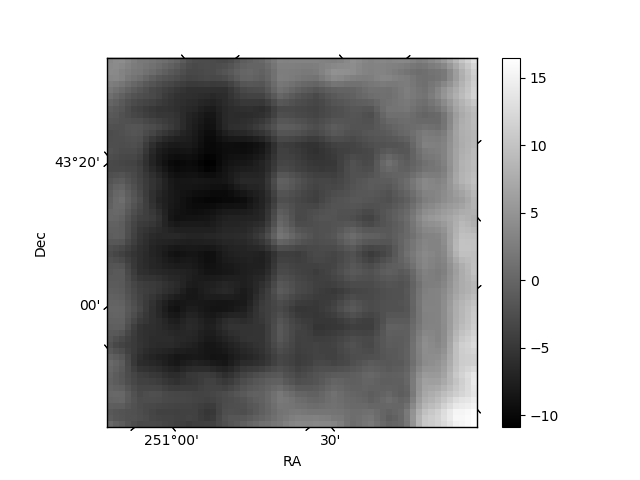
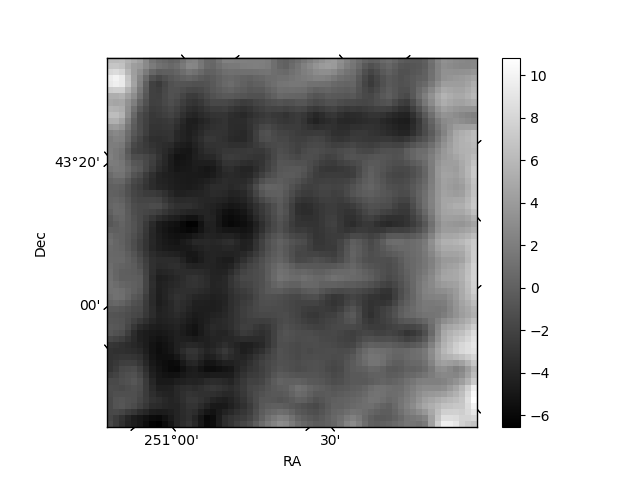
Histogram calculated using DETX and DETY for each event in the final _common_clean file
| Quadrant A | 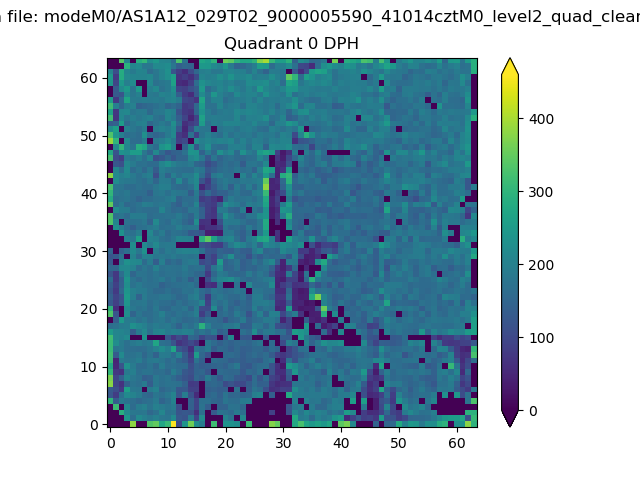 |
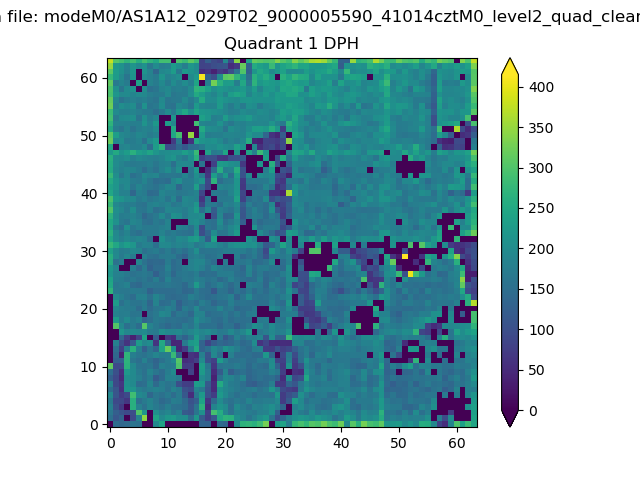 |
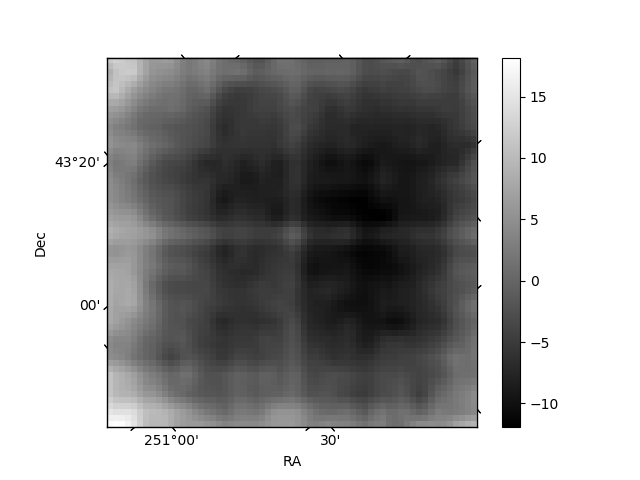
Quadrant B |
|---|---|---|---|
| Quadrant D | 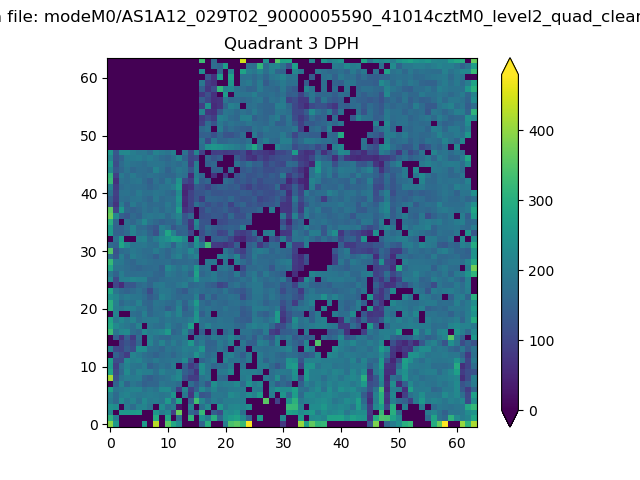 |
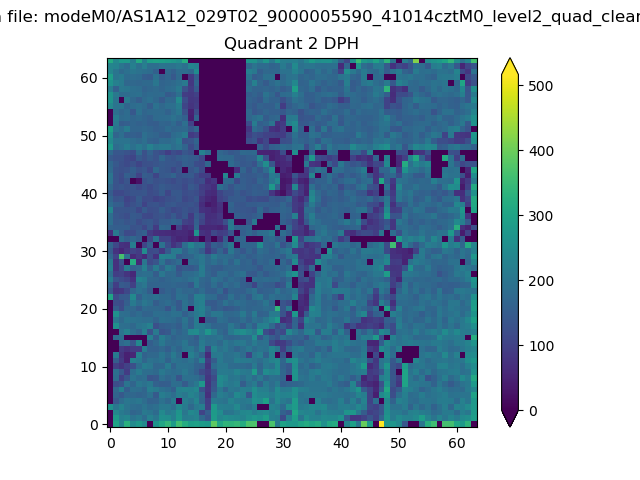 |
Quadrant C |
| Plot type | Count rate plots | Images |
|---|---|---|
| Comparison with Poisson distribution Blue bars denote a histogram of data divided into 1 sec bins. Red curve is a Poisson curve with rate = median count rate of data. |
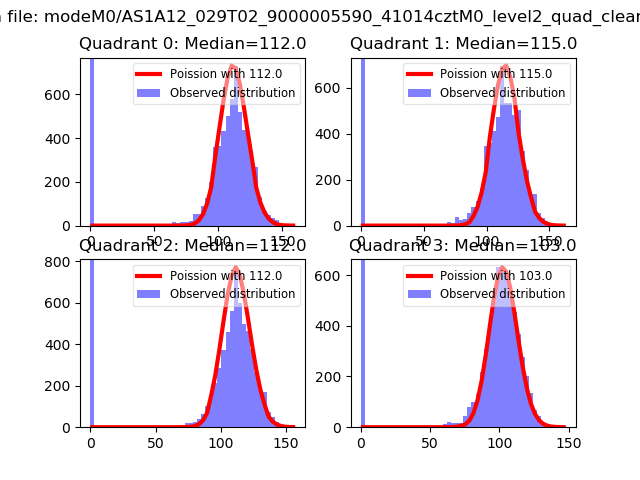 |
 |
| Quadrant-wise count rates Data is divided into 100 sec bins |
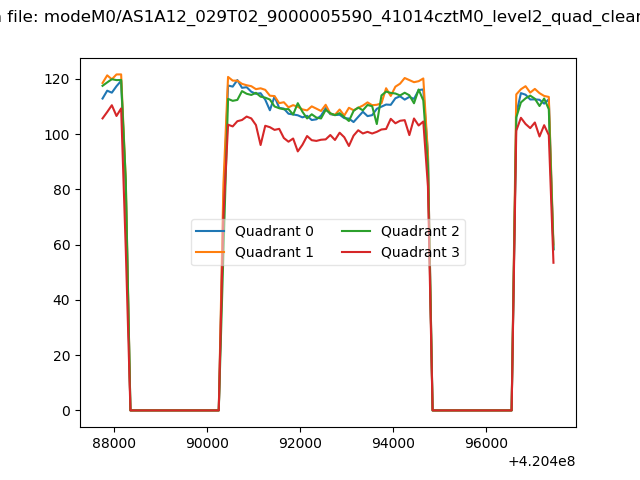 |
|
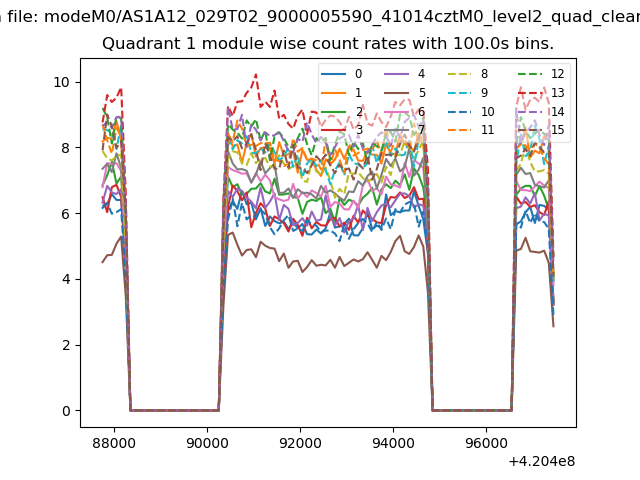
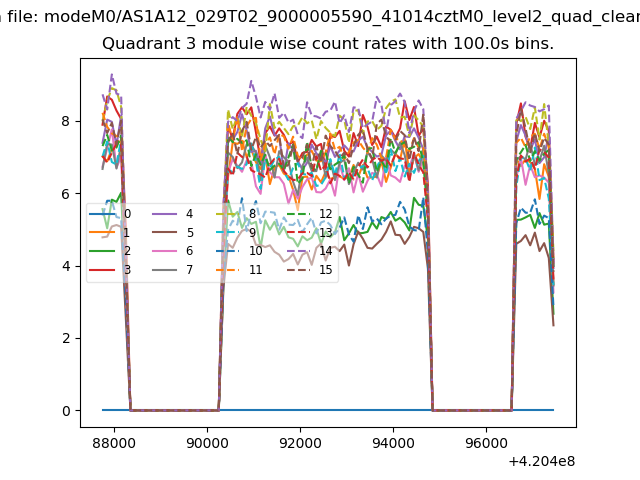
| Module-wise count rates for Quadrant A Data is divided into 100 sec bins |
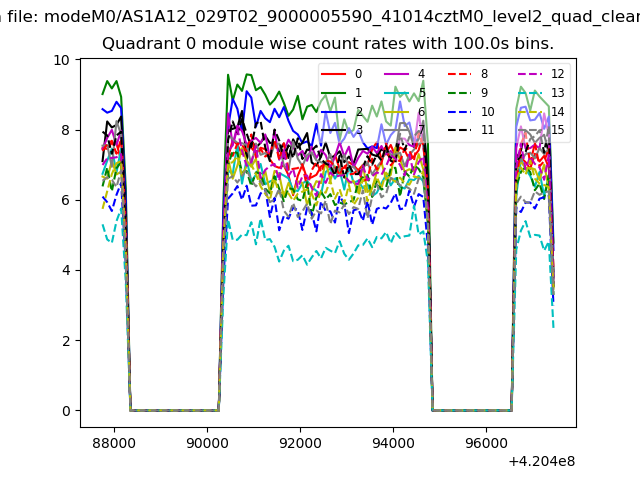 |
 |
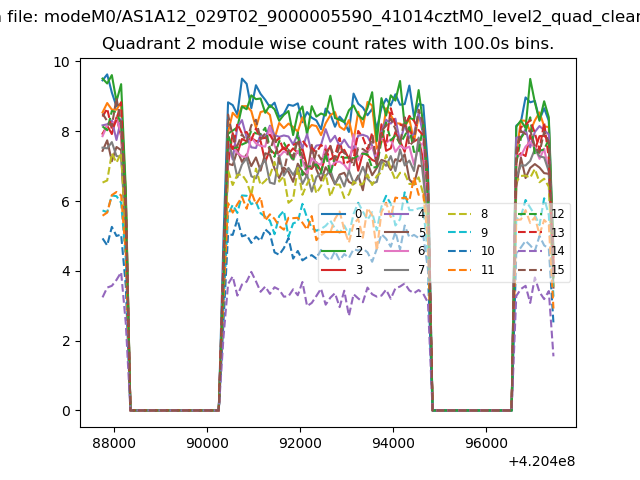
| Module-wise count rates for Quadrant B Data is divided into 100 sec bins |
 |
 |
| Module-wise count rates for Quadrant C Data is divided into 100 sec bins |
 |
 |
| Module-wise count rates for Quadrant D Data is divided into 100 sec bins |
 |
 |
| Parameter | Plot |
|---|---|
| CZT HV Monitor | 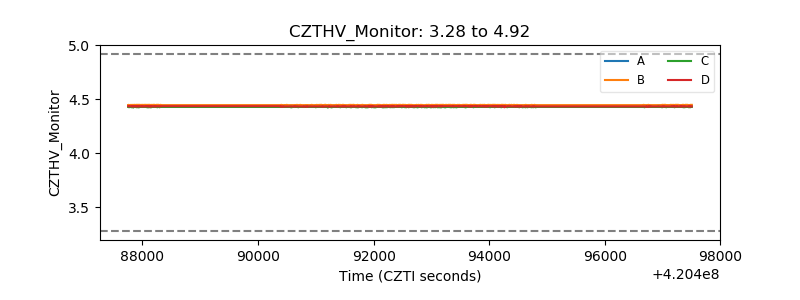 |
| D_VDD | 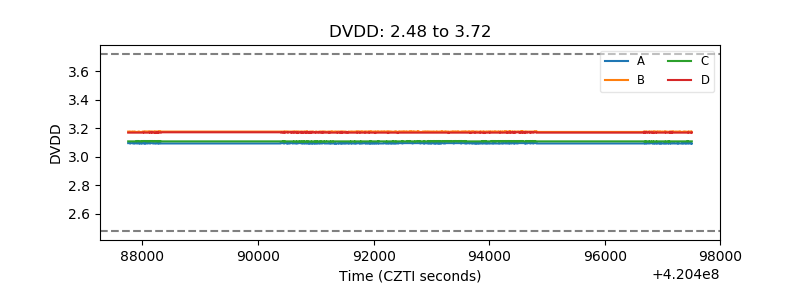 |
| Temperature 1 | 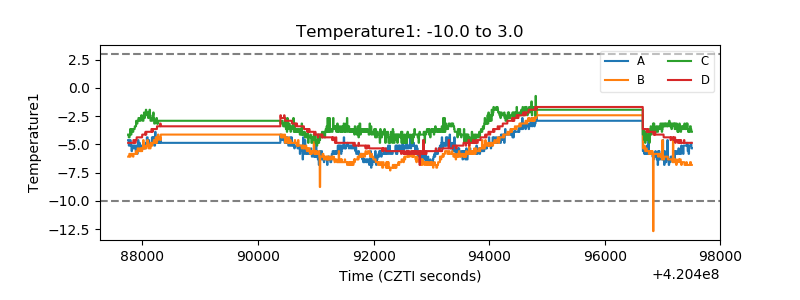 |
| Veto HV Monitor | 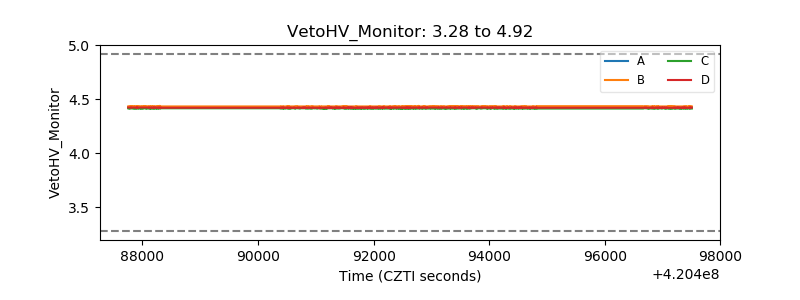 |
| Veto LLD | 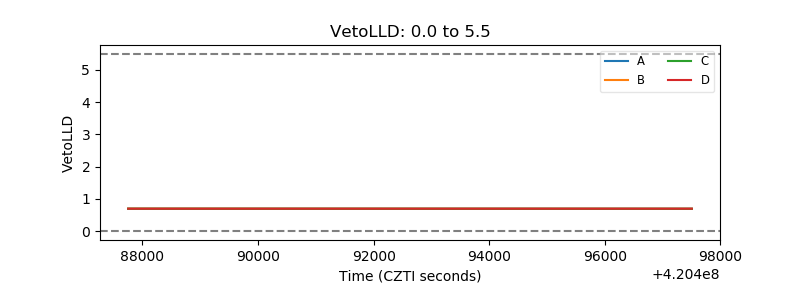 |
| Alpha Counter | 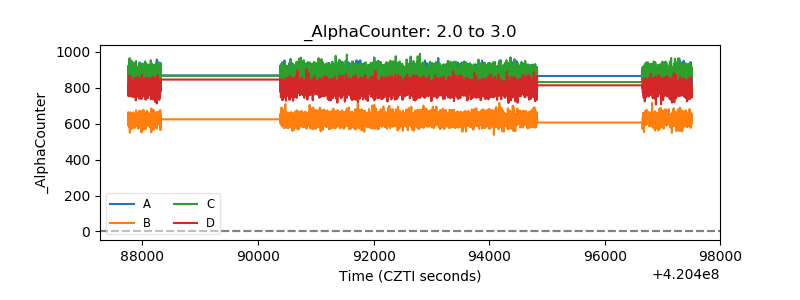 |
| _CPM_Rate | 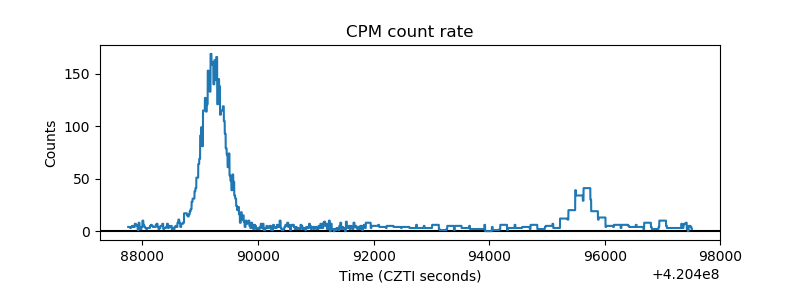 |
| CZT Counter | 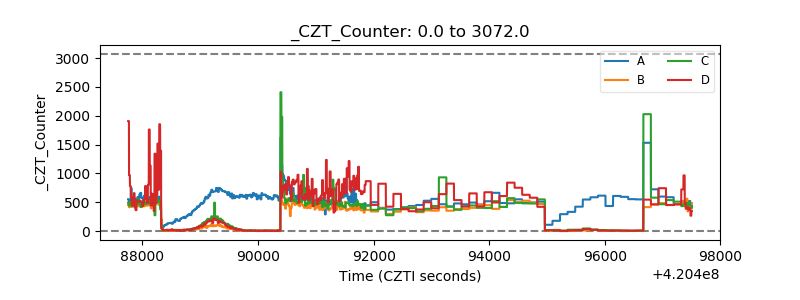 |
| +2.5 Volts monitor | 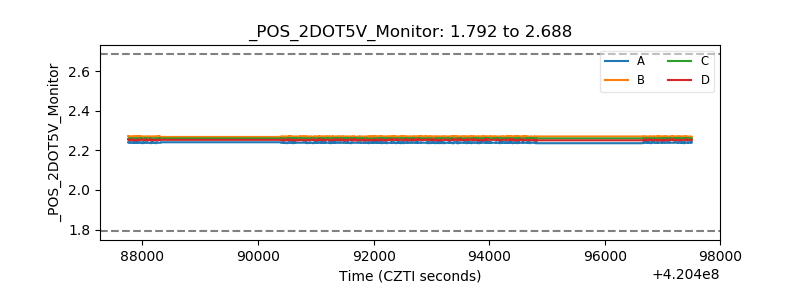 |
| +5 Volts monitor | 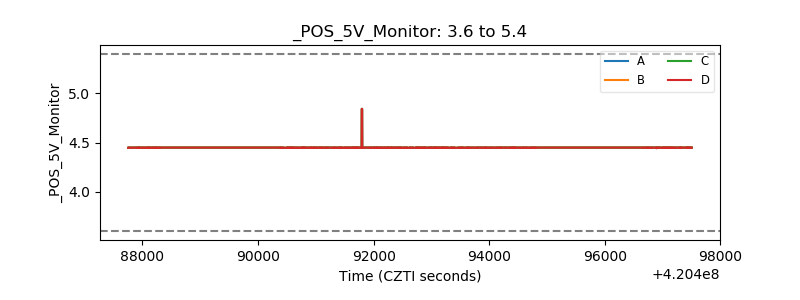 |
| _ROLL_ROT | 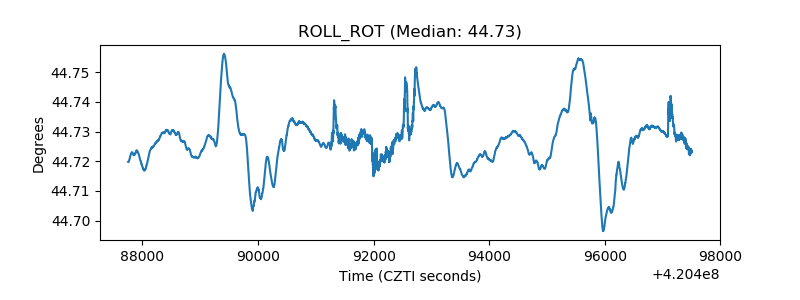 |
| _Roll_DEC | 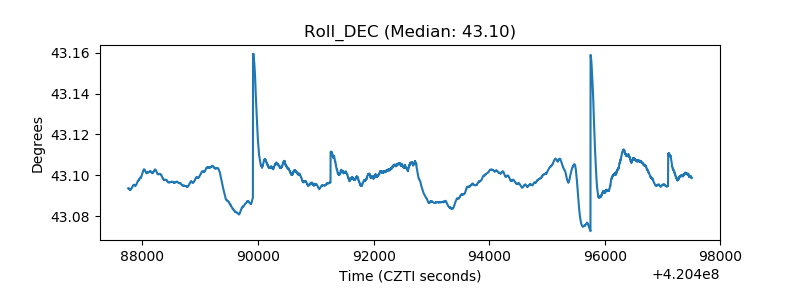 |
| _Roll_RA | 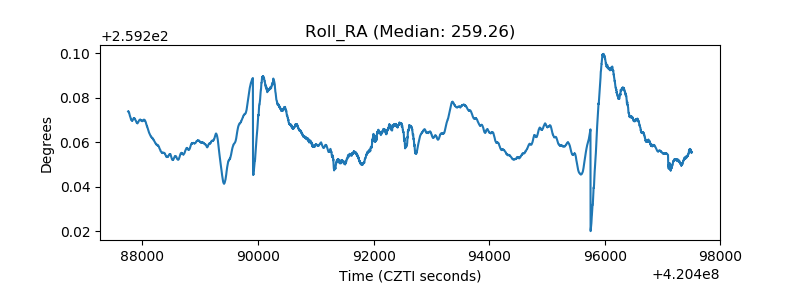 |
| Veto Counter | 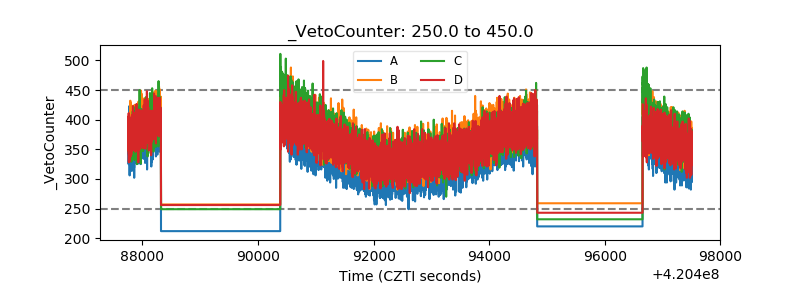 |