| Param | Original file | Final file |
|---|---|---|
| Filename | modeM0/AS1A12_029T02_9000005590_41015cztM0_level2.fits | modeM0/AS1A12_029T02_9000005590_41015cztM0_level2_quad_clean.evt |
| Size (bytes) | 353,707,200 | 94,720,320 |
| Size | 337.3 MB | 90.3 MB |
| Events in quadrant A | 2,981,675 | 629,650 |
| Events in quadrant B | 2,637,195 | 648,669 |
| Events in quadrant C | 3,037,744 | 621,276 |
| Events in quadrant D | 3,987,443 | 565,771 |
| Mode SS | |||
|---|---|---|---|
| Quadrant | BADHDUFLAG | Total packets | Discarded packets |
| A | 0 | 118 | 0 |
| B | 0 | 118 | 0 |
| C | 0 | 118 | 0 |
| D | 0 | 118 | 0 |
| Mode M0 | |||
|---|---|---|---|
| Quadrant | BADHDUFLAG | Total packets | Discarded packets |
| A | 0 | 12601 | 3 |
| B | 0 | 11952 | 2 |
| C | 0 | 12744 | 2 |
| D | 0 | 15995 | 2 |
| Mode M9 | |||
|---|---|---|---|
| Quadrant | BADHDUFLAG | Total packets | Discarded packets |
| A | 0 | 33 | 0 |
| B | 0 | 33 | 0 |
| C | 0 | 33 | 0 |
| D | 0 | 33 | 0 |
| Quadrant | Total seconds | Saturated seconds | Saturation percentage |
|---|---|---|---|
| A | 5766 | 16 | 0.277489% |
| B | 5766 | 6 | 0.104058% |
| C | 5766 | 108 | 1.873049% |
| D | 5766 | 194 | 3.364551% |
Noise dominated data is calculated using 1-second bins in cleaned event files. If a bin has >2000 counts, and if more than 50% of those come from <1% of pixels, then it is considered to be noise-dominated and hence unusable.
| Quadrant | # 1 sec bins | Bins with >0 counts | Bins with >2000 counts | High rate bins dominated by noise | Noise dominated (total time) | Noise dominated (detector-on time) | Marked lightcurve |
|---|---|---|---|---|---|---|---|
| A | 9083 | 5768 | 4 | 4 | 0.04% | 0.07% | 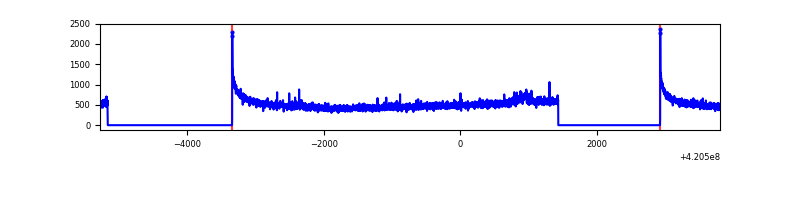 |
| B | 9083 | 5768 | 0 | 0 | 0.00% | 0.00% | 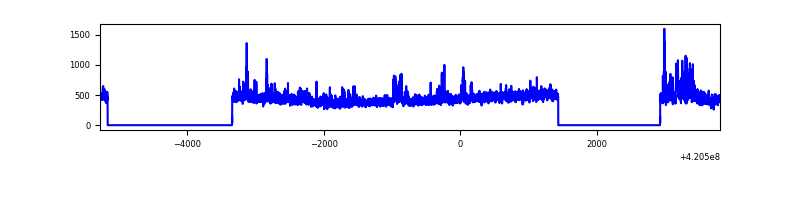 |
| C | 9083 | 5768 | 102 | 102 | 1.12% | 1.77% | 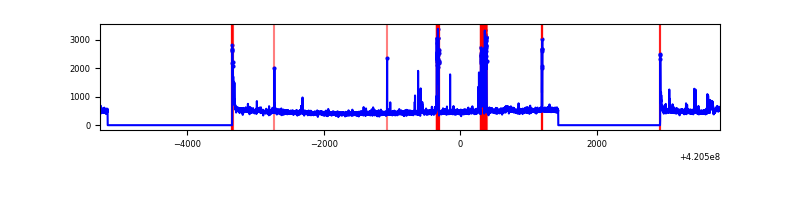 |
| D | 9083 | 5768 | 191 | 191 | 2.10% | 3.31% | 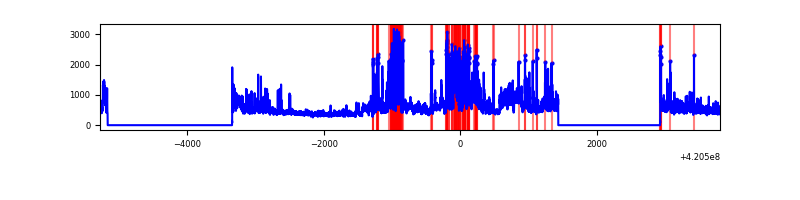 |
Top three noisy pixels from each quadrant. If the there are fewer than three noisy pixels in the level2.evt file, extra rows are filled as -1
| Pixel properties | Quadrant properties | ||||||
|---|---|---|---|---|---|---|---|
| Quadrant | DetID | PixID | Counts | Sigma | Mean | Median | Sigma |
| A | 10 | 83 | 518125 | 4093.78 | 621 | 608 | 126.4 |
| A | 12 | 189 | 38752 | 301.74 | 621 | 608 | 126.4 |
| A | 2 | 79 | 10403 | 77.48 | 621 | 608 | 126.4 |
| B | 0 | 190 | 191696 | 1579.21 | 619 | 601 | 121.0 |
| B | 12 | 111 | 15440 | 122.63 | 619 | 601 | 121.0 |
| B | 11 | 111 | 14068 | 111.29 | 619 | 601 | 121.0 |
| C | 15 | 214 | 244934 | 1715.07 | 608 | 610 | 142.5 |
| C | 12 | 249 | 193679 | 1355.28 | 608 | 610 | 142.5 |
| C | 14 | 254 | 170209 | 1190.53 | 608 | 610 | 142.5 |
| D | 12 | 79 | 714691 | 4876.63 | 599 | 583 | 146.4 |
| D | 13 | 249 | 574079 | 3916.39 | 599 | 583 | 146.4 |
| D | 2 | 153 | 245341 | 1671.45 | 599 | 583 | 146.4 |
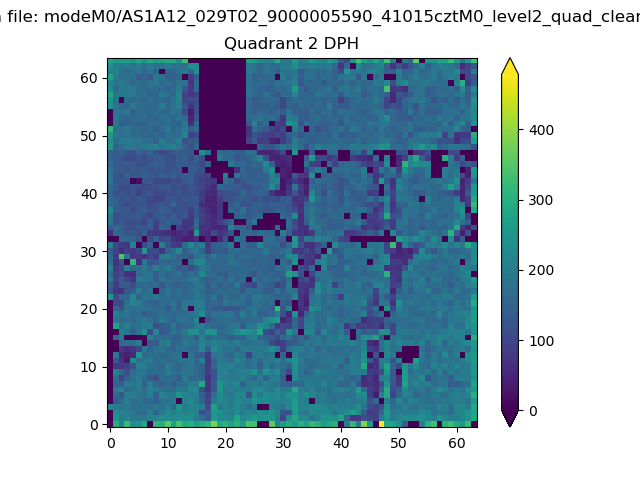
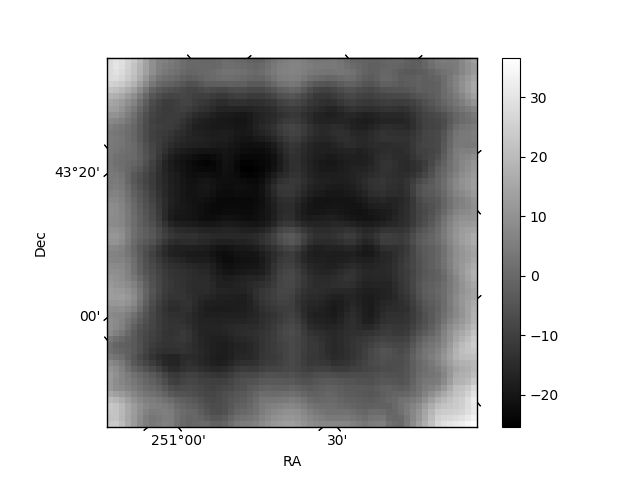
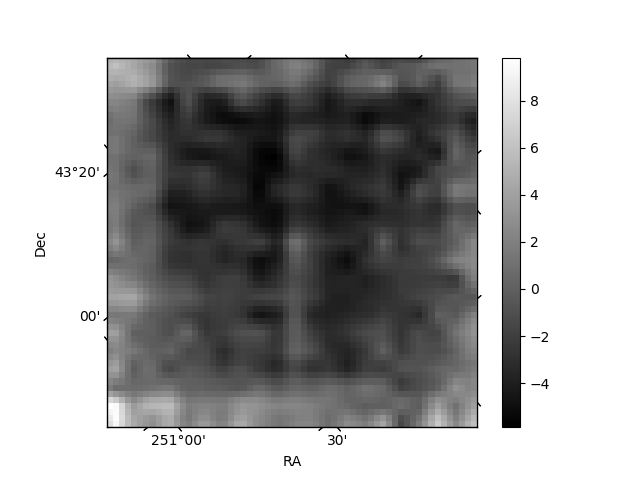
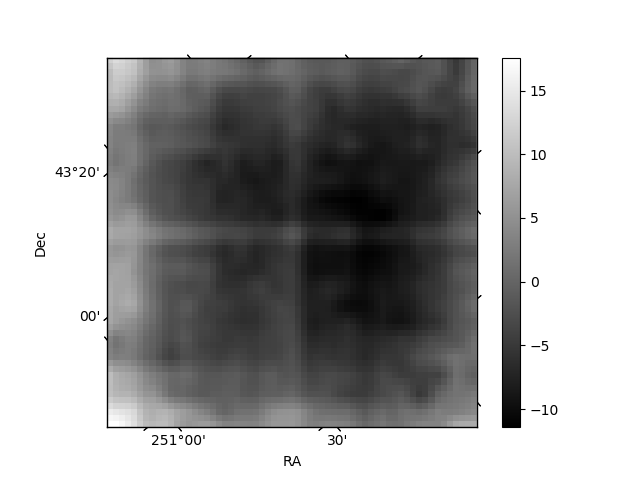
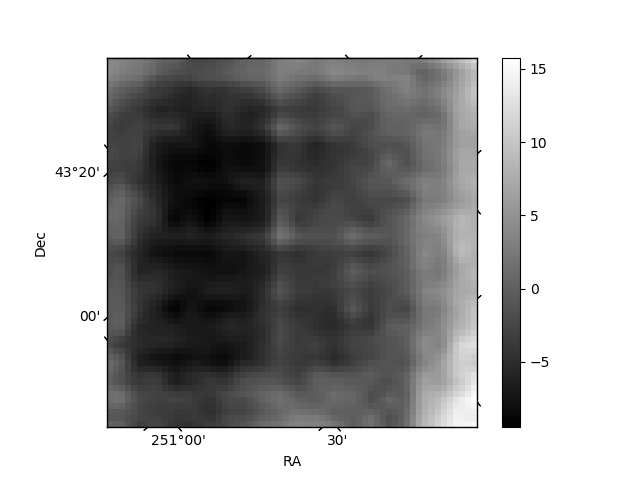
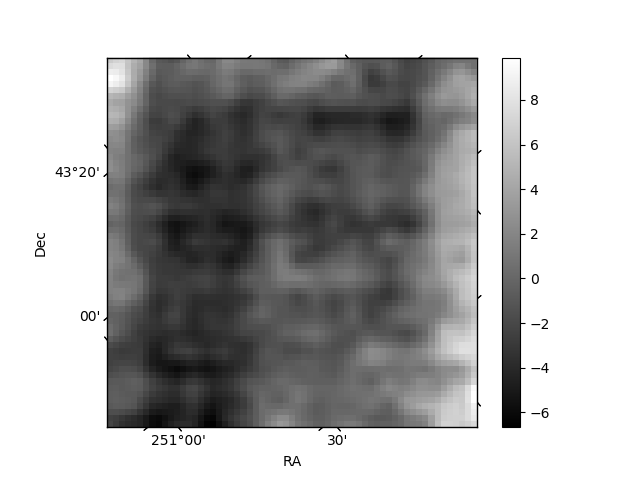
Histogram calculated using DETX and DETY for each event in the final _common_clean file
| Quadrant A | 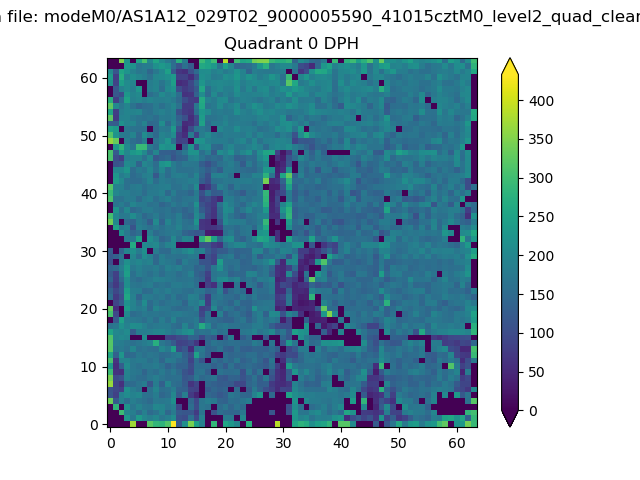 |
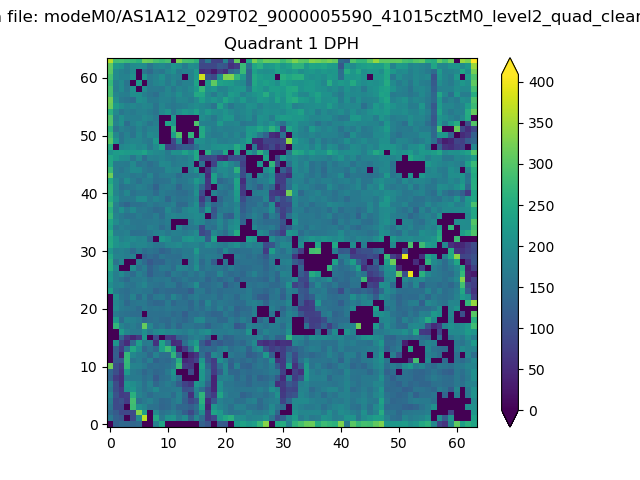 |
Quadrant B |
|---|---|---|---|
| Quadrant D | 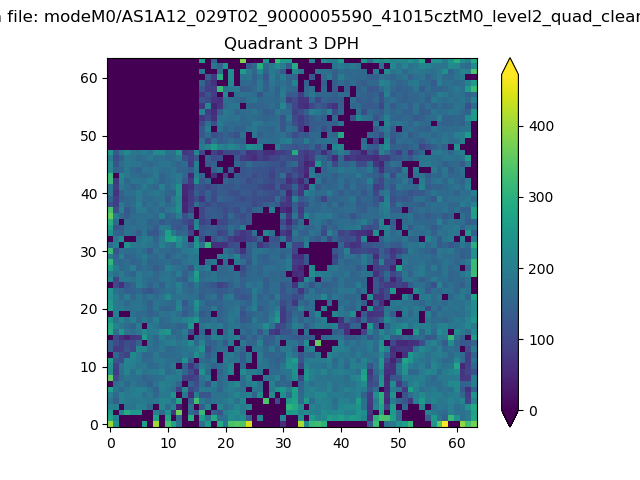 |
 |
Quadrant C |
| Plot type | Count rate plots | Images |
|---|---|---|
| Comparison with Poisson distribution Blue bars denote a histogram of data divided into 1 sec bins. Red curve is a Poisson curve with rate = median count rate of data. |
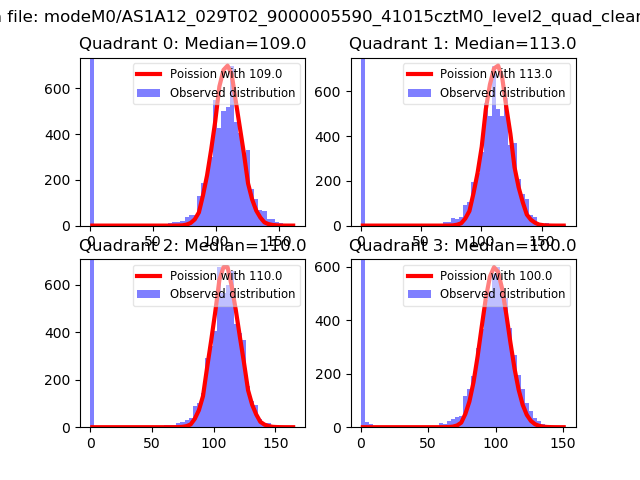 |
 |
| Quadrant-wise count rates Data is divided into 100 sec bins |
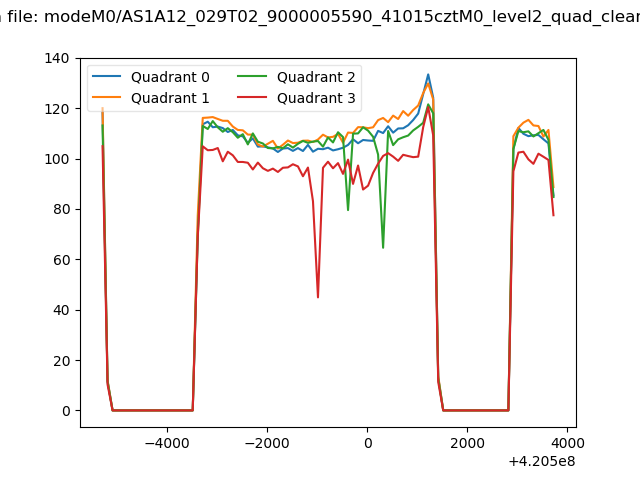 |
|
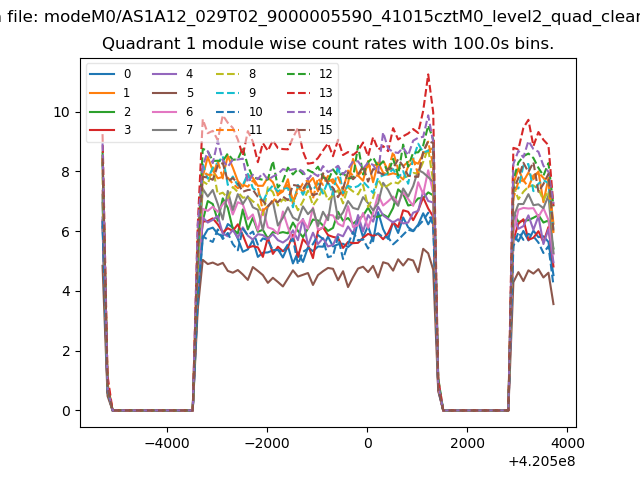
| Module-wise count rates for Quadrant A Data is divided into 100 sec bins |
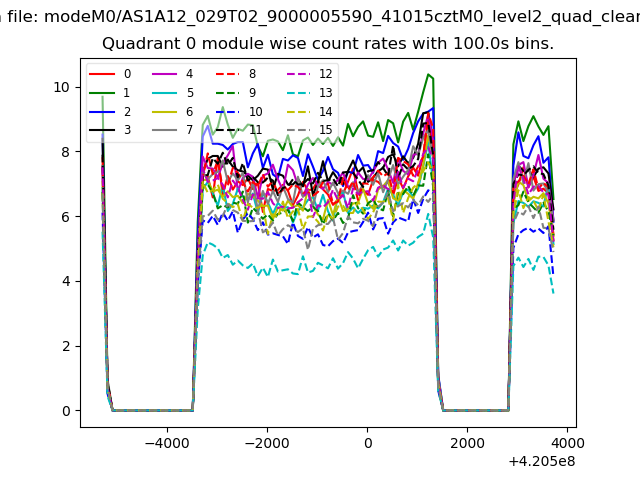 |
 |
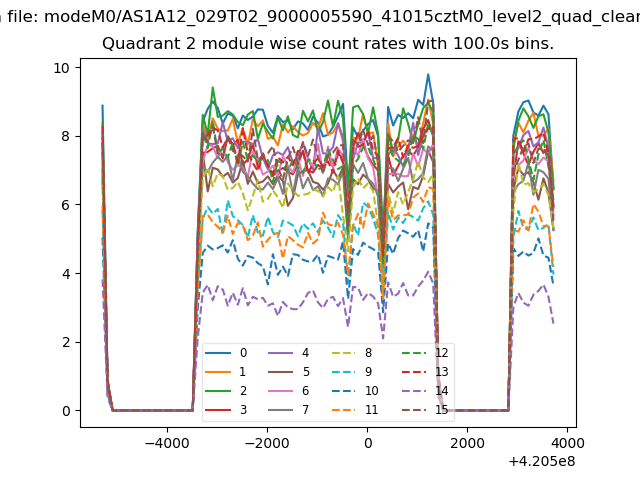
| Module-wise count rates for Quadrant B Data is divided into 100 sec bins |
 |
 |
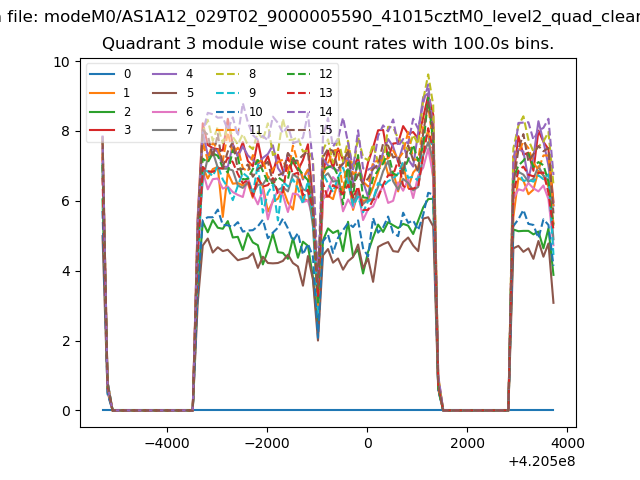
| Module-wise count rates for Quadrant C Data is divided into 100 sec bins |
 |
 |
| Module-wise count rates for Quadrant D Data is divided into 100 sec bins |
 |
 |
| Parameter | Plot |
|---|---|
| CZT HV Monitor | 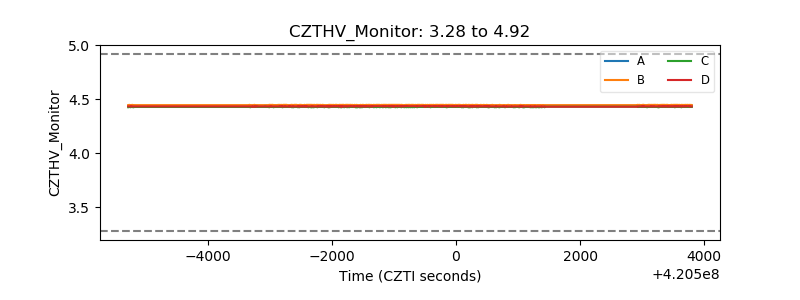 |
| D_VDD | 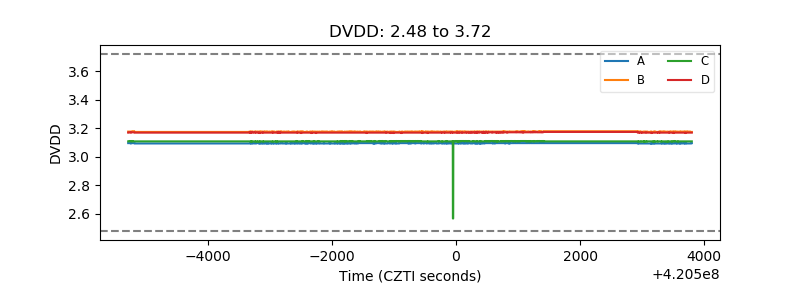 |
| Temperature 1 | 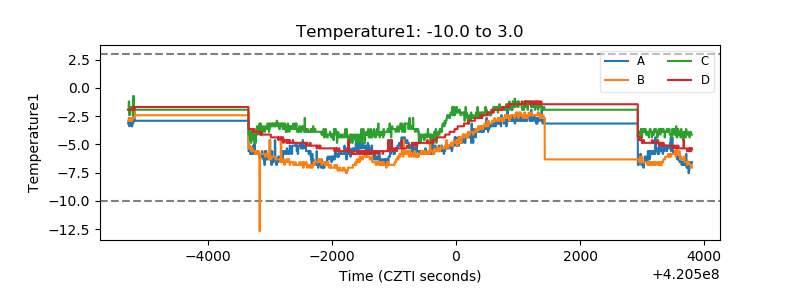 |
| Veto HV Monitor | 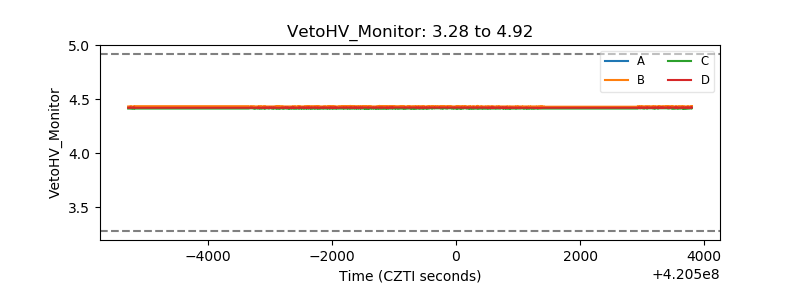 |
| Veto LLD | 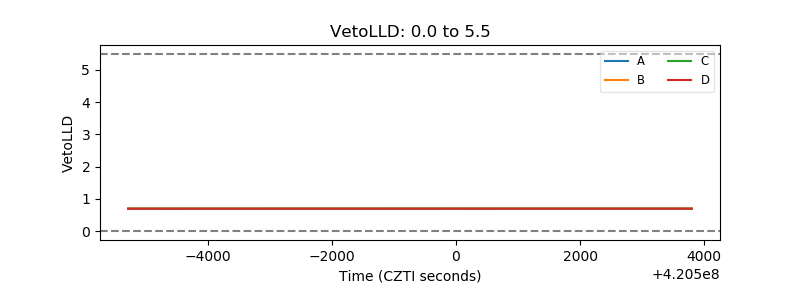 |
| Alpha Counter | 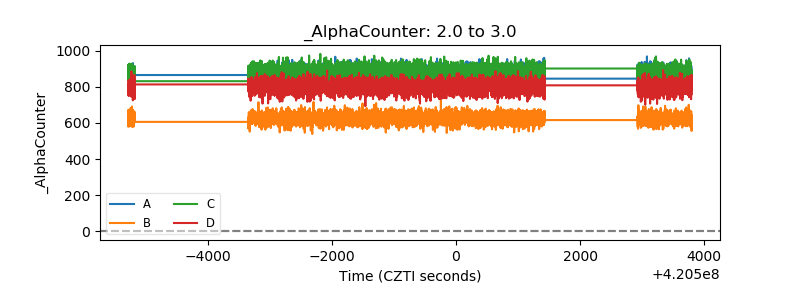 |
| _CPM_Rate | 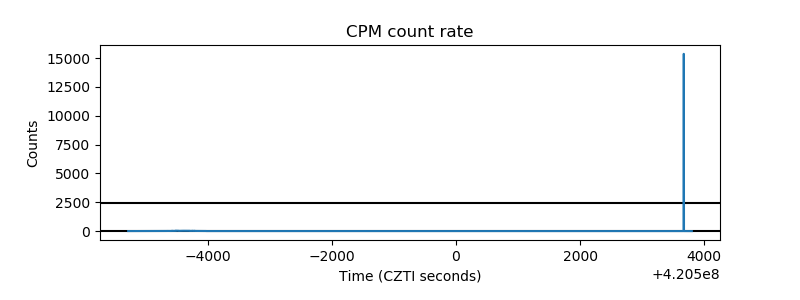 |
| CZT Counter | 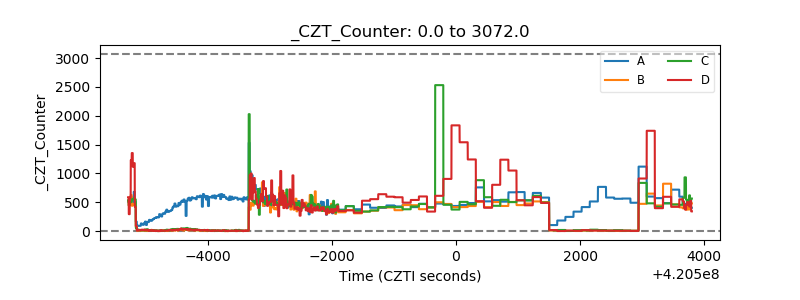 |
| +2.5 Volts monitor | 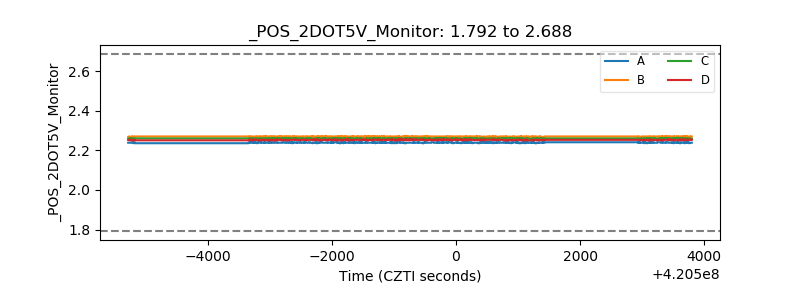 |
| +5 Volts monitor | 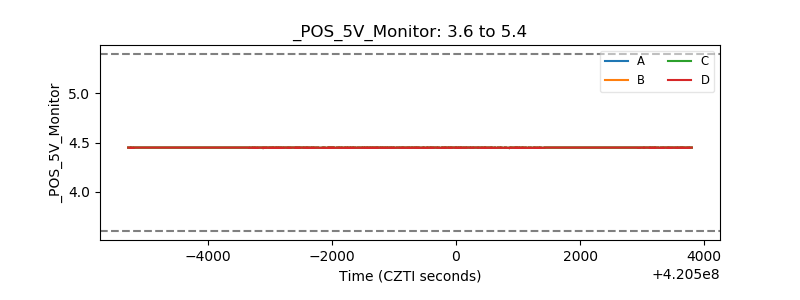 |
| _ROLL_ROT | 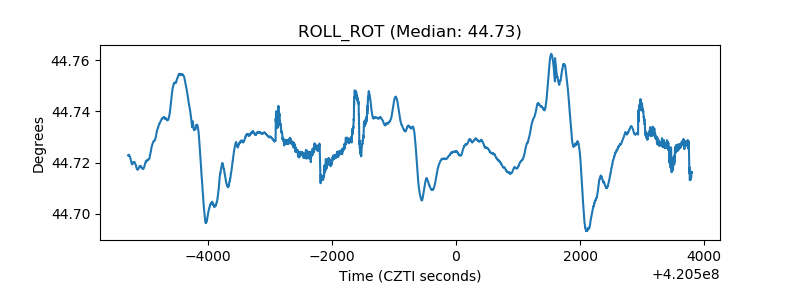 |
| _Roll_DEC | 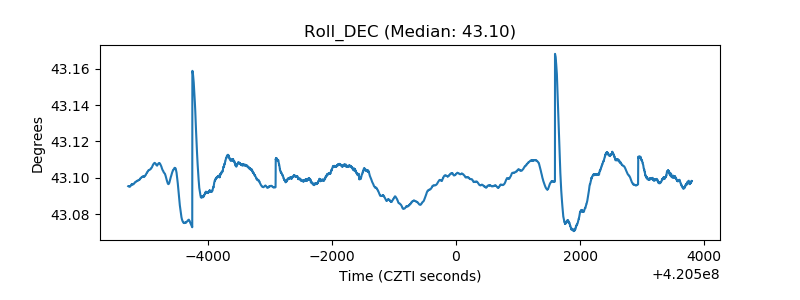 |
| _Roll_RA | 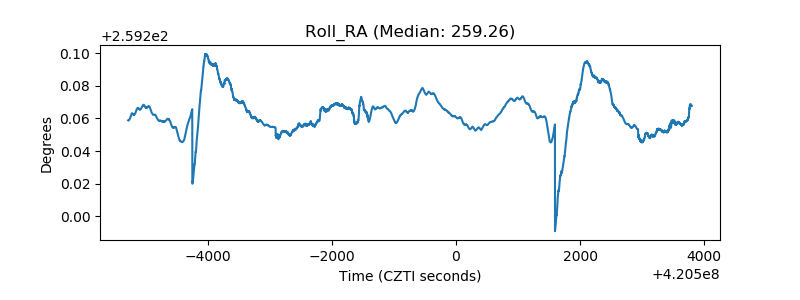 |
| Veto Counter | 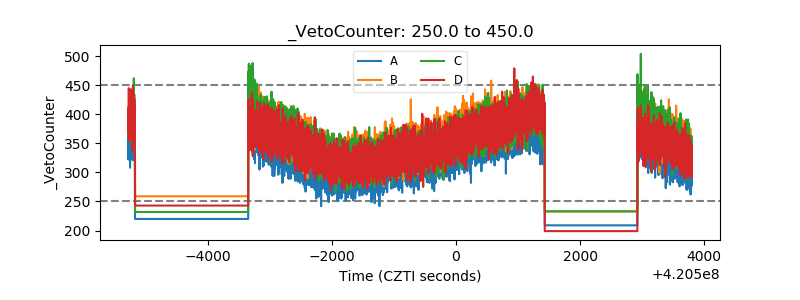 |