| Param | Original file | Final file |
|---|---|---|
| Filename | modeM0/AS1A12_029T02_9000005590_41016cztM0_level2.fits | modeM0/AS1A12_029T02_9000005590_41016cztM0_level2_quad_clean.evt |
| Size (bytes) | 358,801,920 | 93,522,240 |
| Size | 342.2 MB | 89.2 MB |
| Events in quadrant A | 3,131,983 | 617,532 |
| Events in quadrant B | 2,599,646 | 641,108 |
| Events in quadrant C | 3,466,364 | 604,326 |
| Events in quadrant D | 3,632,482 | 563,542 |
| Mode SS | |||
|---|---|---|---|
| Quadrant | BADHDUFLAG | Total packets | Discarded packets |
| A | 0 | 118 | 0 |
| B | 0 | 118 | 0 |
| C | 0 | 118 | 0 |
| D | 0 | 118 | 0 |
| Mode M0 | |||
|---|---|---|---|
| Quadrant | BADHDUFLAG | Total packets | Discarded packets |
| A | 0 | 12994 | 3 |
| B | 0 | 12022 | 2 |
| C | 0 | 13973 | 2 |
| D | 0 | 14744 | 2 |
| Mode M9 | |||
|---|---|---|---|
| Quadrant | BADHDUFLAG | Total packets | Discarded packets |
| A | 0 | 23 | 0 |
| B | 0 | 23 | 0 |
| C | 0 | 23 | 0 |
| D | 0 | 24 | 0 |
| Quadrant | Total seconds | Saturated seconds | Saturation percentage |
|---|---|---|---|
| A | 5796 | 58 | 1.000690% |
| B | 5796 | 10 | 0.172533% |
| C | 5796 | 171 | 2.950311% |
| D | 5796 | 80 | 1.380262% |
Noise dominated data is calculated using 1-second bins in cleaned event files. If a bin has >2000 counts, and if more than 50% of those come from <1% of pixels, then it is considered to be noise-dominated and hence unusable.
| Quadrant | # 1 sec bins | Bins with >0 counts | Bins with >2000 counts | High rate bins dominated by noise | Noise dominated (total time) | Noise dominated (detector-on time) | Marked lightcurve |
|---|---|---|---|---|---|---|---|
| A | 7139 | 5797 | 49 | 49 | 0.69% | 0.85% | 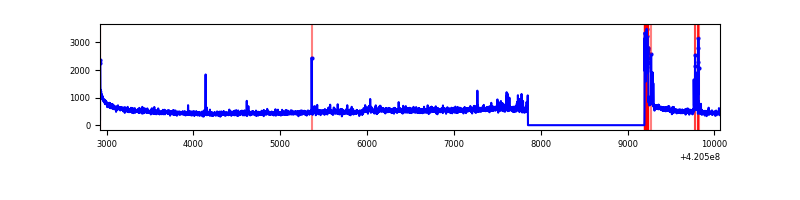 |
| B | 7139 | 5797 | 1 | 1 | 0.01% | 0.02% | 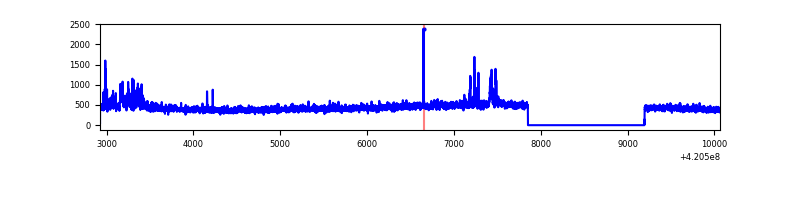 |
| C | 7139 | 5797 | 184 | 184 | 2.58% | 3.17% | 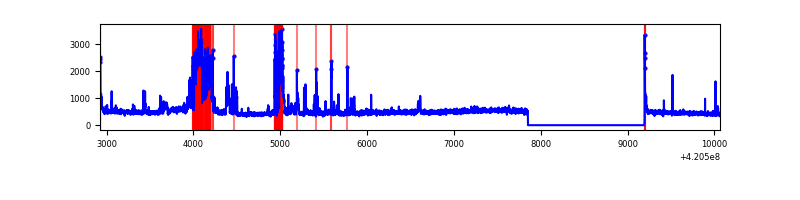 |
| D | 7139 | 5797 | 100 | 100 | 1.40% | 1.73% | 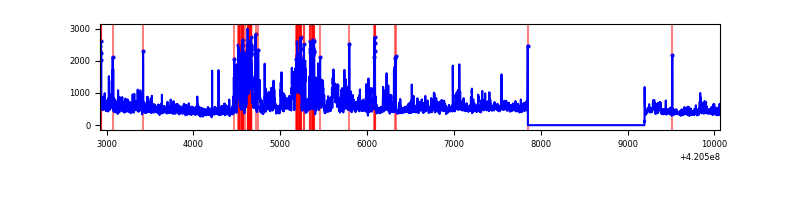 |
Top three noisy pixels from each quadrant. If the there are fewer than three noisy pixels in the level2.evt file, extra rows are filled as -1
| Pixel properties | Quadrant properties | ||||||
|---|---|---|---|---|---|---|---|
| Quadrant | DetID | PixID | Counts | Sigma | Mean | Median | Sigma |
| A | 10 | 83 | 505101 | 3978.57 | 618 | 606 | 126.8 |
| A | 9 | 191 | 175612 | 1380.14 | 618 | 606 | 126.8 |
| A | 12 | 189 | 36929 | 286.45 | 618 | 606 | 126.8 |
| B | 0 | 190 | 163251 | 1342.91 | 618 | 600 | 121.1 |
| B | 12 | 111 | 15598 | 123.83 | 618 | 600 | 121.1 |
| B | 11 | 111 | 14304 | 113.15 | 618 | 600 | 121.1 |
| C | 14 | 254 | 812854 | 5817.2 | 602 | 606 | 139.6 |
| C | 15 | 214 | 245423 | 1753.34 | 602 | 606 | 139.6 |
| C | 0 | 10 | 36846 | 259.55 | 602 | 606 | 139.6 |
| D | 1 | 47 | 585098 | 3990.75 | 603 | 586 | 146.5 |
| D | 12 | 79 | 382062 | 2604.52 | 603 | 586 | 146.5 |
| D | 13 | 249 | 253431 | 1726.3 | 603 | 586 | 146.5 |
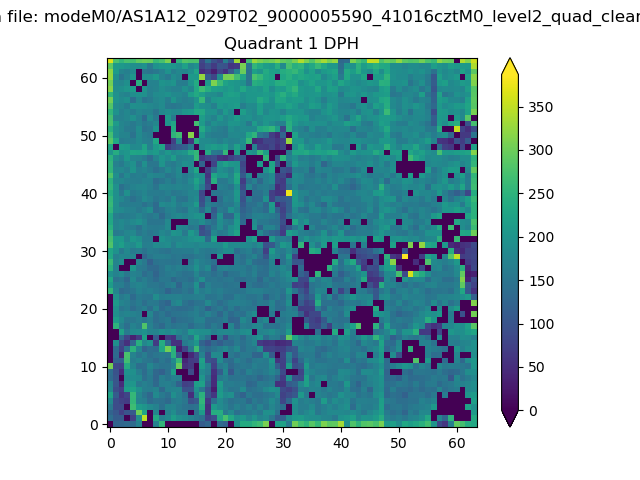
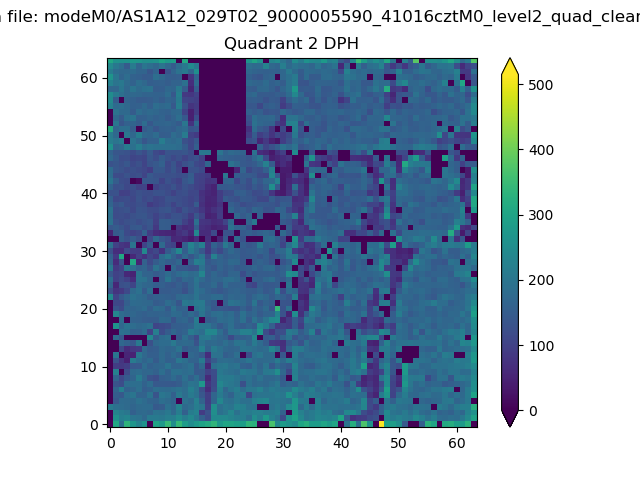
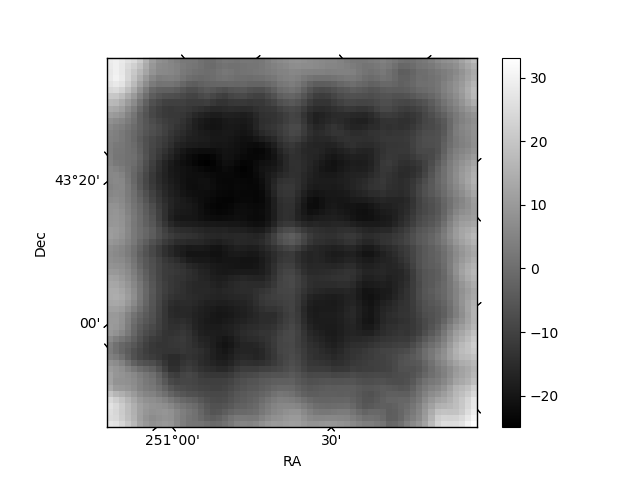
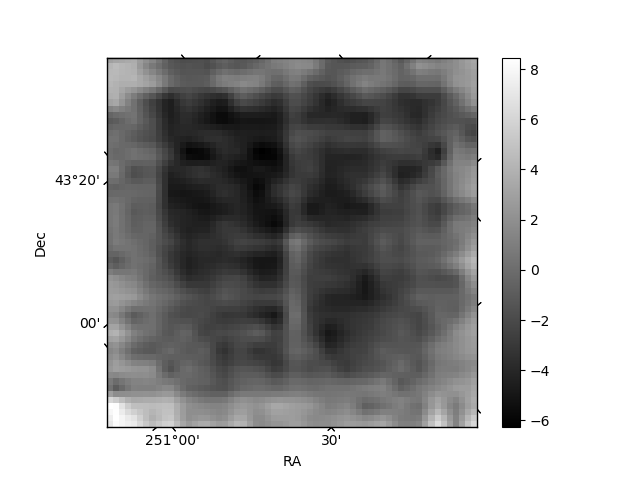
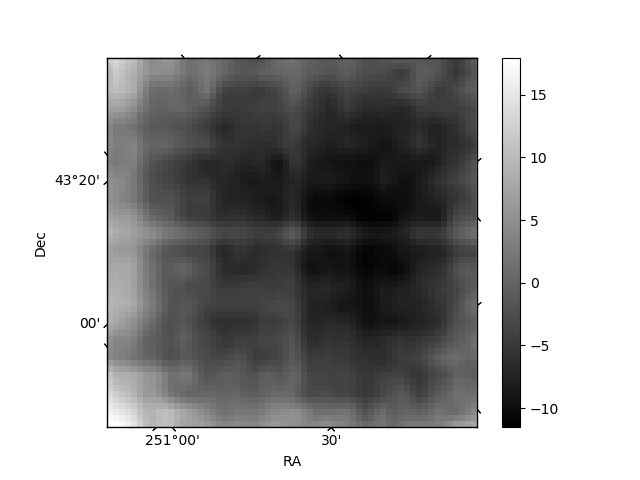
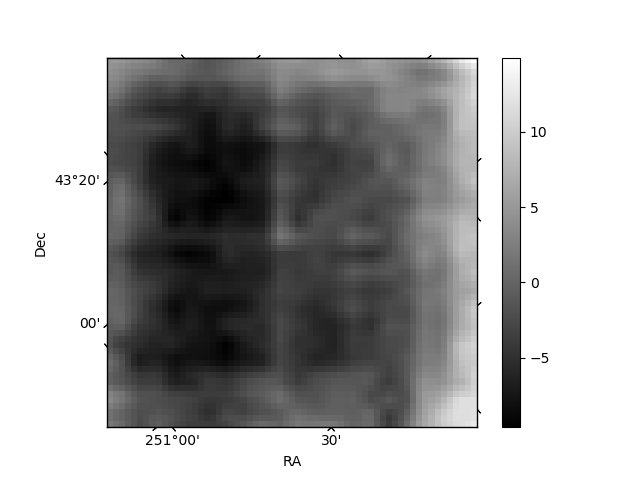
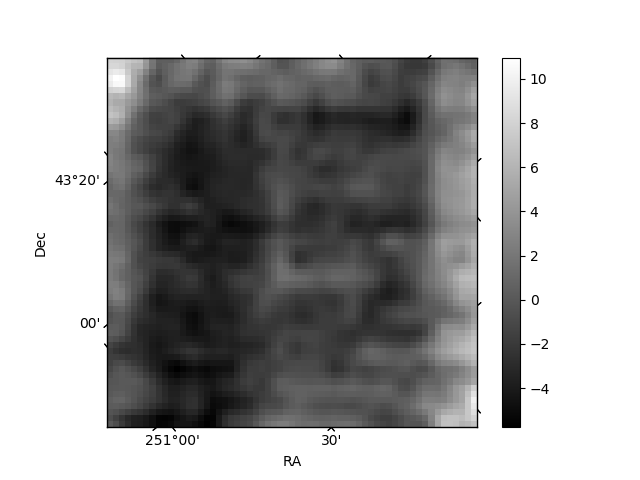
Histogram calculated using DETX and DETY for each event in the final _common_clean file
| Quadrant A |  |
 |
Quadrant B |
|---|---|---|---|
| Quadrant D | 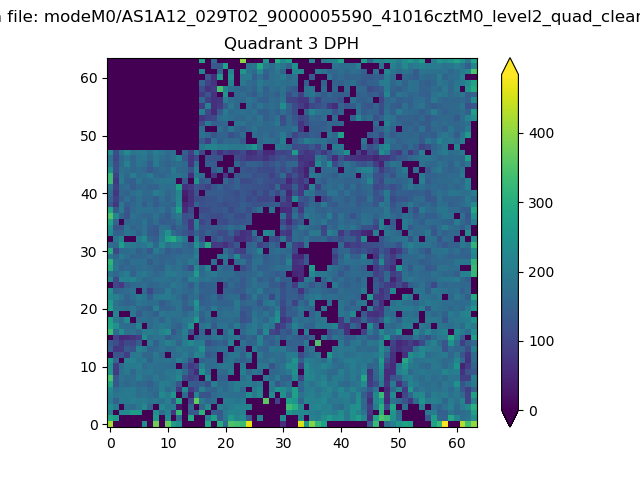 |
 |
Quadrant C |
| Plot type | Count rate plots | Images |
|---|---|---|
| Comparison with Poisson distribution Blue bars denote a histogram of data divided into 1 sec bins. Red curve is a Poisson curve with rate = median count rate of data. |
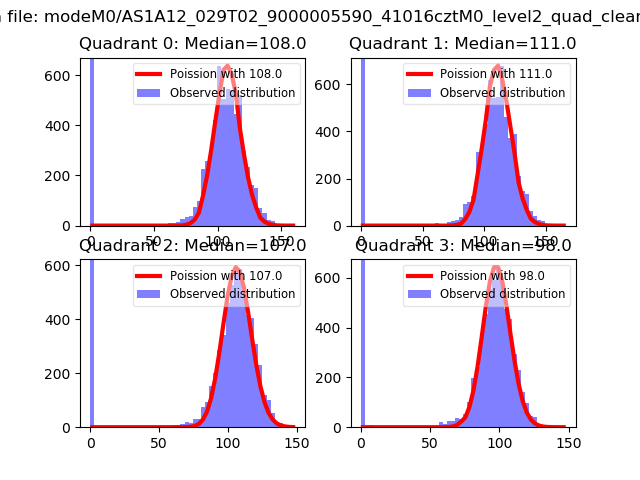 |
 |
| Quadrant-wise count rates Data is divided into 100 sec bins |
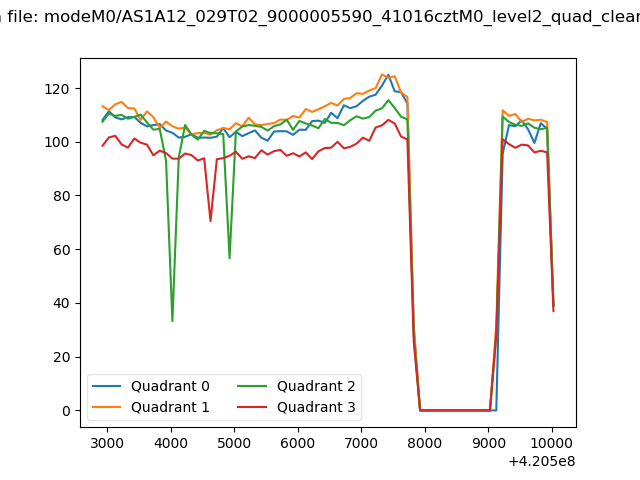 |
|
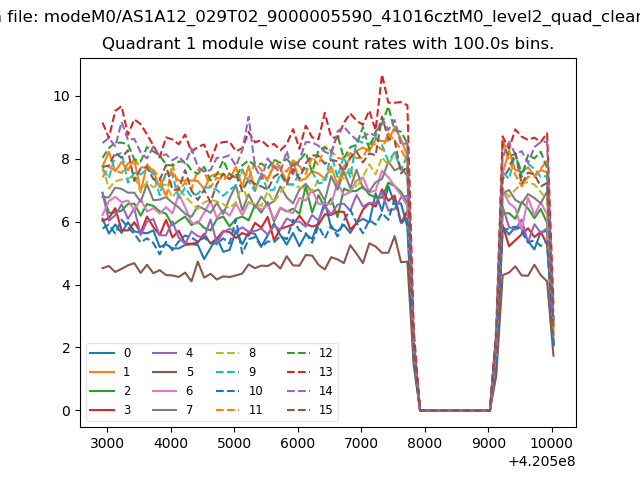
| Module-wise count rates for Quadrant A Data is divided into 100 sec bins |
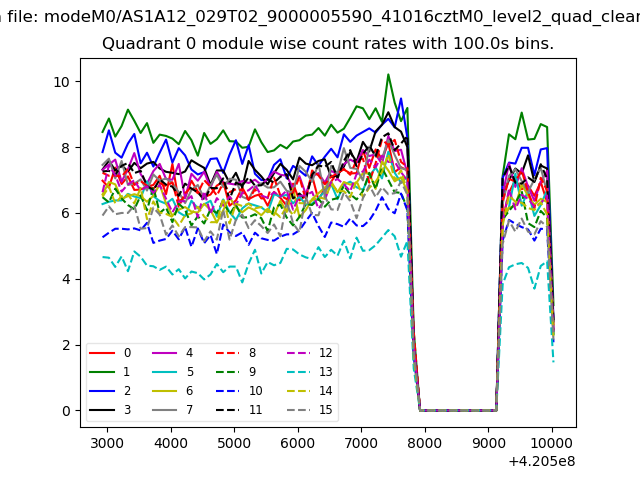 |
 |
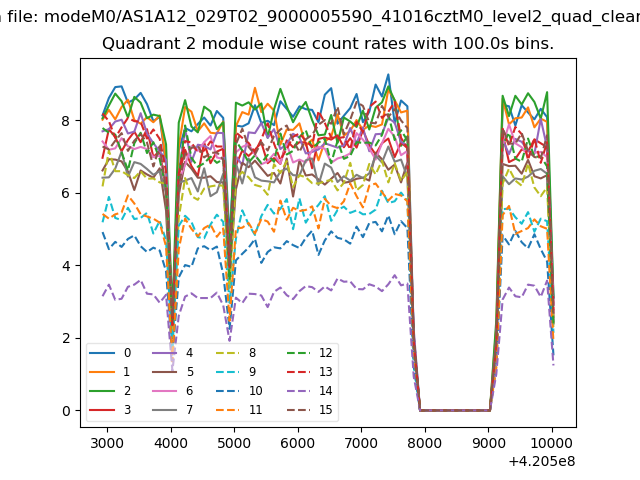
| Module-wise count rates for Quadrant B Data is divided into 100 sec bins |
 |
 |
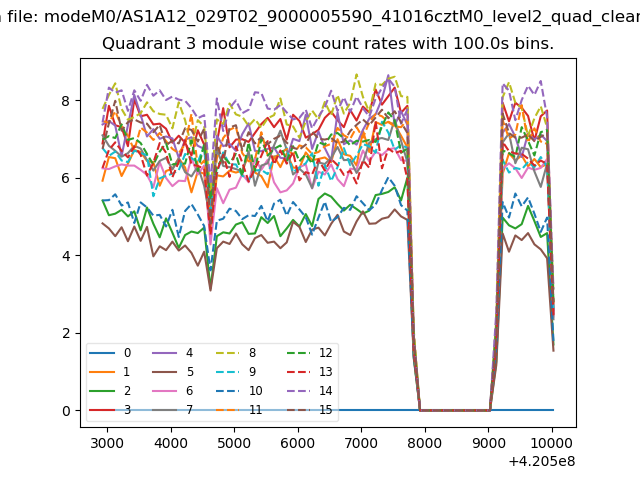
| Module-wise count rates for Quadrant C Data is divided into 100 sec bins |
 |
 |
| Module-wise count rates for Quadrant D Data is divided into 100 sec bins |
 |
 |
| Parameter | Plot |
|---|---|
| CZT HV Monitor | 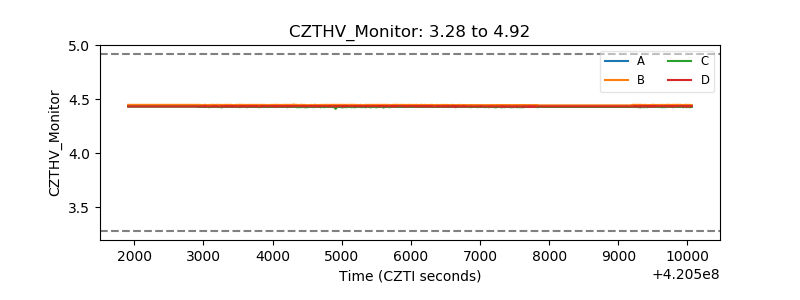 |
| D_VDD | 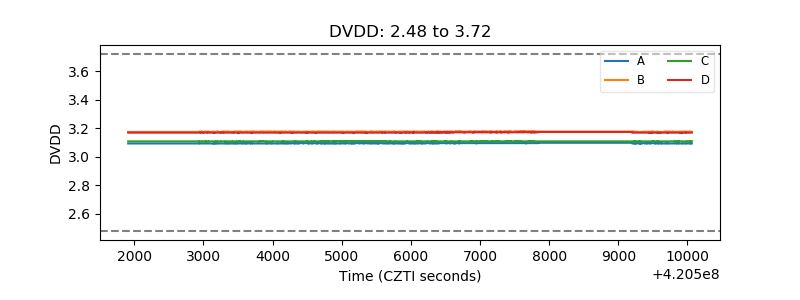 |
| Temperature 1 | 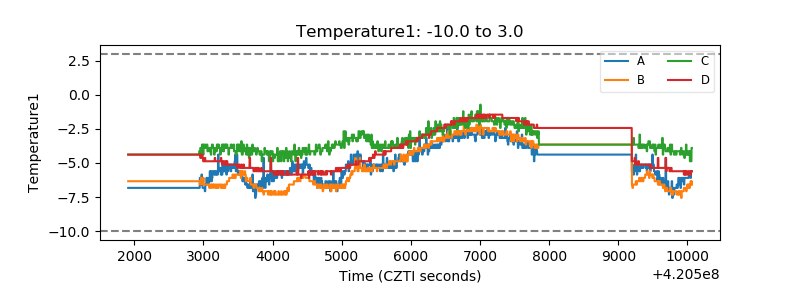 |
| Veto HV Monitor | 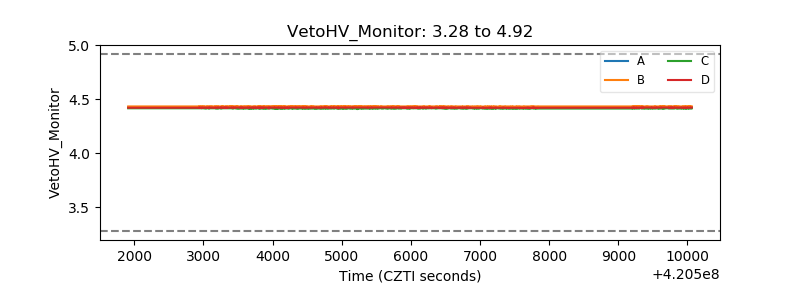 |
| Veto LLD | 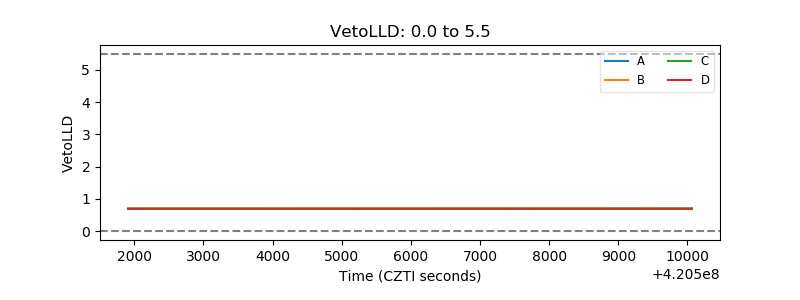 |
| Alpha Counter | 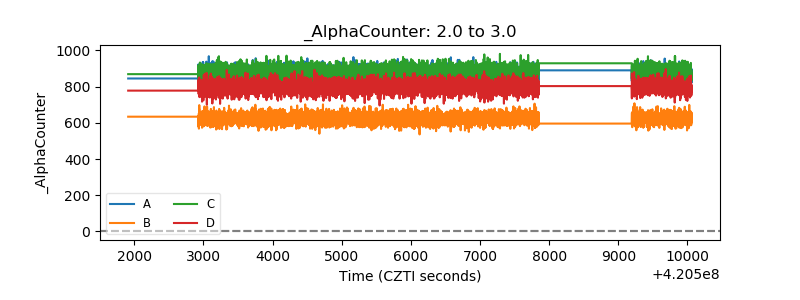 |
| _CPM_Rate | 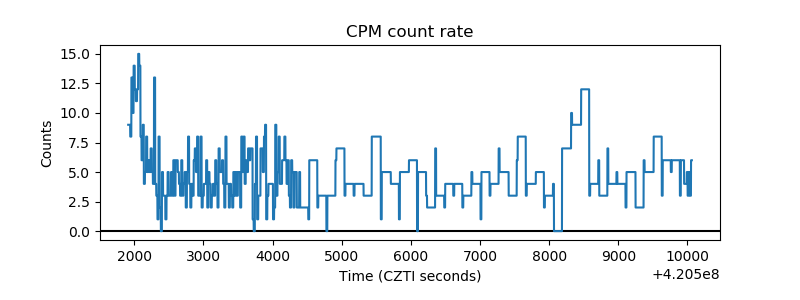 |
| CZT Counter | 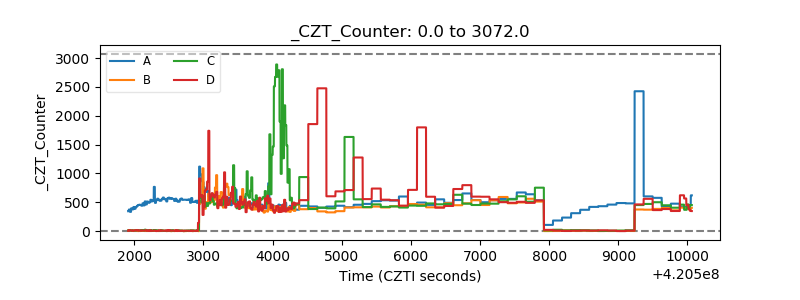 |
| +2.5 Volts monitor |  |
| +5 Volts monitor | 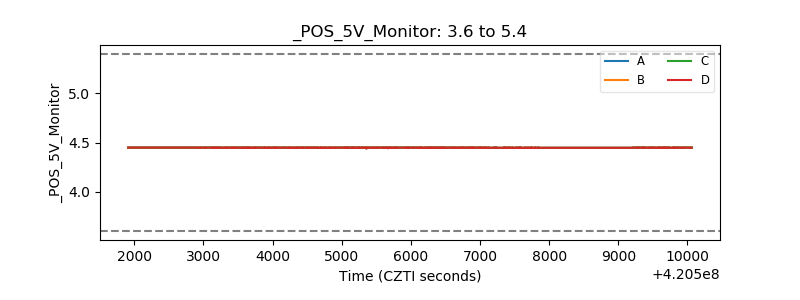 |
| _ROLL_ROT | 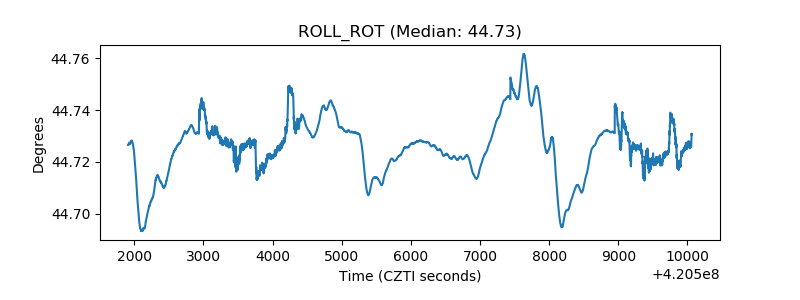 |
| _Roll_DEC |  |
| _Roll_RA | 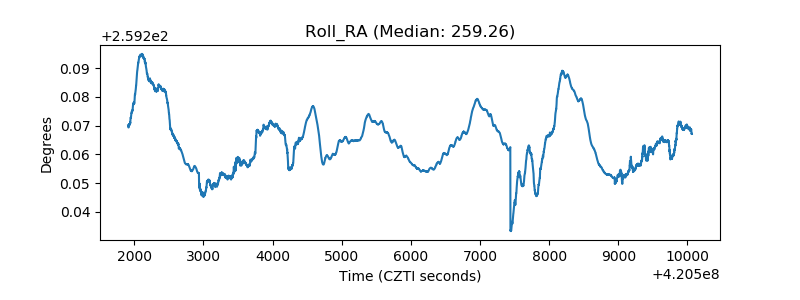 |
| Veto Counter | 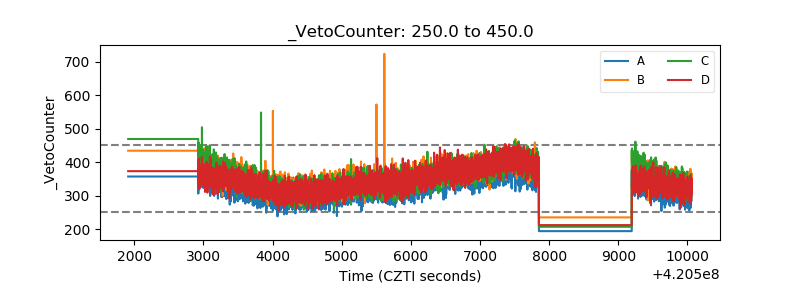 |