| Param | Original file | Final file |
|---|---|---|
| Filename | modeM0/AS1A12_029T02_9000005590_41019cztM0_level2.fits | modeM0/AS1A12_029T02_9000005590_41019cztM0_level2_quad_clean.evt |
| Size (bytes) | 964,739,520 | 261,573,120 |
| Size | 920.0 MB | 249.5 MB |
| Events in quadrant A | 9,259,645 | 1,735,371 |
| Events in quadrant B | 7,734,293 | 1,795,571 |
| Events in quadrant C | 7,745,919 | 1,729,032 |
| Events in quadrant D | 9,705,128 | 1,531,971 |
| Mode SS | |||
|---|---|---|---|
| Quadrant | BADHDUFLAG | Total packets | Discarded packets |
| A | 0 | 338 | 0 |
| B | 0 | 338 | 0 |
| C | 0 | 338 | 0 |
| D | 0 | 338 | 0 |
| Mode M0 | |||
|---|---|---|---|
| Quadrant | BADHDUFLAG | Total packets | Discarded packets |
| A | 0 | 37376 | 5 |
| B | 0 | 34681 | 4 |
| C | 0 | 33552 | 4 |
| D | 0 | 40478 | 4 |
| Mode M9 | |||
|---|---|---|---|
| Quadrant | BADHDUFLAG | Total packets | Discarded packets |
| A | 0 | 53 | 0 |
| B | 0 | 53 | 0 |
| C | 0 | 53 | 0 |
| D | 0 | 53 | 0 |
| Quadrant | Total seconds | Saturated seconds | Saturation percentage |
|---|---|---|---|
| A | 16342 | 209 | 1.278913% |
| B | 16342 | 99 | 0.605801% |
| C | 16342 | 37 | 0.226410% |
| D | 16342 | 647 | 3.959124% |
Noise dominated data is calculated using 1-second bins in cleaned event files. If a bin has >2000 counts, and if more than 50% of those come from <1% of pixels, then it is considered to be noise-dominated and hence unusable.
| Quadrant | # 1 sec bins | Bins with >0 counts | Bins with >2000 counts | High rate bins dominated by noise | Noise dominated (total time) | Noise dominated (detector-on time) | Marked lightcurve |
|---|---|---|---|---|---|---|---|
| A | 21775 | 16346 | 174 | 174 | 0.80% | 1.06% | 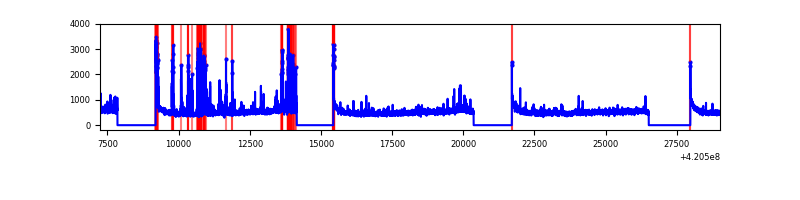 |
| B | 21775 | 16346 | 53 | 53 | 0.24% | 0.32% | 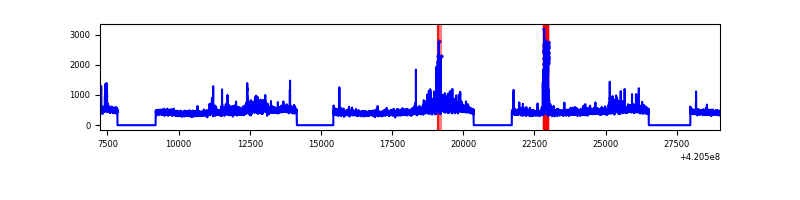 |
| C | 21775 | 16346 | 29 | 29 | 0.13% | 0.18% | 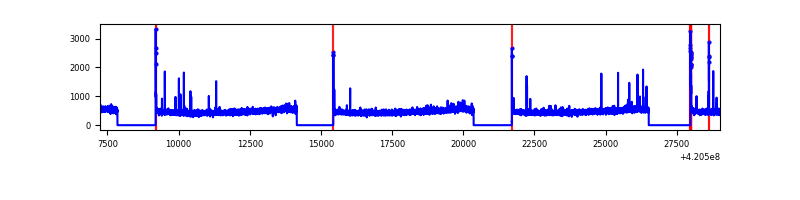 |
| D | 21775 | 16346 | 556 | 556 | 2.55% | 3.40% | 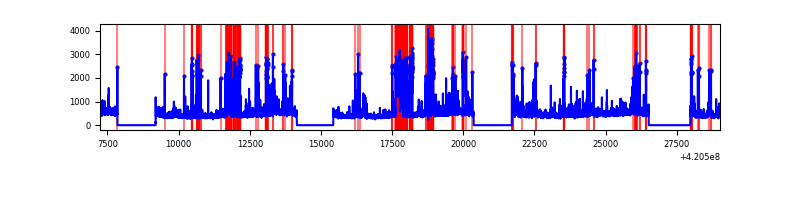 |
Top three noisy pixels from each quadrant. If the there are fewer than three noisy pixels in the level2.evt file, extra rows are filled as -1
| Pixel properties | Quadrant properties | ||||||
|---|---|---|---|---|---|---|---|
| Quadrant | DetID | PixID | Counts | Sigma | Mean | Median | Sigma |
| A | 10 | 83 | 1304410 | 3567.19 | 1793 | 1757 | 365.2 |
| A | 9 | 191 | 776251 | 2120.88 | 1793 | 1757 | 365.2 |
| A | 12 | 189 | 120773 | 325.91 | 1793 | 1757 | 365.2 |
| B | 0 | 190 | 693615 | 1999.2 | 1786 | 1735 | 346.1 |
| B | 12 | 111 | 45542 | 126.58 | 1786 | 1735 | 346.1 |
| B | 11 | 111 | 41861 | 115.94 | 1786 | 1735 | 346.1 |
| C | 15 | 214 | 695874 | 1709.44 | 1758 | 1765 | 406.0 |
| C | 0 | 10 | 99216 | 240.0 | 1758 | 1765 | 406.0 |
| C | 12 | 249 | 81102 | 195.39 | 1758 | 1765 | 406.0 |
| D | 13 | 249 | 1792503 | 4281.01 | 1724 | 1675 | 418.3 |
| D | 1 | 47 | 298041 | 708.47 | 1724 | 1675 | 418.3 |
| D | 2 | 249 | 263811 | 626.64 | 1724 | 1675 | 418.3 |
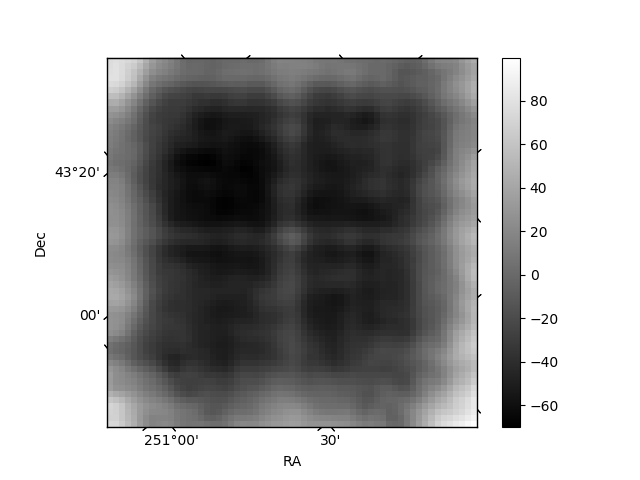
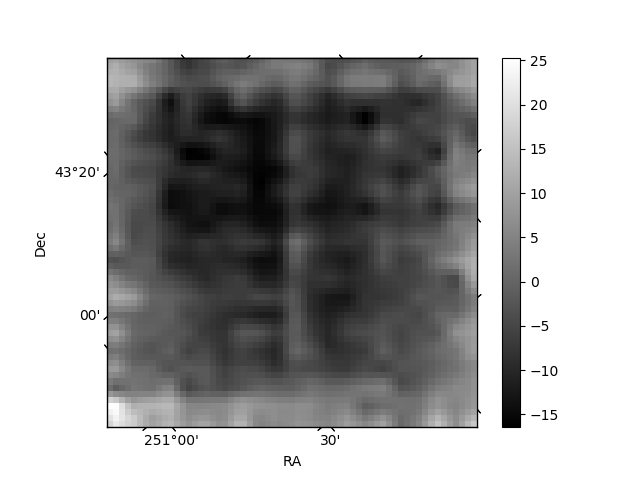
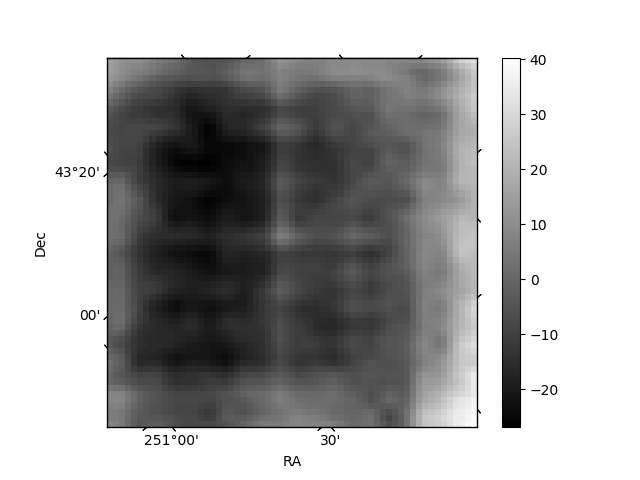
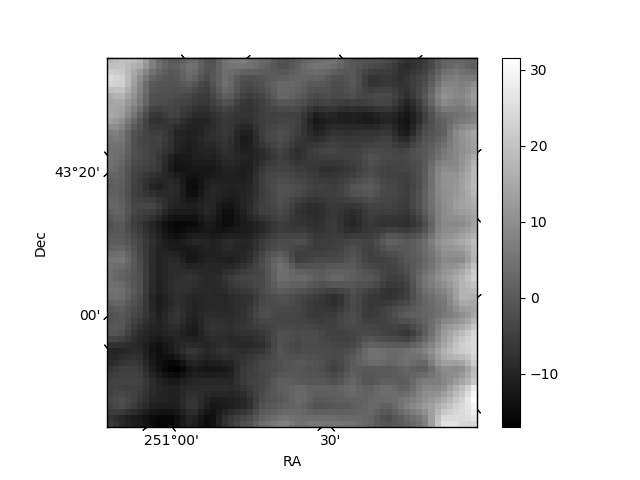
Histogram calculated using DETX and DETY for each event in the final _common_clean file
| Quadrant A | 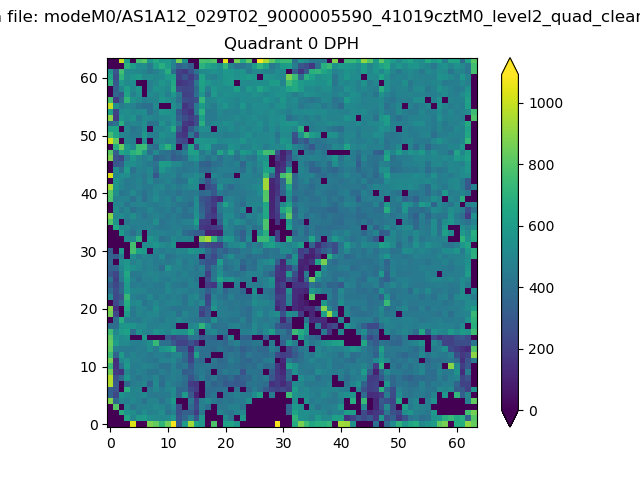 |
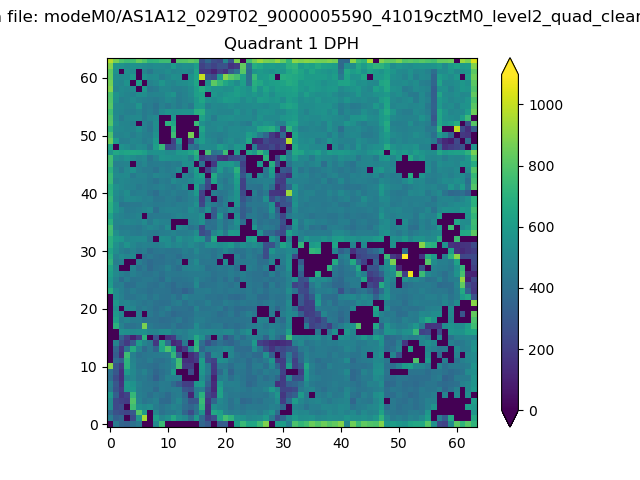 |
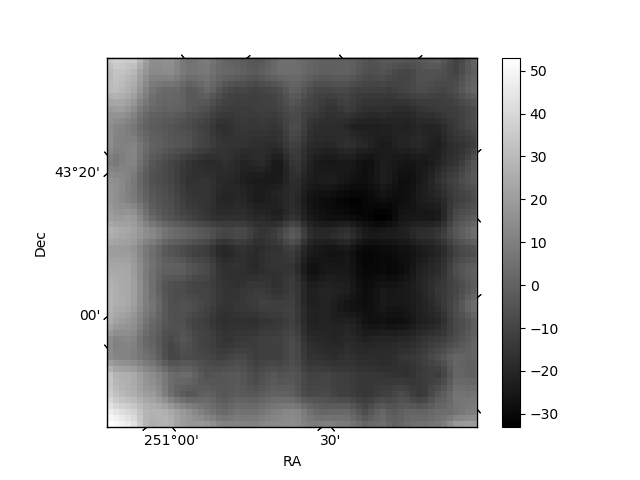
Quadrant B |
|---|---|---|---|
| Quadrant D | 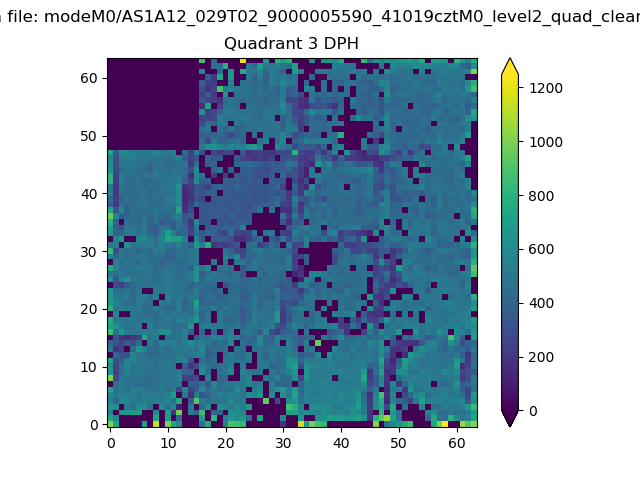 |
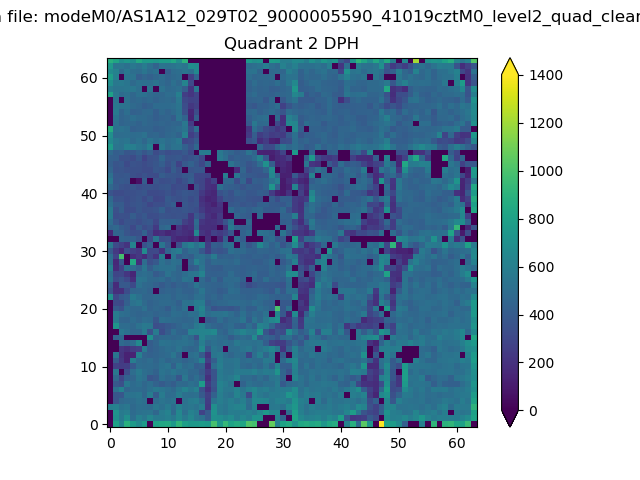 |
Quadrant C |
| Plot type | Count rate plots | Images |
|---|---|---|
| Comparison with Poisson distribution Blue bars denote a histogram of data divided into 1 sec bins. Red curve is a Poisson curve with rate = median count rate of data. |
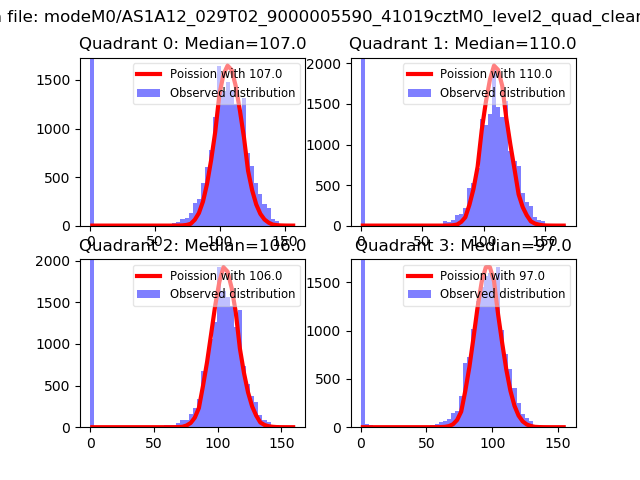 |
 |
| Quadrant-wise count rates Data is divided into 100 sec bins |
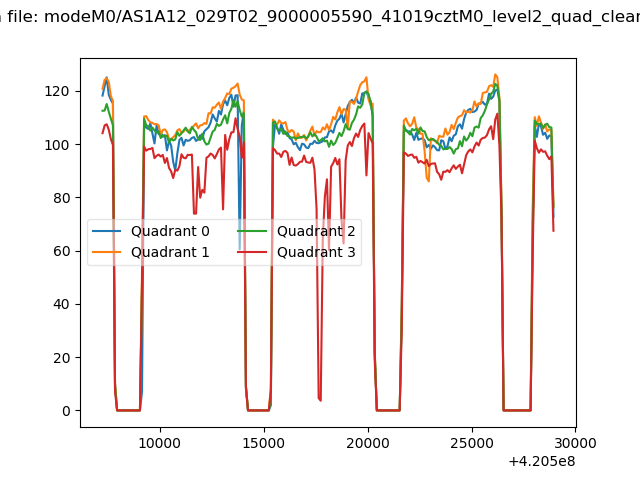 |
|
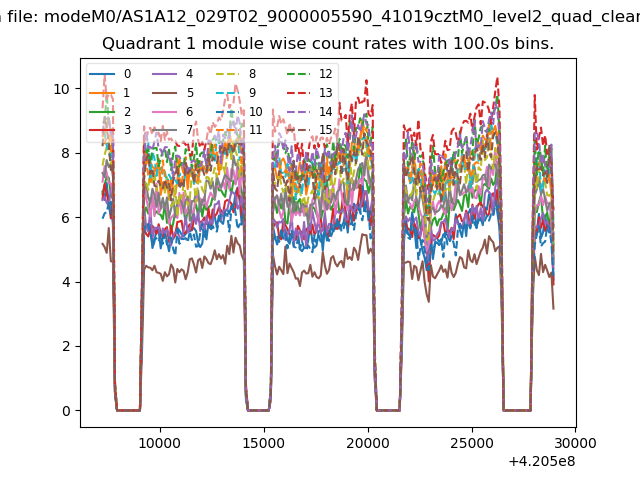
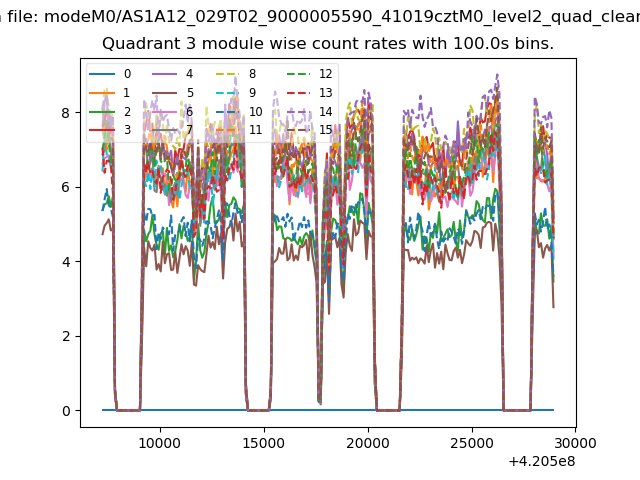
| Module-wise count rates for Quadrant A Data is divided into 100 sec bins |
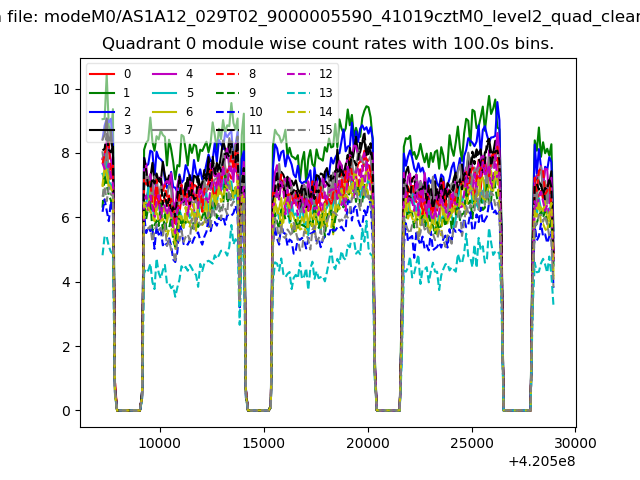 |
 |
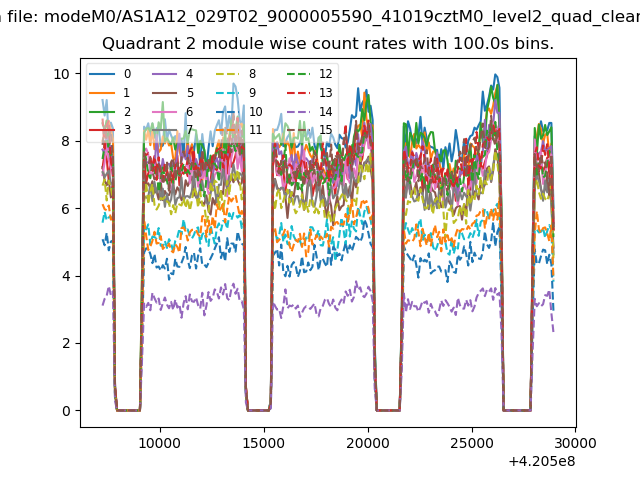
| Module-wise count rates for Quadrant B Data is divided into 100 sec bins |
 |
 |
| Module-wise count rates for Quadrant C Data is divided into 100 sec bins |
 |
 |
| Module-wise count rates for Quadrant D Data is divided into 100 sec bins |
 |
 |
| Parameter | Plot |
|---|---|
| CZT HV Monitor | 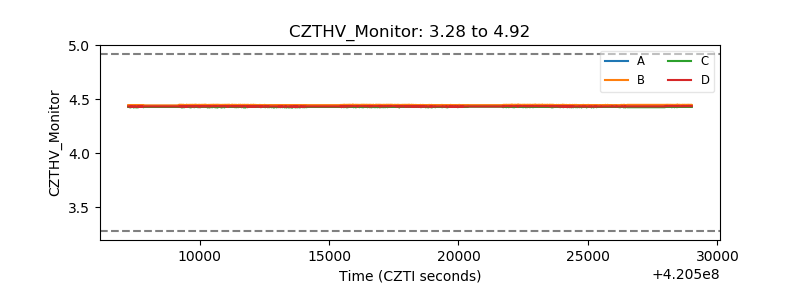 |
| D_VDD | 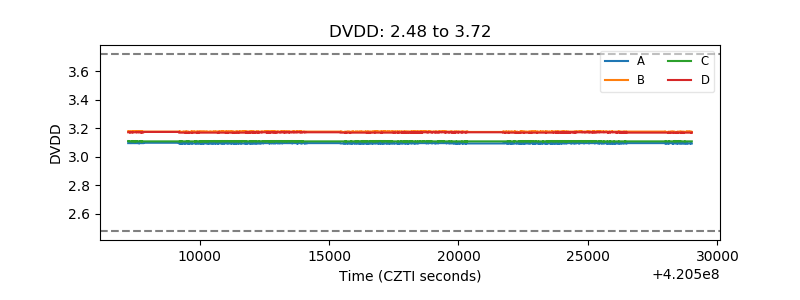 |
| Temperature 1 | 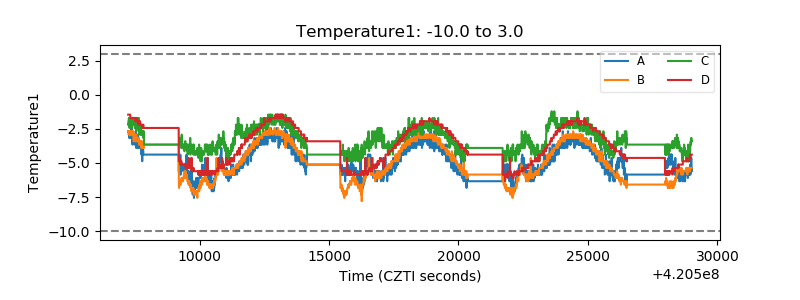 |
| Veto HV Monitor |  |
| Veto LLD | 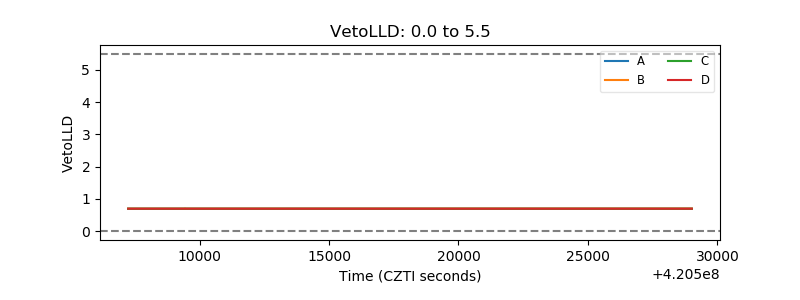 |
| Alpha Counter |  |
| _CPM_Rate |  |
| CZT Counter | 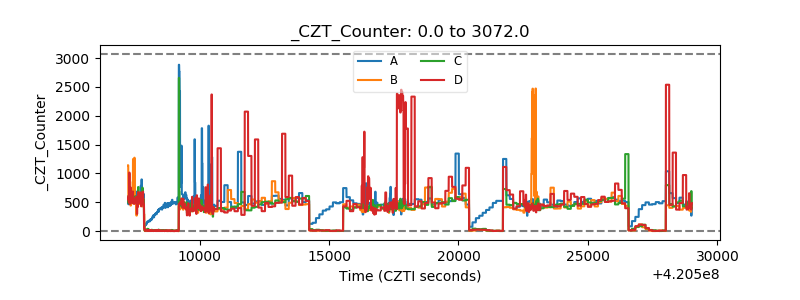 |
| +2.5 Volts monitor | 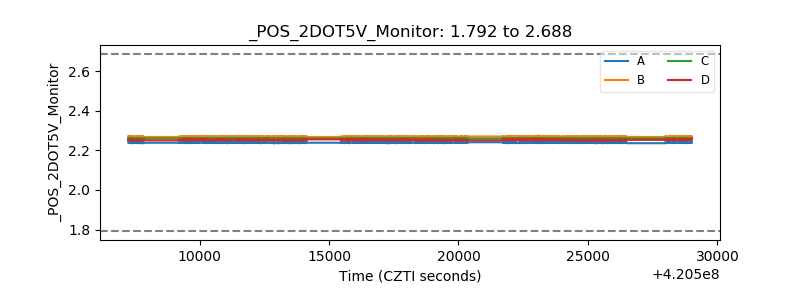 |
| +5 Volts monitor |  |
| _ROLL_ROT | 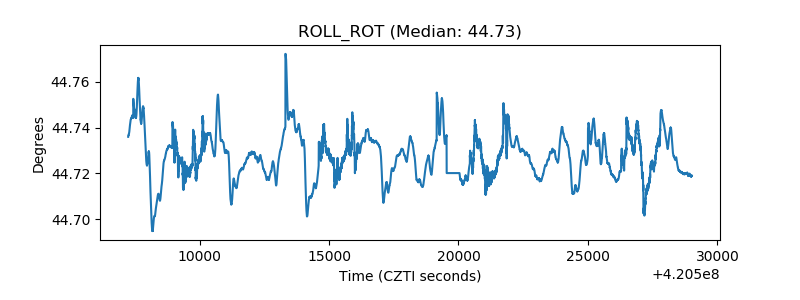 |
| _Roll_DEC | 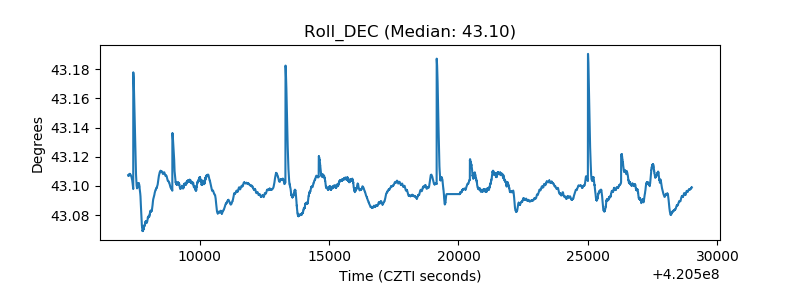 |
| _Roll_RA | 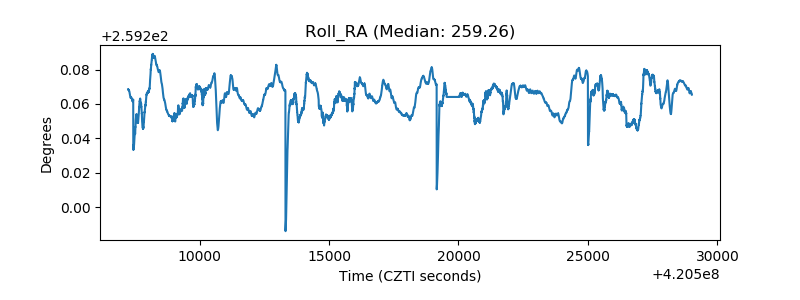 |
| Veto Counter | 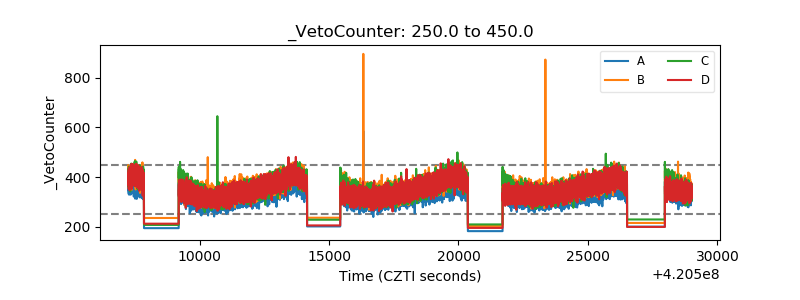 |