| Param | Original file | Final file |
|---|---|---|
| Filename | modeM0/AS1A12_029T02_9000005590_41021cztM0_level2.fits | modeM0/AS1A12_029T02_9000005590_41021cztM0_level2_quad_clean.evt |
| Size (bytes) | 340,997,760 | 90,696,960 |
| Size | 325.2 MB | 86.5 MB |
| Events in quadrant A | 3,057,351 | 613,495 |
| Events in quadrant B | 2,516,800 | 629,759 |
| Events in quadrant C | 2,836,615 | 596,067 |
| Events in quadrant D | 3,781,425 | 520,425 |
| Mode SS | |||
|---|---|---|---|
| Quadrant | BADHDUFLAG | Total packets | Discarded packets |
| A | 0 | 110 | 0 |
| B | 0 | 110 | 0 |
| C | 0 | 110 | 0 |
| D | 0 | 110 | 0 |
| Mode M0 | |||
|---|---|---|---|
| Quadrant | BADHDUFLAG | Total packets | Discarded packets |
| A | 0 | 12292 | 3 |
| B | 0 | 11238 | 2 |
| C | 0 | 11758 | 2 |
| D | 0 | 15213 | 2 |
| Mode M9 | |||
|---|---|---|---|
| Quadrant | BADHDUFLAG | Total packets | Discarded packets |
| A | 0 | 25 | 0 |
| B | 0 | 25 | 0 |
| C | 0 | 25 | 0 |
| D | 0 | 26 | 0 |
| Quadrant | Total seconds | Saturated seconds | Saturation percentage |
|---|---|---|---|
| A | 5525 | 11 | 0.199095% |
| B | 5525 | 12 | 0.217195% |
| C | 5525 | 46 | 0.832579% |
| D | 5525 | 392 | 7.095023% |
Noise dominated data is calculated using 1-second bins in cleaned event files. If a bin has >2000 counts, and if more than 50% of those come from <1% of pixels, then it is considered to be noise-dominated and hence unusable.
| Quadrant | # 1 sec bins | Bins with >0 counts | Bins with >2000 counts | High rate bins dominated by noise | Noise dominated (total time) | Noise dominated (detector-on time) | Marked lightcurve |
|---|---|---|---|---|---|---|---|
| A | 7228 | 5526 | 3 | 3 | 0.04% | 0.05% | 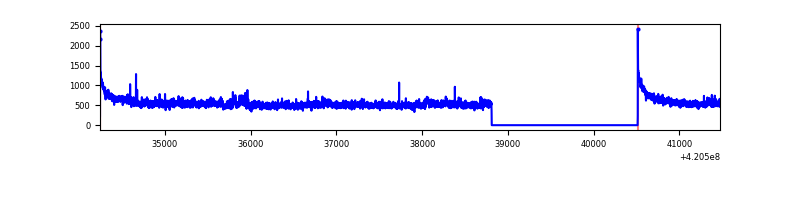 |
| B | 7228 | 5526 | 9 | 9 | 0.12% | 0.16% | 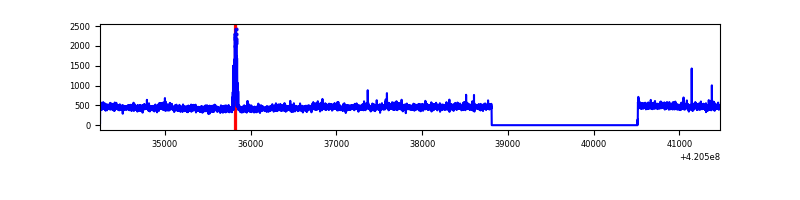 |
| C | 7228 | 5526 | 44 | 44 | 0.61% | 0.80% | 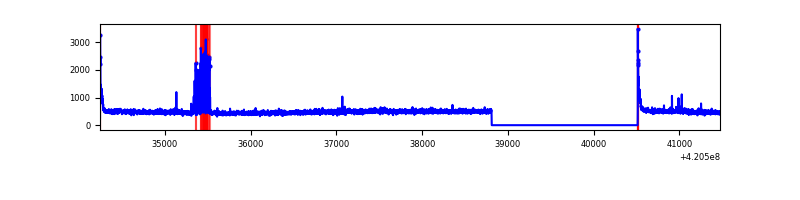 |
| D | 7228 | 5526 | 329 | 329 | 4.55% | 5.95% | 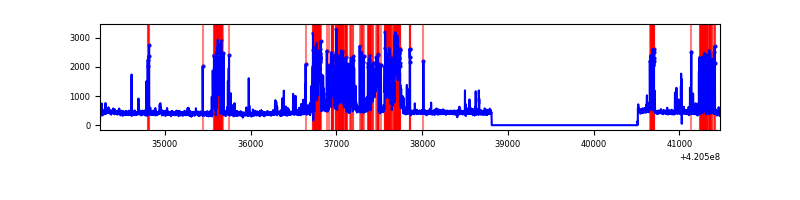 |
Top three noisy pixels from each quadrant. If the there are fewer than three noisy pixels in the level2.evt file, extra rows are filled as -1
| Pixel properties | Quadrant properties | ||||||
|---|---|---|---|---|---|---|---|
| Quadrant | DetID | PixID | Counts | Sigma | Mean | Median | Sigma |
| A | 10 | 83 | 504115 | 3949.3 | 622 | 609 | 127.5 |
| A | 12 | 189 | 138193 | 1079.16 | 622 | 609 | 127.5 |
| A | 13 | 254 | 8061 | 58.45 | 622 | 609 | 127.5 |
| B | 0 | 190 | 78204 | 649.95 | 614 | 597 | 119.4 |
| B | 0 | 229 | 20974 | 170.66 | 614 | 597 | 119.4 |
| B | 12 | 111 | 15718 | 126.64 | 614 | 597 | 119.4 |
| C | 15 | 214 | 239290 | 1694.8 | 601 | 604 | 140.8 |
| C | 15 | 159 | 155370 | 1098.92 | 601 | 604 | 140.8 |
| C | 0 | 10 | 60435 | 424.83 | 601 | 604 | 140.8 |
| D | 13 | 249 | 1262212 | 8847.3 | 586 | 571 | 142.6 |
| D | 9 | 19 | 133007 | 928.71 | 586 | 571 | 142.6 |
| D | 5 | 32 | 35207 | 242.89 | 586 | 571 | 142.6 |
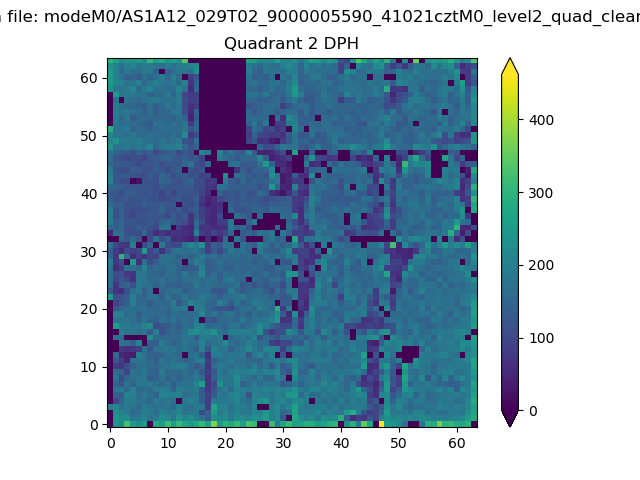
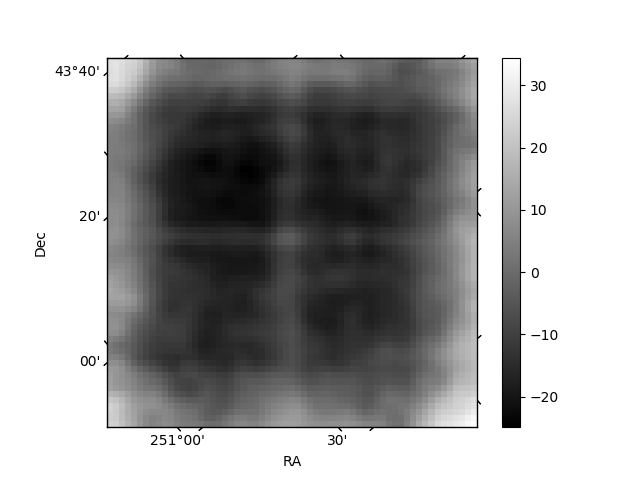
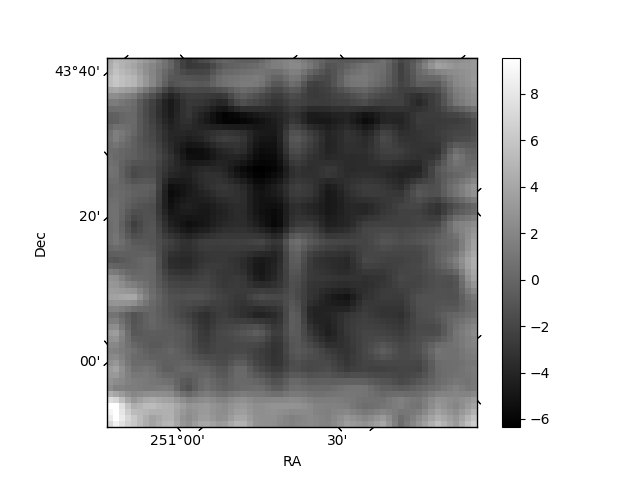
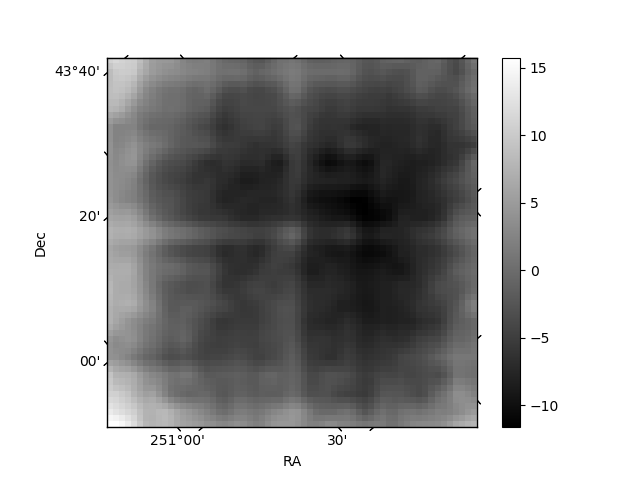
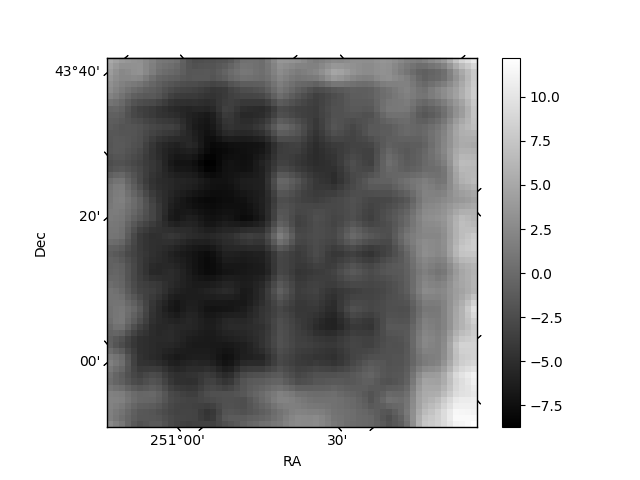
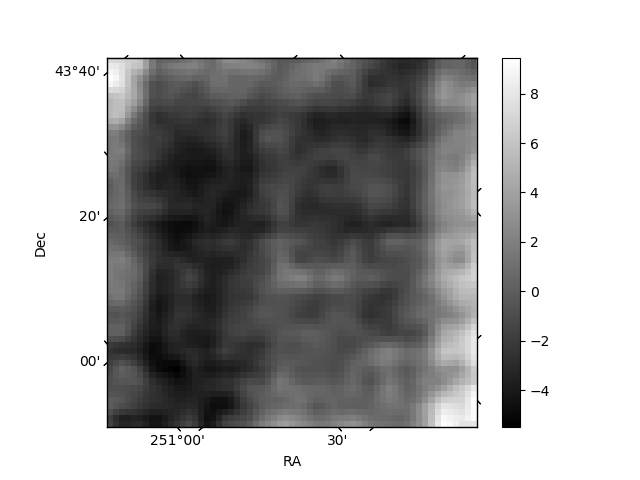
Histogram calculated using DETX and DETY for each event in the final _common_clean file
| Quadrant A | 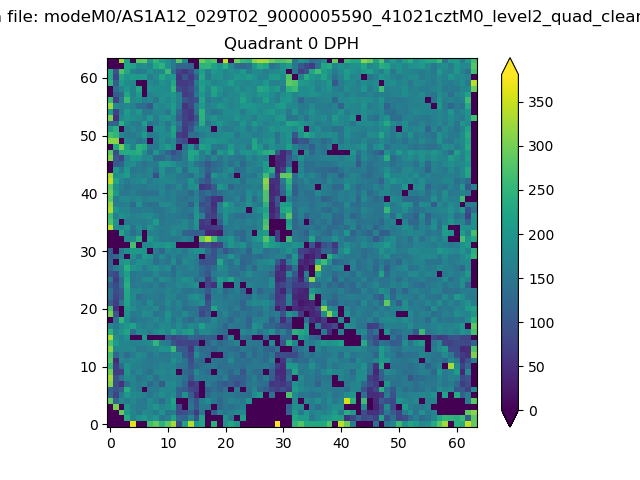 |
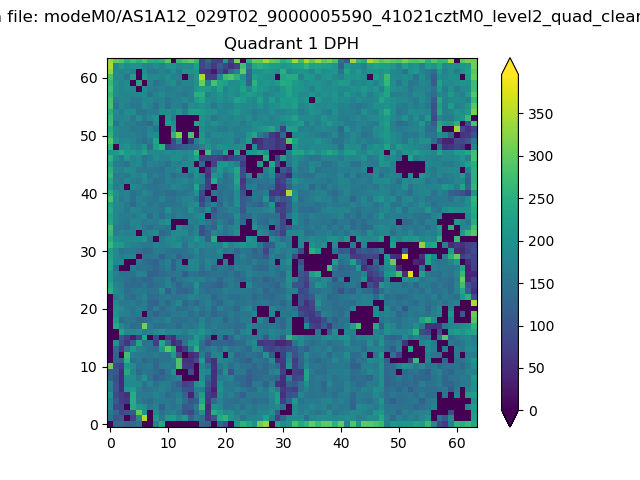 |
Quadrant B |
|---|---|---|---|
| Quadrant D | 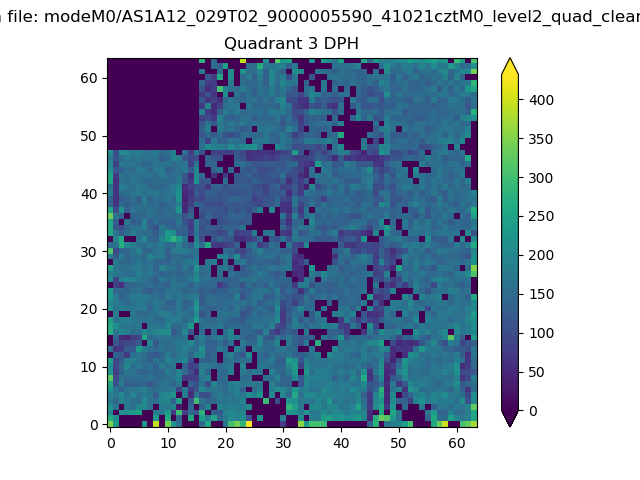 |
 |
Quadrant C |
| Plot type | Count rate plots | Images |
|---|---|---|
| Comparison with Poisson distribution Blue bars denote a histogram of data divided into 1 sec bins. Red curve is a Poisson curve with rate = median count rate of data. |
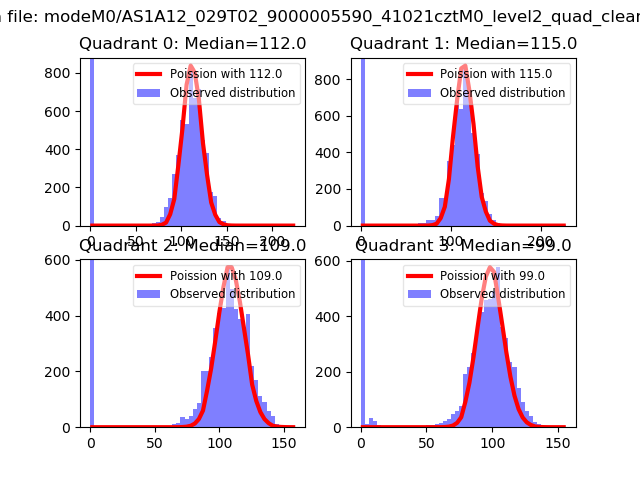 |
 |
| Quadrant-wise count rates Data is divided into 100 sec bins |
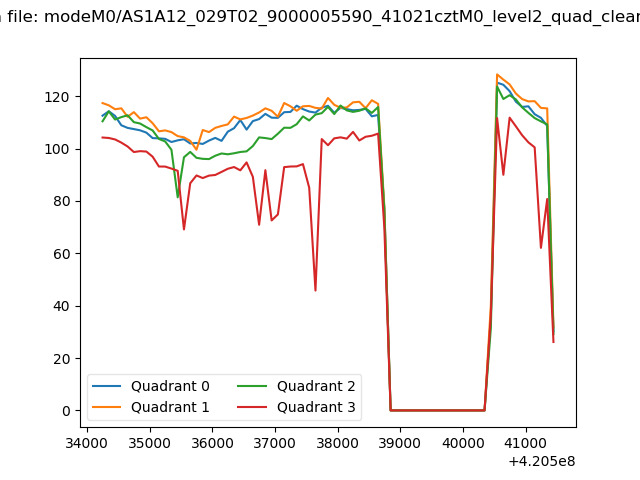 |
|
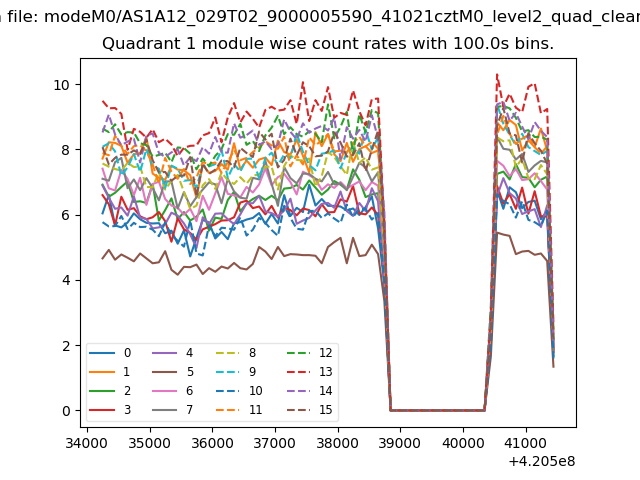
| Module-wise count rates for Quadrant A Data is divided into 100 sec bins |
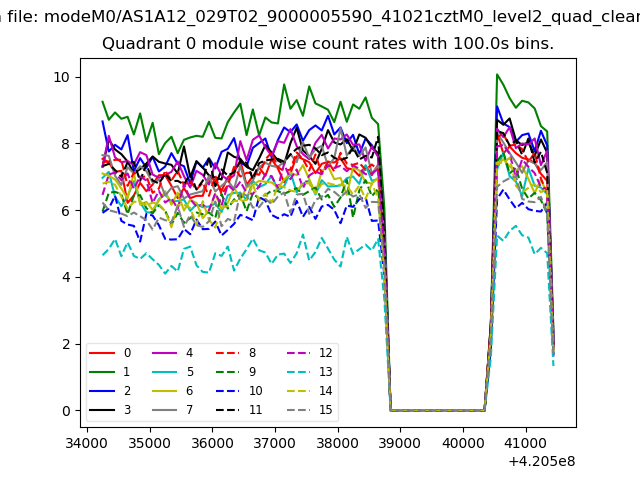 |
 |
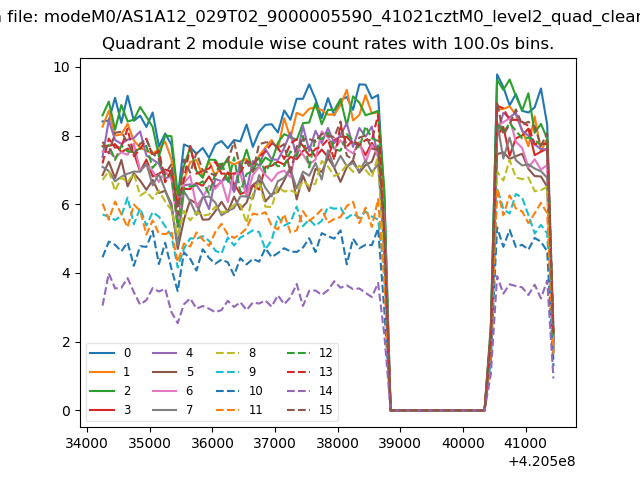
| Module-wise count rates for Quadrant B Data is divided into 100 sec bins |
 |
 |
| Module-wise count rates for Quadrant C Data is divided into 100 sec bins |
 |
 |
| Module-wise count rates for Quadrant D Data is divided into 100 sec bins |
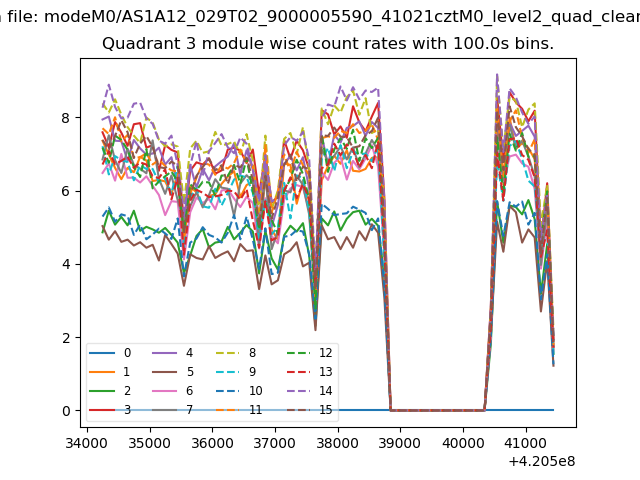 |
 |
| Parameter | Plot |
|---|---|
| CZT HV Monitor | 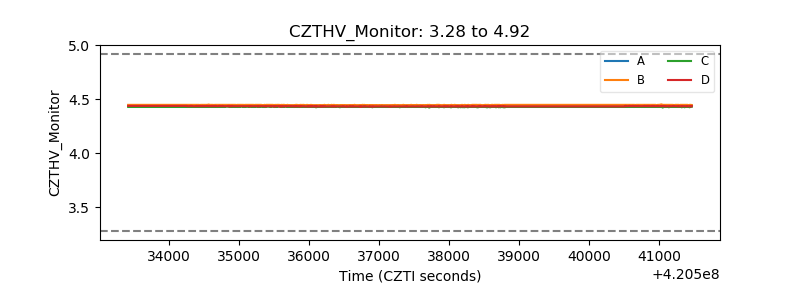 |
| D_VDD | 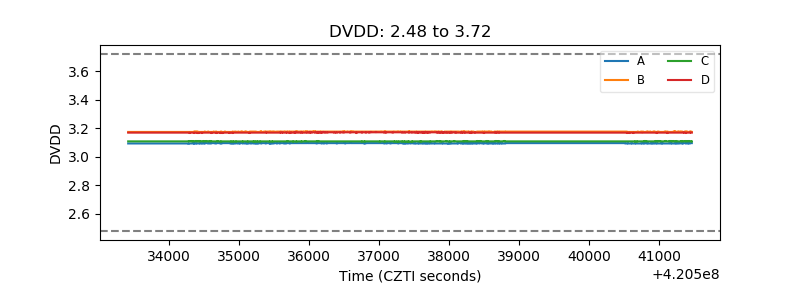 |
| Temperature 1 | 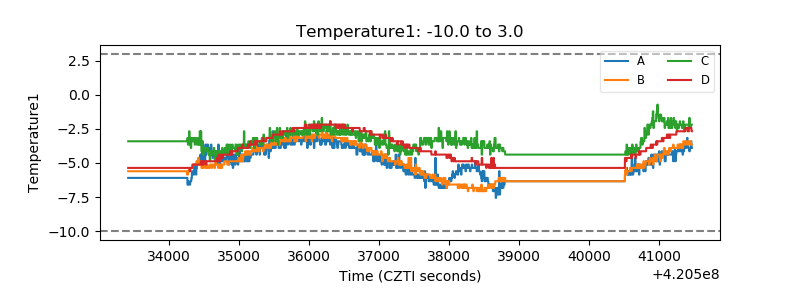 |
| Veto HV Monitor | 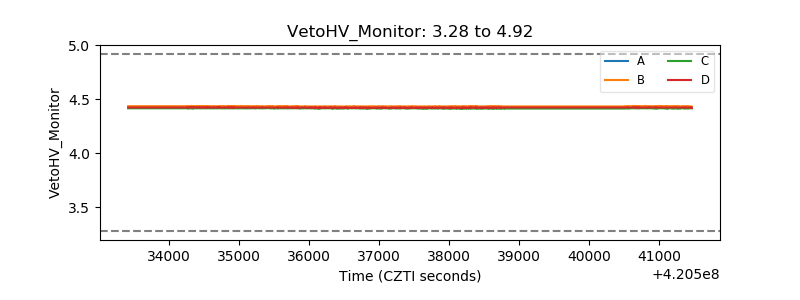 |
| Veto LLD | 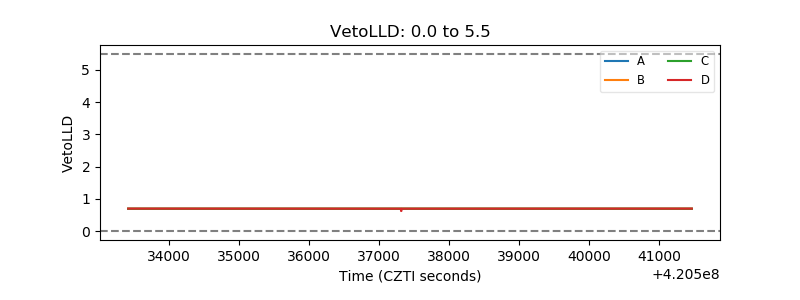 |
| Alpha Counter | 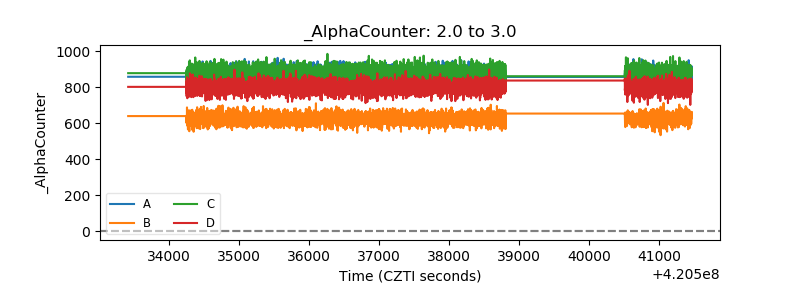 |
| _CPM_Rate | 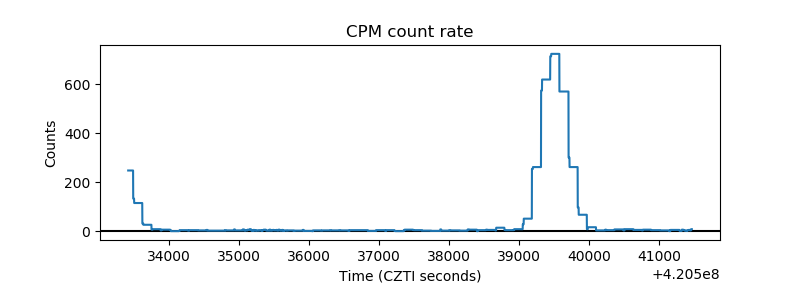 |
| CZT Counter | 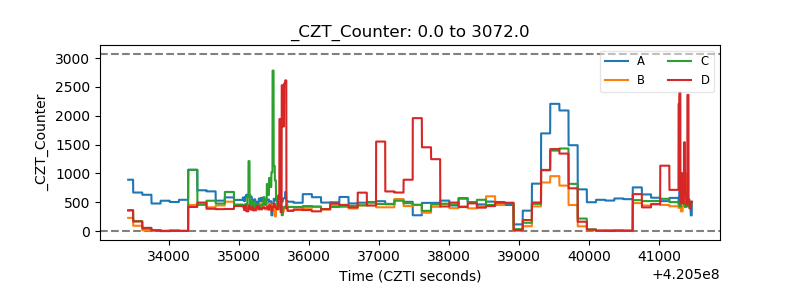 |
| +2.5 Volts monitor | 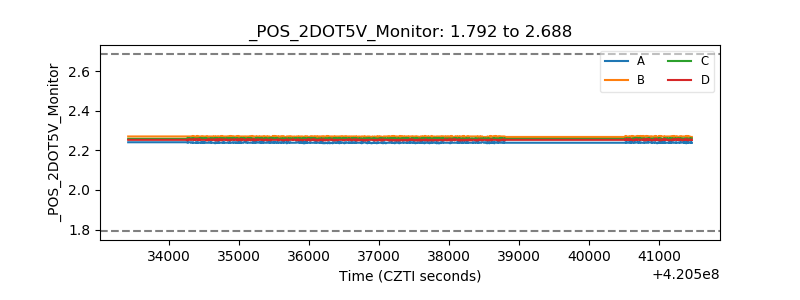 |
| +5 Volts monitor | 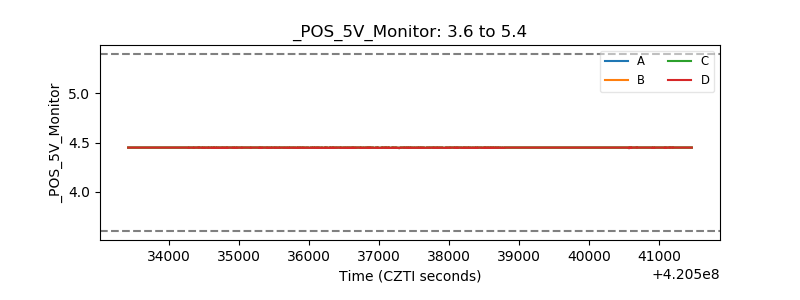 |
| _ROLL_ROT | 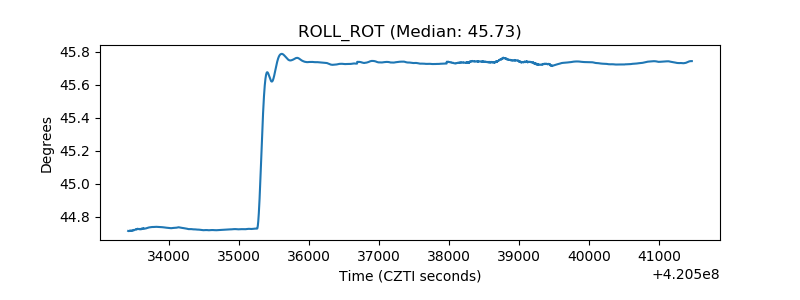 |
| _Roll_DEC | 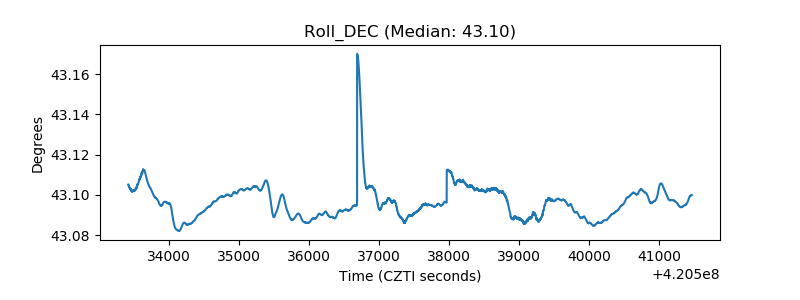 |
| _Roll_RA | 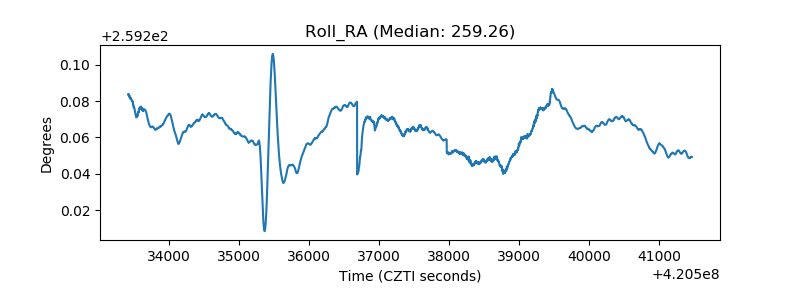 |
| Veto Counter | 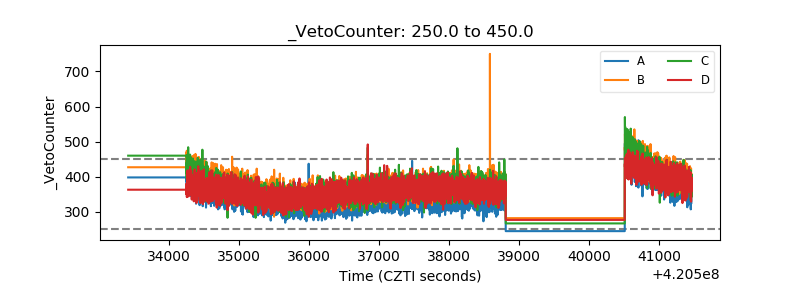 |