| Param | Original file | Final file |
|---|---|---|
| Filename | modeM0/AS1A12_029T02_9000005590_41023cztM0_level2.fits | modeM0/AS1A12_029T02_9000005590_41023cztM0_level2_quad_clean.evt |
| Size (bytes) | 324,878,400 | 92,718,720 |
| Size | 309.8 MB | 88.4 MB |
| Events in quadrant A | 3,015,341 | 630,348 |
| Events in quadrant B | 2,481,954 | 649,337 |
| Events in quadrant C | 2,718,552 | 610,063 |
| Events in quadrant D | 3,388,590 | 539,445 |
| Mode SS | |||
|---|---|---|---|
| Quadrant | BADHDUFLAG | Total packets | Discarded packets |
| A | 0 | 110 | 0 |
| B | 0 | 110 | 0 |
| C | 0 | 110 | 0 |
| D | 0 | 110 | 0 |
| Mode M0 | |||
|---|---|---|---|
| Quadrant | BADHDUFLAG | Total packets | Discarded packets |
| A | 0 | 12230 | 3 |
| B | 0 | 10876 | 2 |
| C | 0 | 11213 | 2 |
| D | 0 | 13839 | 2 |
| Mode M9 | |||
|---|---|---|---|
| Quadrant | BADHDUFLAG | Total packets | Discarded packets |
| A | 0 | 24 | 0 |
| B | 0 | 24 | 0 |
| C | 0 | 24 | 0 |
| D | 0 | 25 | 0 |
| Quadrant | Total seconds | Saturated seconds | Saturation percentage |
|---|---|---|---|
| A | 5405 | 11 | 0.203515% |
| B | 5405 | 4 | 0.074006% |
| C | 5405 | 17 | 0.314524% |
| D | 5405 | 313 | 5.790934% |
Noise dominated data is calculated using 1-second bins in cleaned event files. If a bin has >2000 counts, and if more than 50% of those come from <1% of pixels, then it is considered to be noise-dominated and hence unusable.
| Quadrant | # 1 sec bins | Bins with >0 counts | Bins with >2000 counts | High rate bins dominated by noise | Noise dominated (total time) | Noise dominated (detector-on time) | Marked lightcurve |
|---|---|---|---|---|---|---|---|
| A | 7258 | 5406 | 2 | 2 | 0.03% | 0.04% | 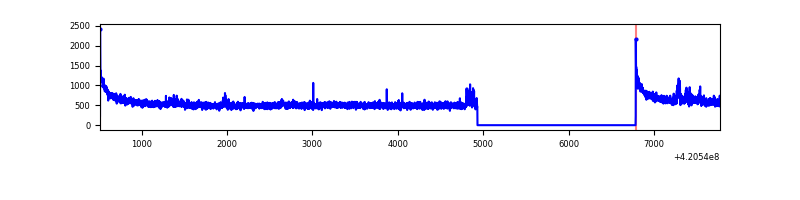 |
| B | 7258 | 5406 | 0 | 0 | 0.00% | 0.00% | 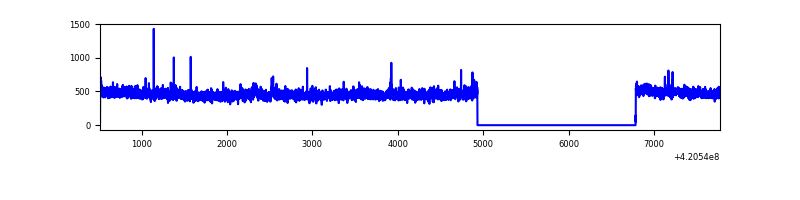 |
| C | 7258 | 5406 | 12 | 12 | 0.17% | 0.22% | 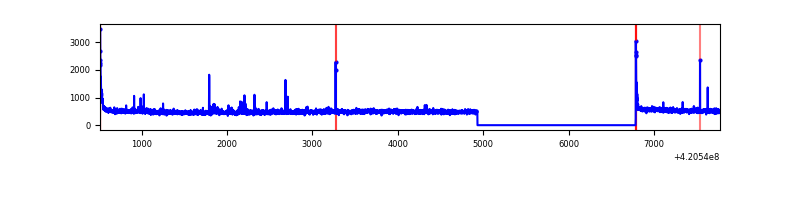 |
| D | 7258 | 5406 | 245 | 245 | 3.38% | 4.53% | 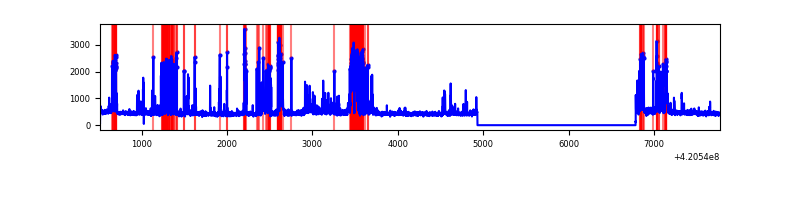 |
Top three noisy pixels from each quadrant. If the there are fewer than three noisy pixels in the level2.evt file, extra rows are filled as -1
| Pixel properties | Quadrant properties | ||||||
|---|---|---|---|---|---|---|---|
| Quadrant | DetID | PixID | Counts | Sigma | Mean | Median | Sigma |
| A | 10 | 83 | 498920 | 3903.77 | 625 | 613 | 127.6 |
| A | 12 | 189 | 97077 | 755.7 | 625 | 613 | 127.6 |
| A | 13 | 254 | 8395 | 60.96 | 625 | 613 | 127.6 |
| B | 0 | 229 | 28001 | 231.08 | 618 | 601 | 118.6 |
| B | 0 | 190 | 25323 | 208.49 | 618 | 601 | 118.6 |
| B | 12 | 111 | 15292 | 123.9 | 618 | 601 | 118.6 |
| C | 15 | 214 | 233542 | 1657.47 | 604 | 606 | 140.5 |
| C | 0 | 10 | 55946 | 393.78 | 604 | 606 | 140.5 |
| C | 12 | 249 | 28208 | 196.4 | 604 | 606 | 140.5 |
| D | 13 | 249 | 907568 | 6393.75 | 591 | 576 | 141.9 |
| D | 9 | 19 | 133865 | 939.61 | 591 | 576 | 141.9 |
| D | 2 | 234 | 24888 | 171.38 | 591 | 576 | 141.9 |
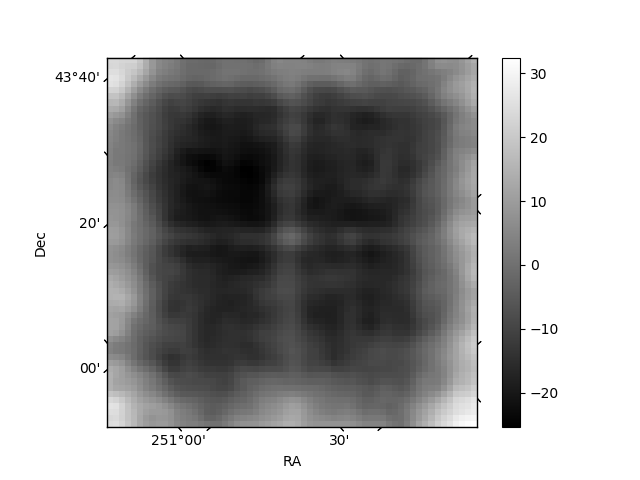
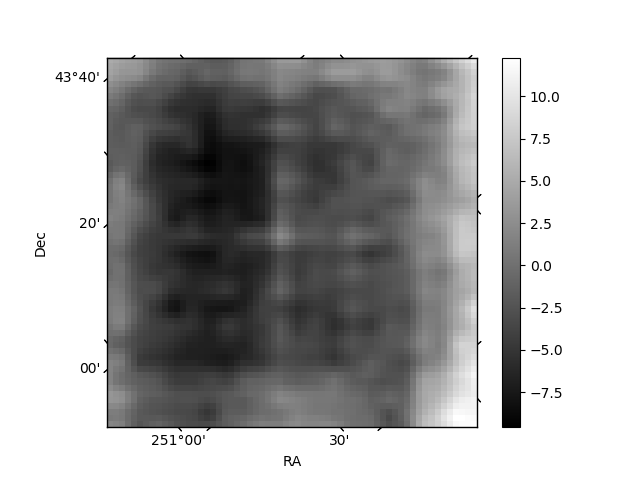
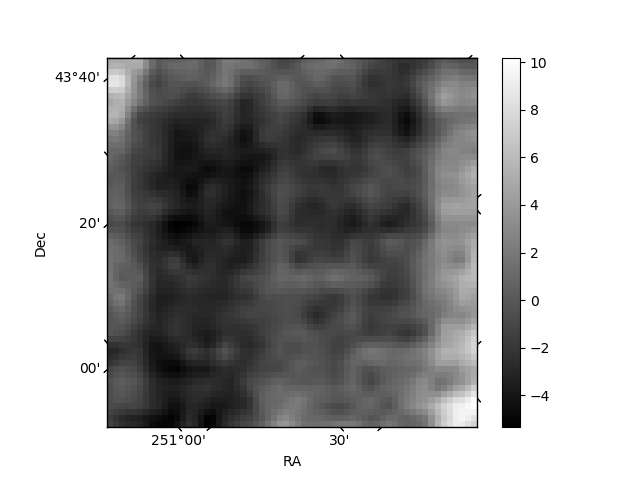
Histogram calculated using DETX and DETY for each event in the final _common_clean file
| Quadrant A | 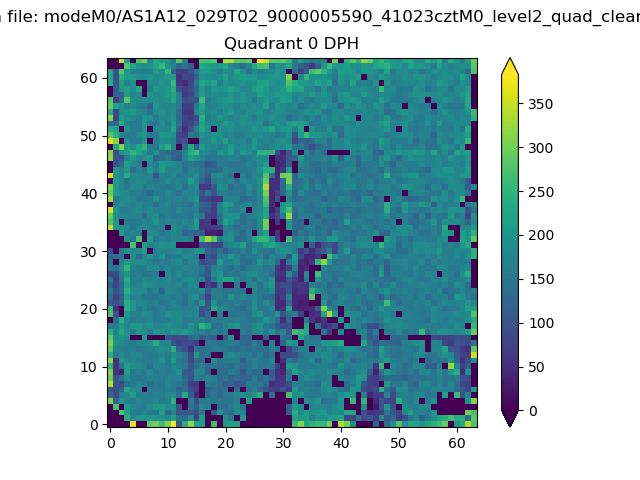 |
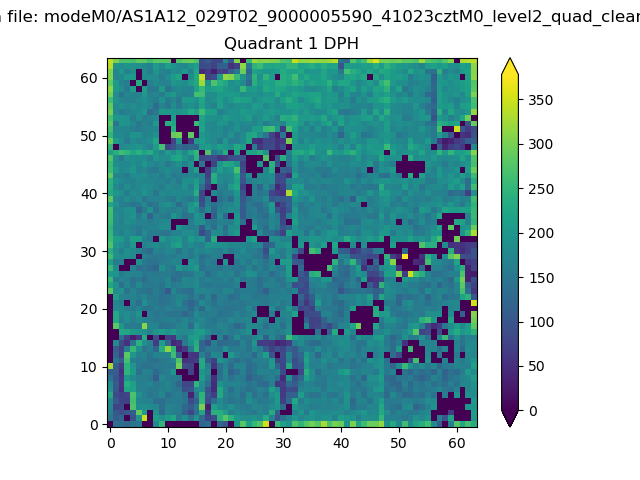 |
Quadrant B |
|---|---|---|---|
| Quadrant D | 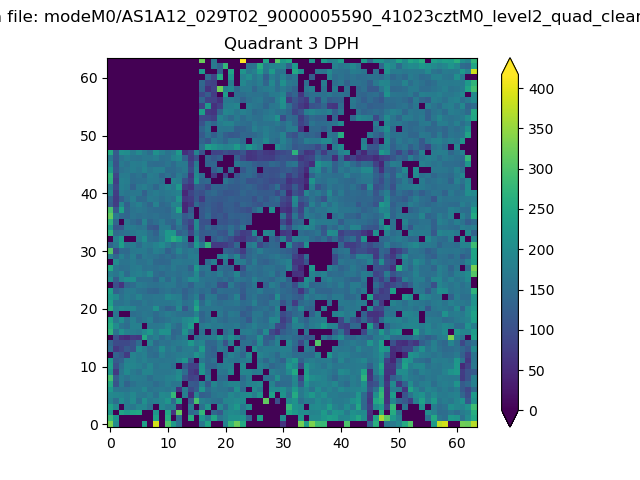 |
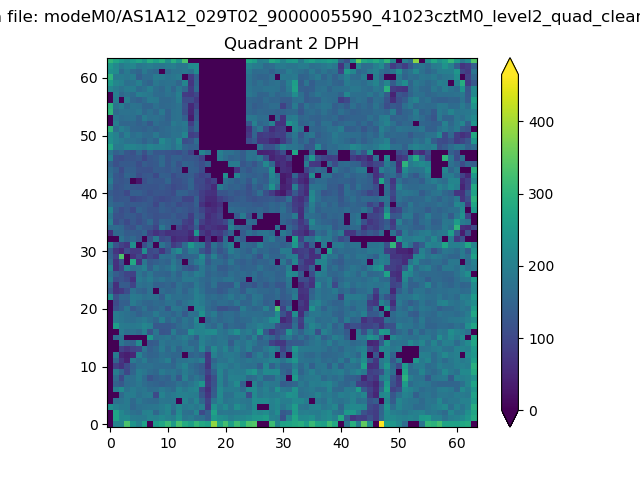 |
Quadrant C |
| Plot type | Count rate plots | Images |
|---|---|---|
| Comparison with Poisson distribution Blue bars denote a histogram of data divided into 1 sec bins. Red curve is a Poisson curve with rate = median count rate of data. |
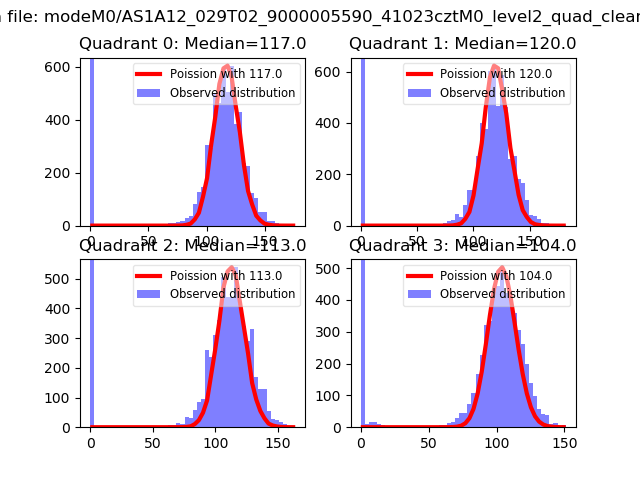 |
 |
| Quadrant-wise count rates Data is divided into 100 sec bins |
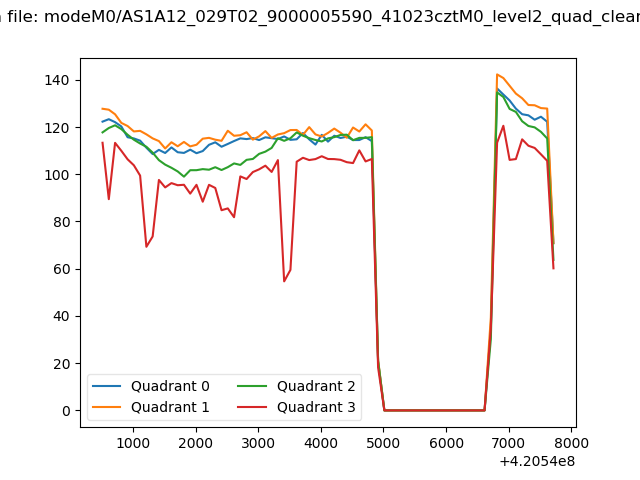 |
|
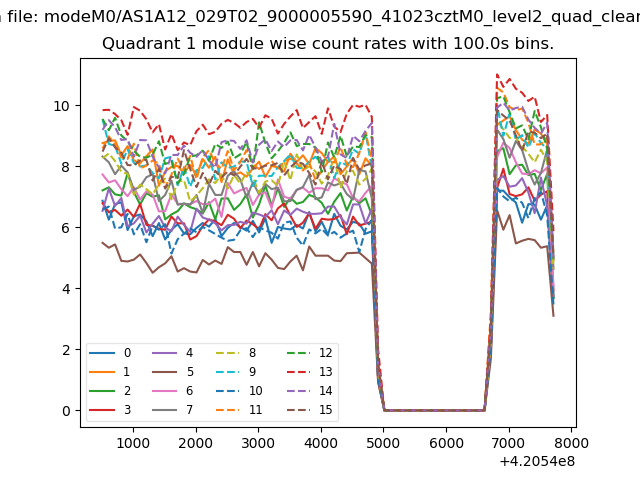
| Module-wise count rates for Quadrant A Data is divided into 100 sec bins |
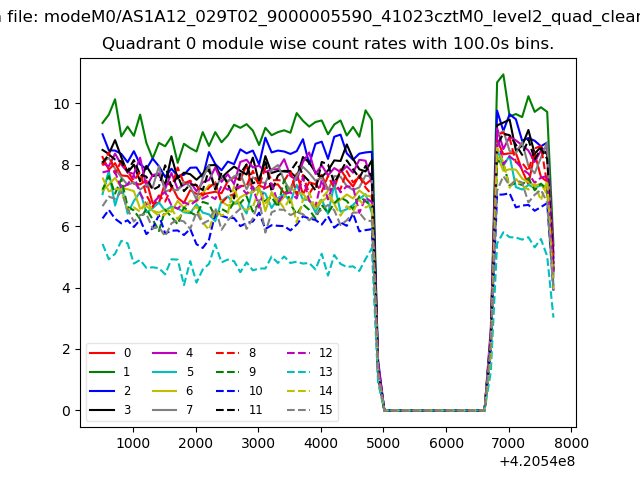 |
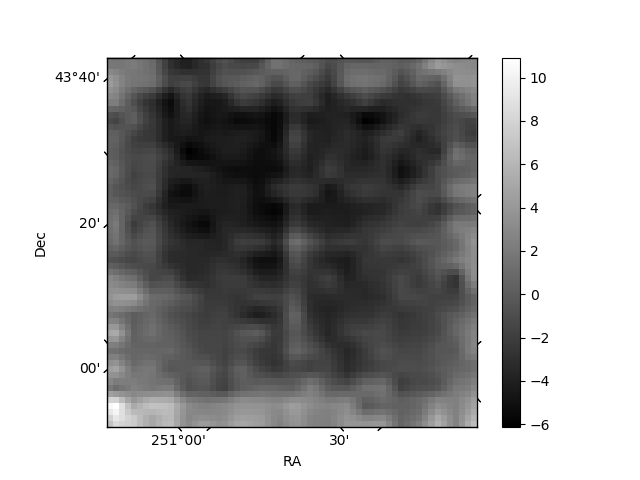 |
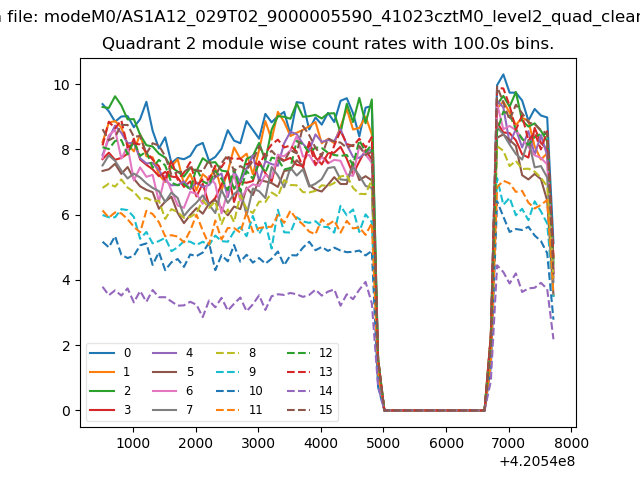
| Module-wise count rates for Quadrant B Data is divided into 100 sec bins |
 |
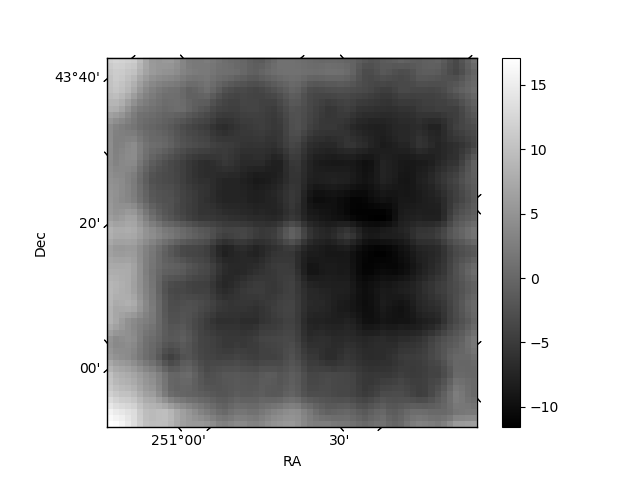 |
| Module-wise count rates for Quadrant C Data is divided into 100 sec bins |
 |
 |
| Module-wise count rates for Quadrant D Data is divided into 100 sec bins |
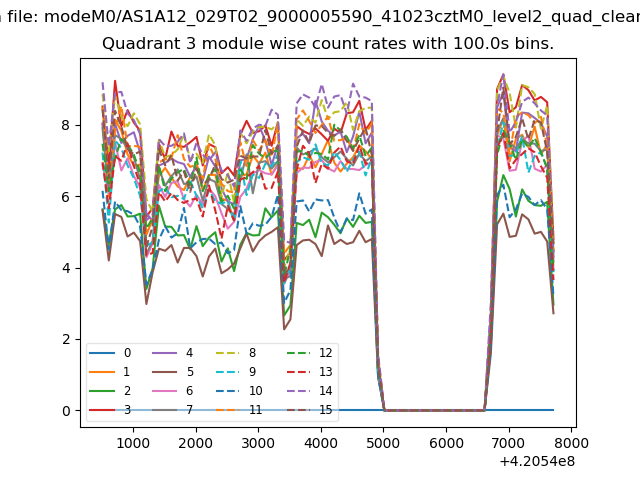 |
 |
| Parameter | Plot |
|---|---|
| CZT HV Monitor | 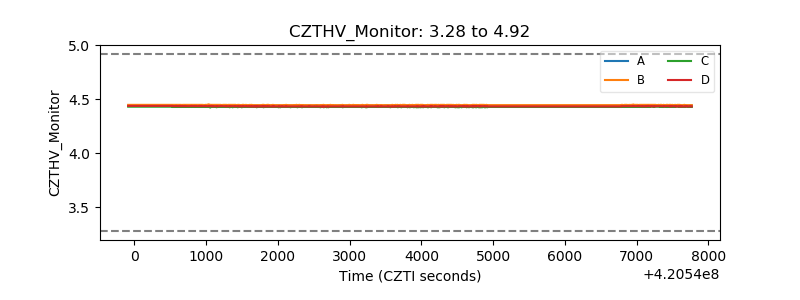 |
| D_VDD | 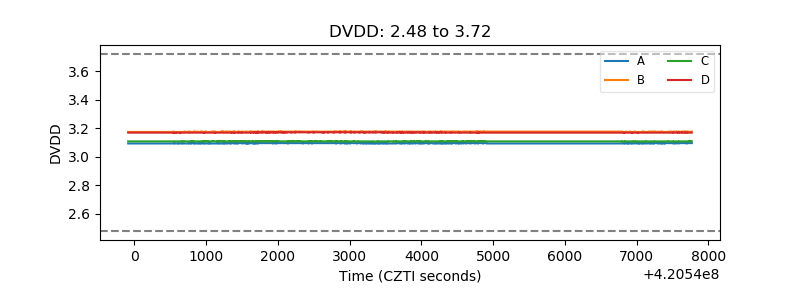 |
| Temperature 1 | 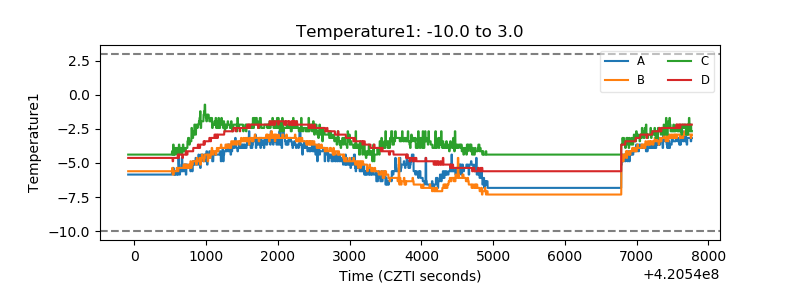 |
| Veto HV Monitor |  |
| Veto LLD | 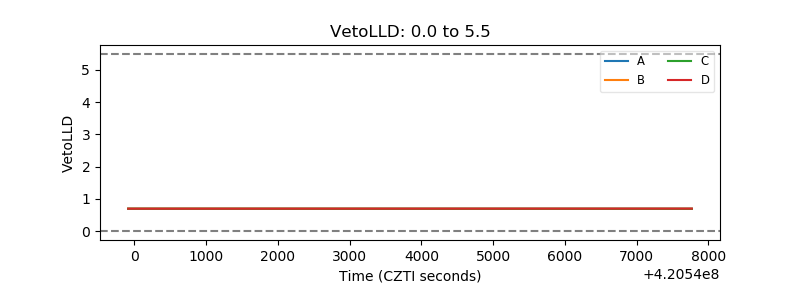 |
| Alpha Counter | 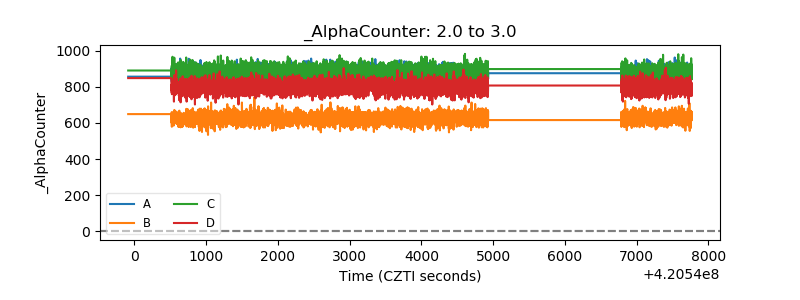 |
| _CPM_Rate |  |
| CZT Counter | 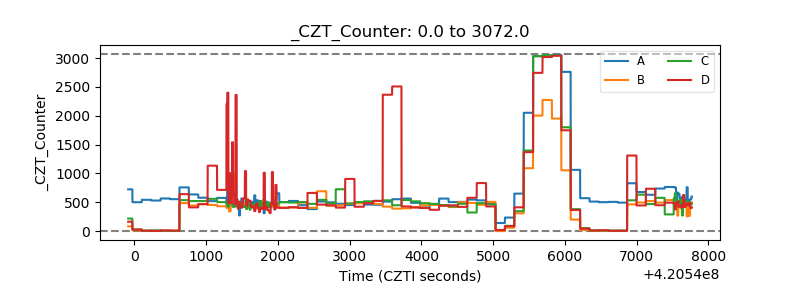 |
| +2.5 Volts monitor | 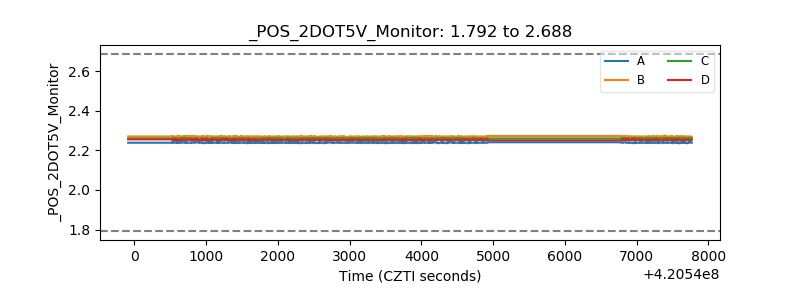 |
| +5 Volts monitor | 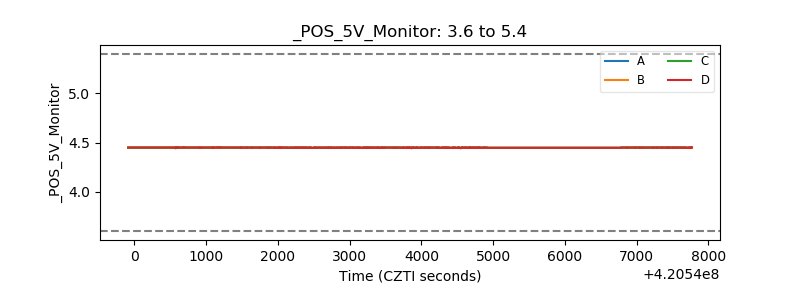 |
| _ROLL_ROT | 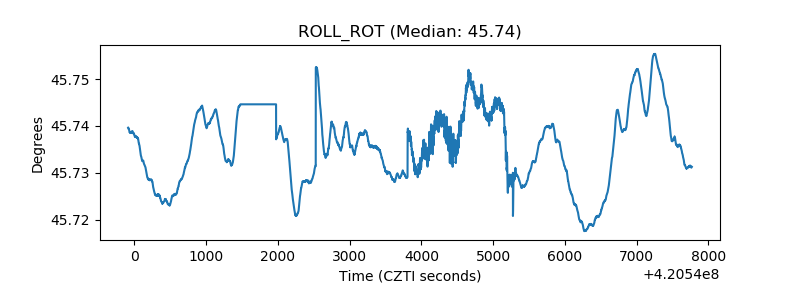 |
| _Roll_DEC | 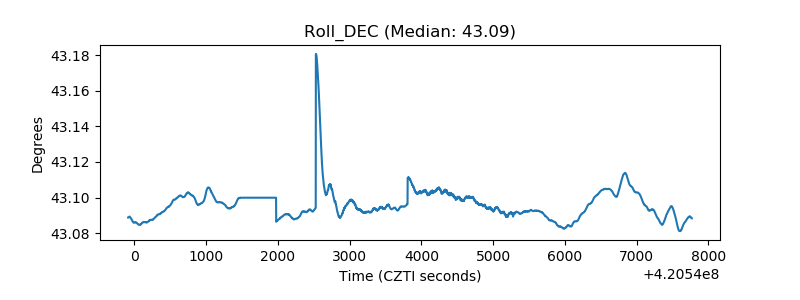 |
| _Roll_RA | 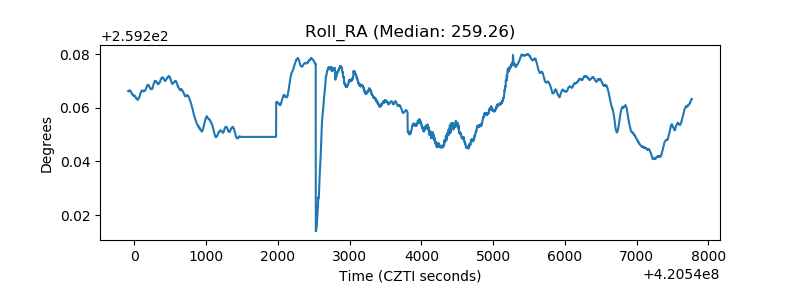 |
| Veto Counter | 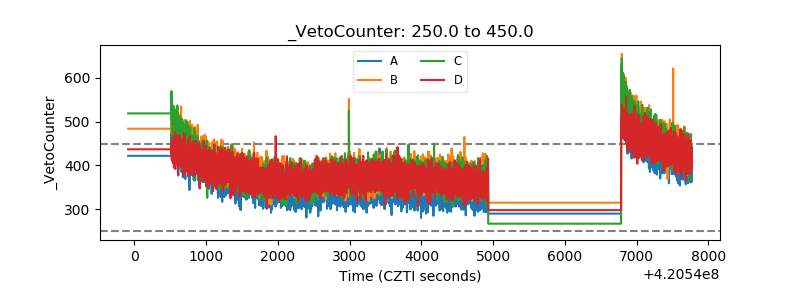 |