| Param | Original file | Final file |
|---|---|---|
| Filename | modeM0/AS1A12_029T02_9000005590_41025cztM0_level2.fits | modeM0/AS1A12_029T02_9000005590_41025cztM0_level2_quad_clean.evt |
| Size (bytes) | 317,534,400 | 95,843,520 |
| Size | 302.8 MB | 91.4 MB |
| Events in quadrant A | 2,971,024 | 660,284 |
| Events in quadrant B | 2,590,004 | 674,926 |
| Events in quadrant C | 2,885,471 | 628,122 |
| Events in quadrant D | 2,904,888 | 577,042 |
| Mode SS | |||
|---|---|---|---|
| Quadrant | BADHDUFLAG | Total packets | Discarded packets |
| A | 0 | 106 | 0 |
| B | 0 | 106 | 0 |
| C | 0 | 106 | 0 |
| D | 0 | 106 | 0 |
| Mode M0 | |||
|---|---|---|---|
| Quadrant | BADHDUFLAG | Total packets | Discarded packets |
| A | 0 | 12002 | 3 |
| B | 0 | 10867 | 2 |
| C | 0 | 11496 | 2 |
| D | 0 | 11967 | 2 |
| Mode M9 | |||
|---|---|---|---|
| Quadrant | BADHDUFLAG | Total packets | Discarded packets |
| A | 0 | 29 | 0 |
| B | 0 | 29 | 0 |
| C | 0 | 29 | 0 |
| D | 0 | 30 | 0 |
| Quadrant | Total seconds | Saturated seconds | Saturation percentage |
|---|---|---|---|
| A | 5167 | 13 | 0.251597% |
| B | 5167 | 8 | 0.154829% |
| C | 5167 | 56 | 1.083801% |
| D | 5167 | 110 | 2.128895% |
Noise dominated data is calculated using 1-second bins in cleaned event files. If a bin has >2000 counts, and if more than 50% of those come from <1% of pixels, then it is considered to be noise-dominated and hence unusable.
| Quadrant | # 1 sec bins | Bins with >0 counts | Bins with >2000 counts | High rate bins dominated by noise | Noise dominated (total time) | Noise dominated (detector-on time) | Marked lightcurve |
|---|---|---|---|---|---|---|---|
| A | 7229 | 5168 | 3 | 3 | 0.04% | 0.06% | 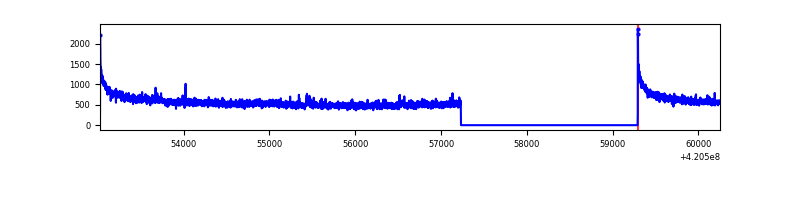 |
| B | 7229 | 5168 | 5 | 5 | 0.07% | 0.10% | 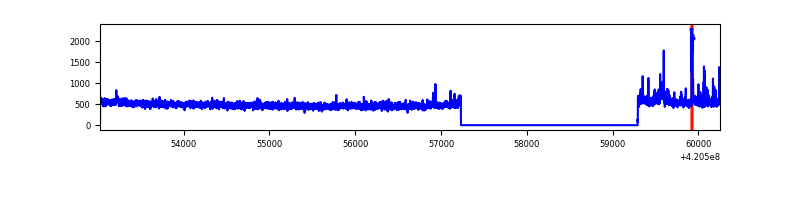 |
| C | 7229 | 5168 | 51 | 51 | 0.71% | 0.99% | 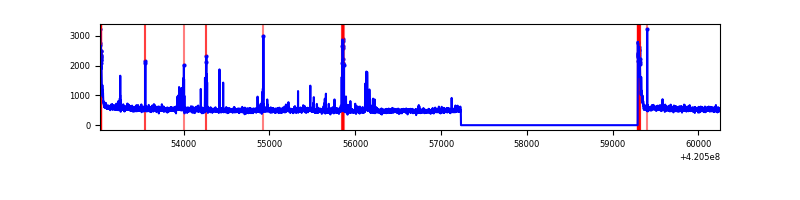 |
| D | 7229 | 5168 | 72 | 72 | 1.00% | 1.39% | 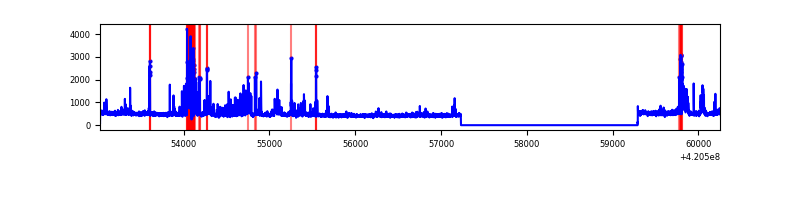 |
Top three noisy pixels from each quadrant. If the there are fewer than three noisy pixels in the level2.evt file, extra rows are filled as -1
| Pixel properties | Quadrant properties | ||||||
|---|---|---|---|---|---|---|---|
| Quadrant | DetID | PixID | Counts | Sigma | Mean | Median | Sigma |
| A | 10 | 83 | 496682 | 3948.93 | 624 | 612 | 125.6 |
| A | 12 | 189 | 55982 | 440.77 | 624 | 612 | 125.6 |
| A | 13 | 254 | 8698 | 64.37 | 624 | 612 | 125.6 |
| B | 0 | 190 | 133027 | 1118.28 | 619 | 602 | 118.4 |
| B | 5 | 172 | 18479 | 150.96 | 619 | 602 | 118.4 |
| B | 12 | 111 | 14598 | 118.19 | 619 | 602 | 118.4 |
| C | 15 | 214 | 221907 | 1565.72 | 609 | 611 | 141.3 |
| C | 0 | 10 | 118429 | 833.59 | 609 | 611 | 141.3 |
| C | 12 | 249 | 92950 | 653.32 | 609 | 611 | 141.3 |
| D | 13 | 249 | 348839 | 2362.94 | 602 | 584 | 147.4 |
| D | 2 | 249 | 129601 | 875.39 | 602 | 584 | 147.4 |
| D | 9 | 19 | 47224 | 316.46 | 602 | 584 | 147.4 |
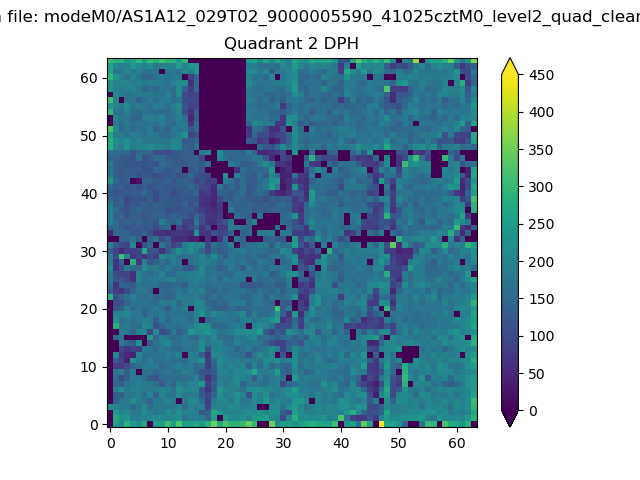
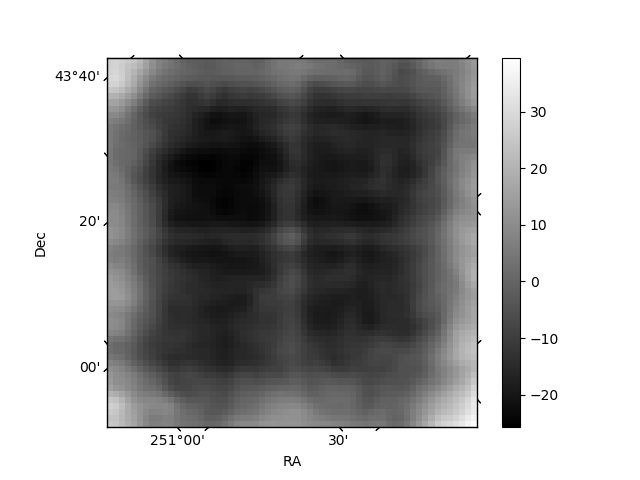
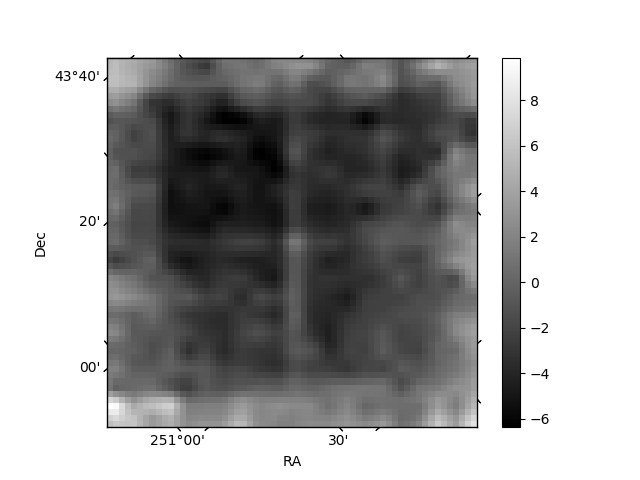
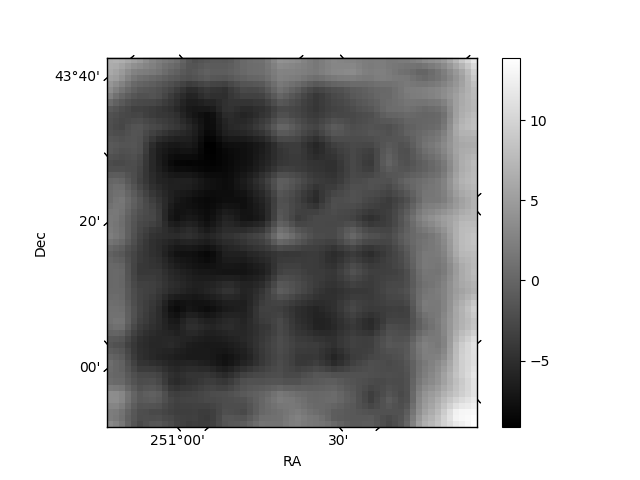
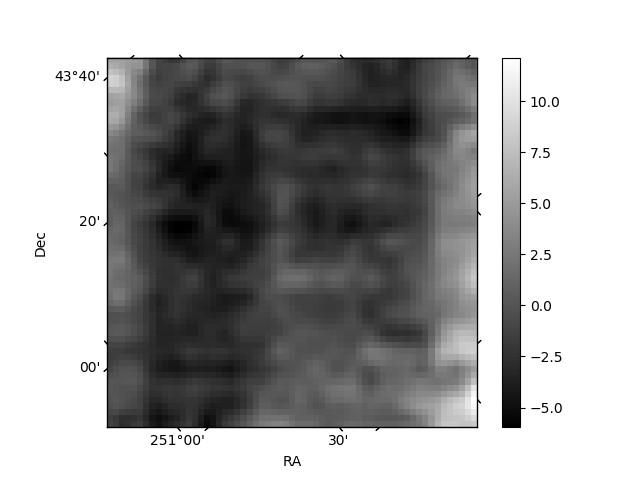
Histogram calculated using DETX and DETY for each event in the final _common_clean file
| Quadrant A | 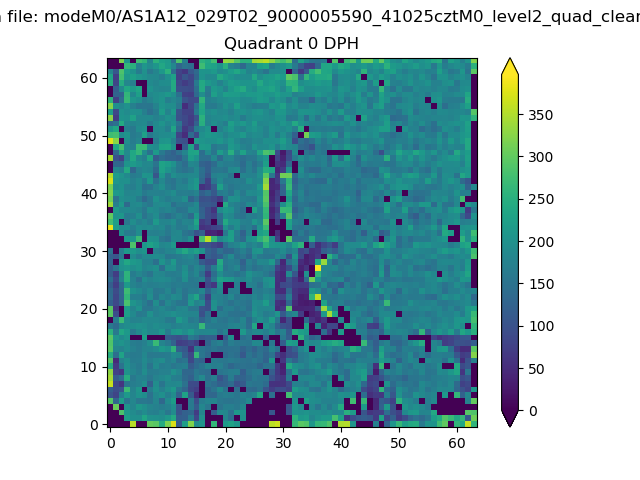 |
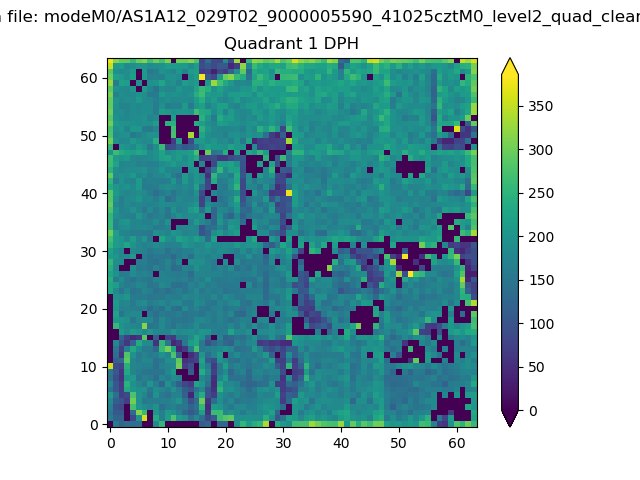 |
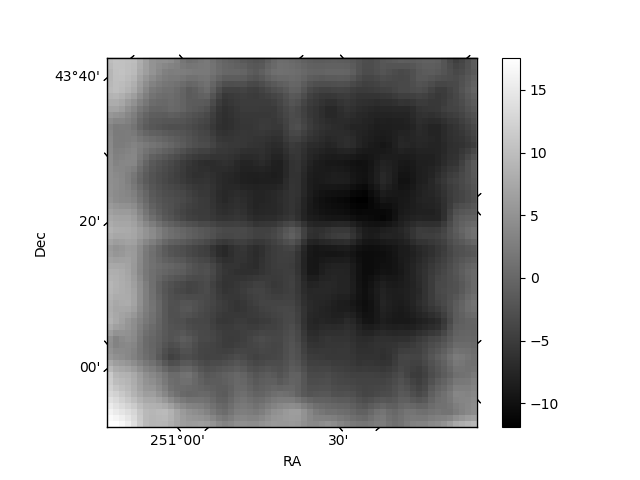
Quadrant B |
|---|---|---|---|
| Quadrant D | 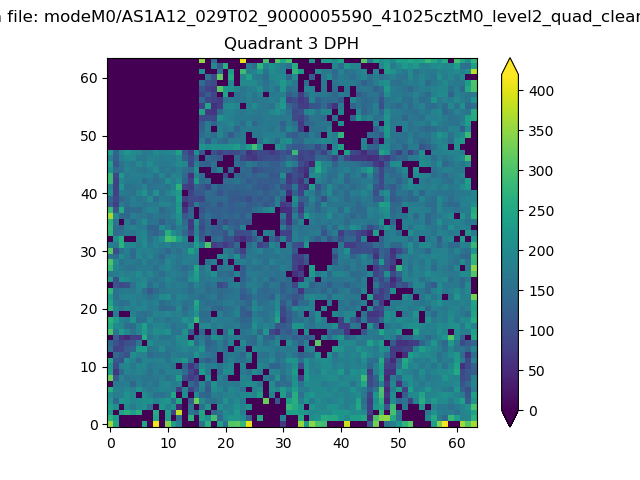 |
 |
Quadrant C |
| Plot type | Count rate plots | Images |
|---|---|---|
| Comparison with Poisson distribution Blue bars denote a histogram of data divided into 1 sec bins. Red curve is a Poisson curve with rate = median count rate of data. |
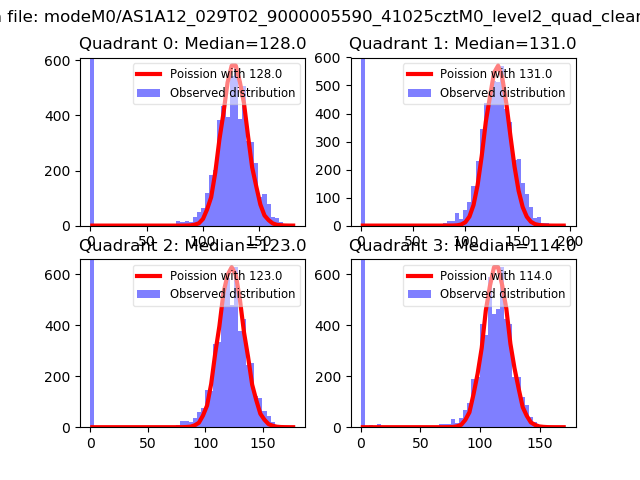 |
 |
| Quadrant-wise count rates Data is divided into 100 sec bins |
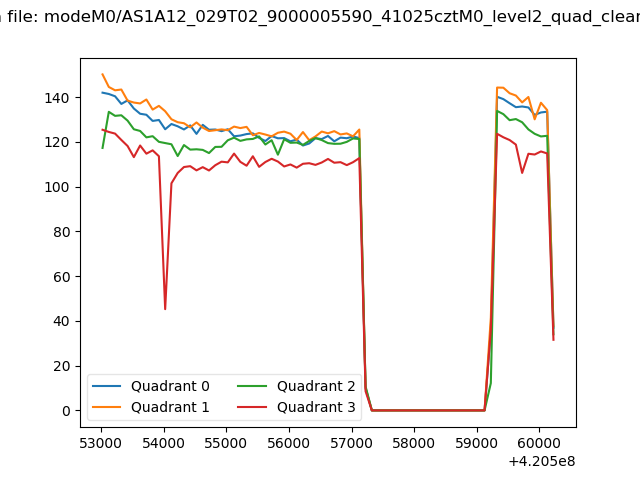 |
|
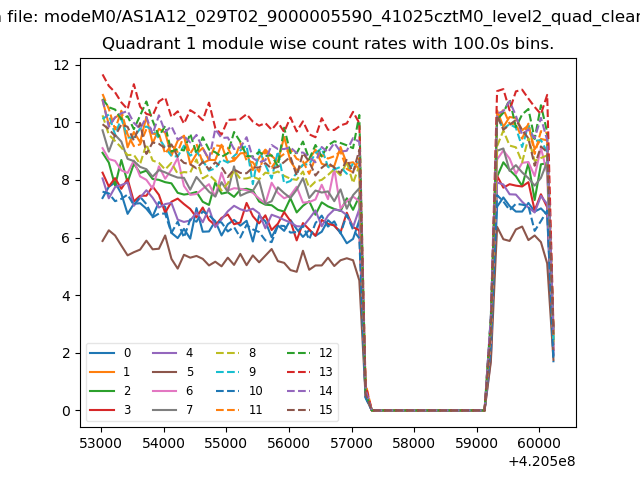
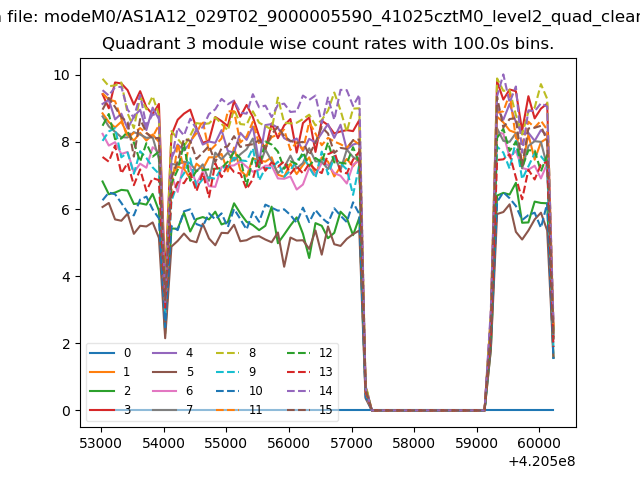
| Module-wise count rates for Quadrant A Data is divided into 100 sec bins |
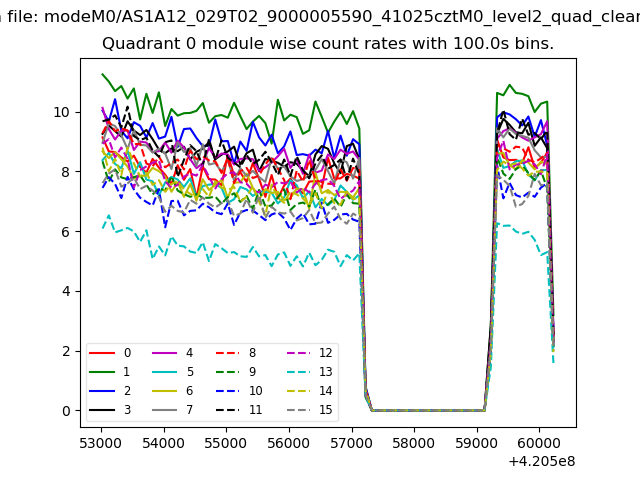 |
 |
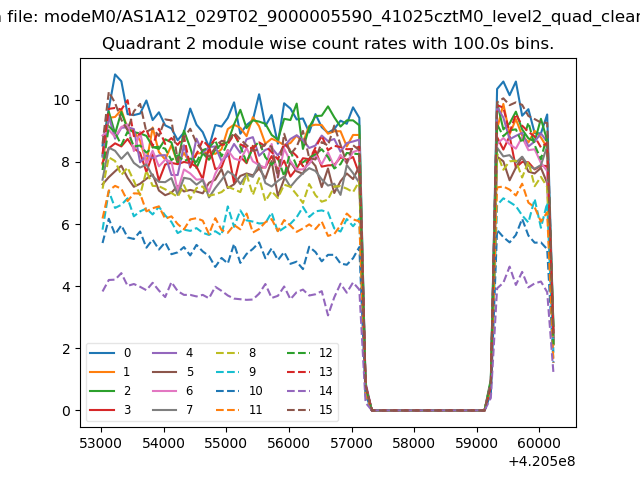
| Module-wise count rates for Quadrant B Data is divided into 100 sec bins |
 |
 |
| Module-wise count rates for Quadrant C Data is divided into 100 sec bins |
 |
 |
| Module-wise count rates for Quadrant D Data is divided into 100 sec bins |
 |
 |
| Parameter | Plot |
|---|---|
| CZT HV Monitor | 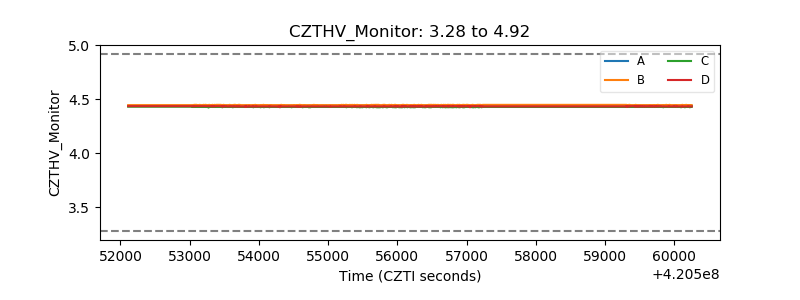 |
| D_VDD | 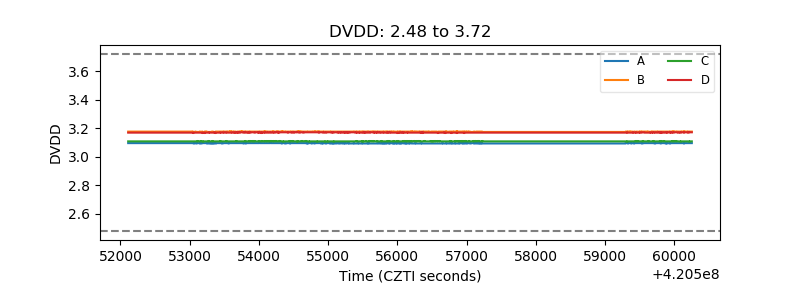 |
| Temperature 1 | 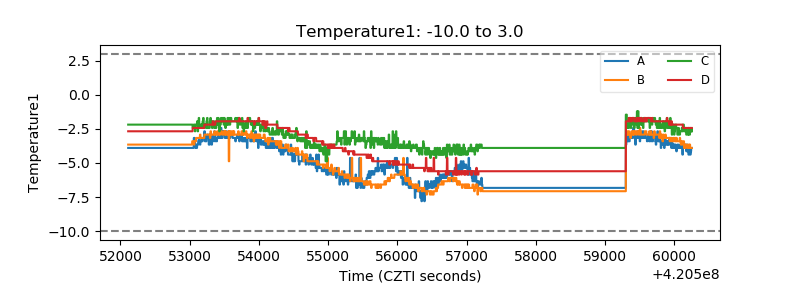 |
| Veto HV Monitor | 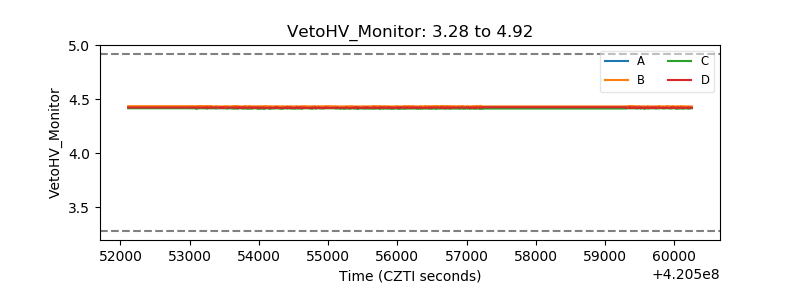 |
| Veto LLD | 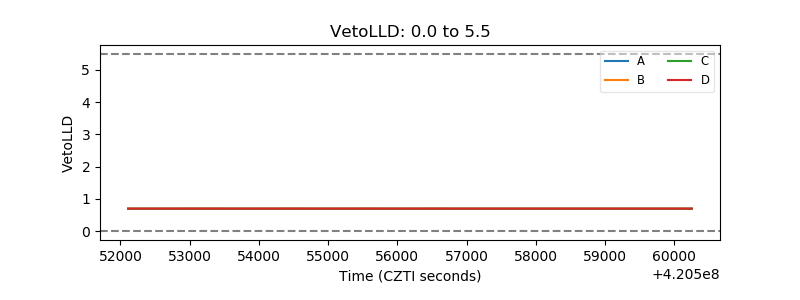 |
| Alpha Counter | 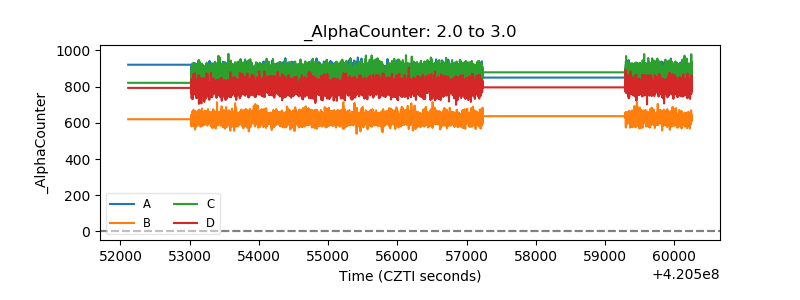 |
| _CPM_Rate | 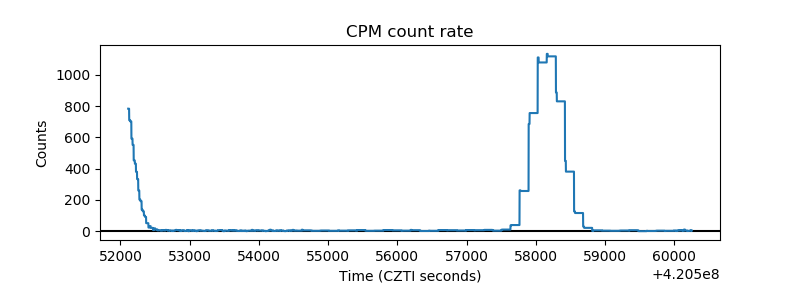 |
| CZT Counter | 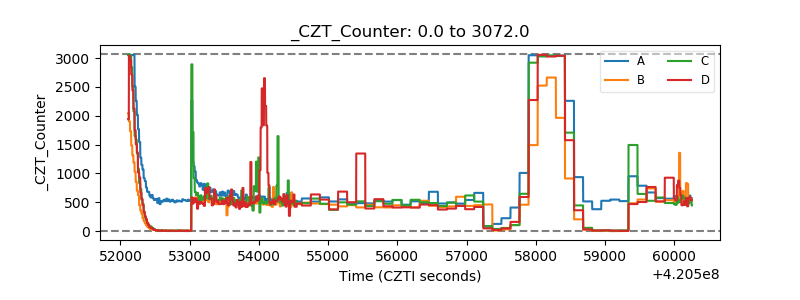 |
| +2.5 Volts monitor |  |
| +5 Volts monitor | 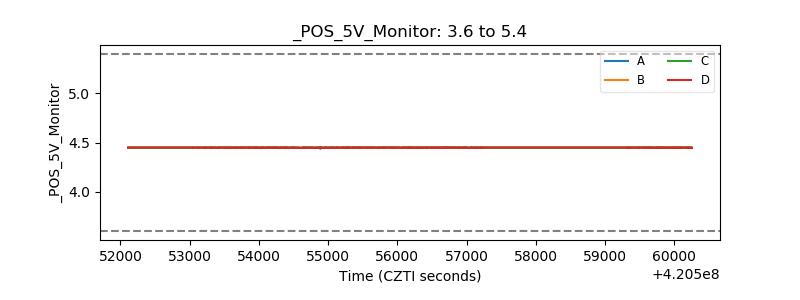 |
| _ROLL_ROT | 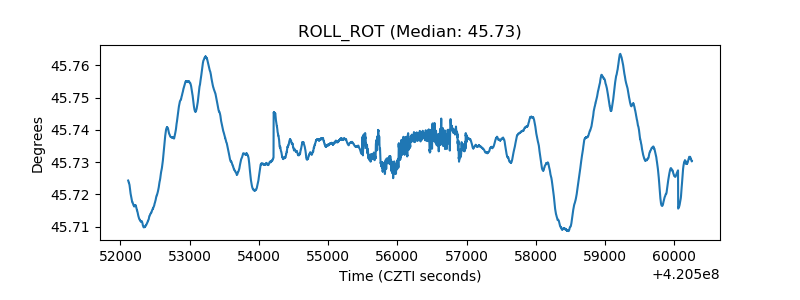 |
| _Roll_DEC | 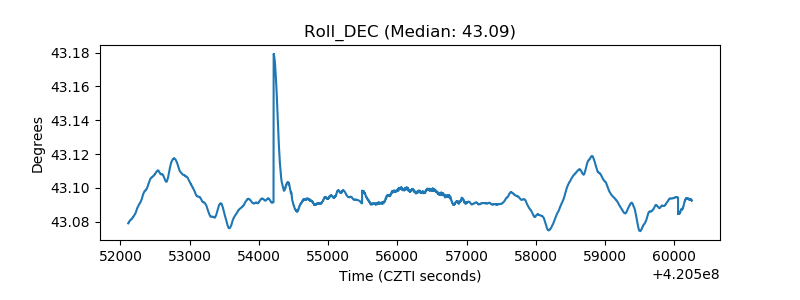 |
| _Roll_RA | 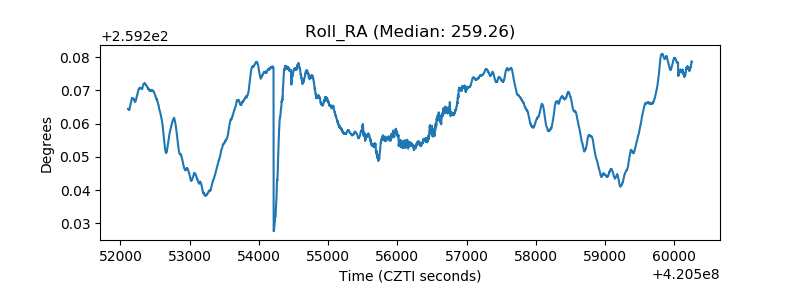 |
| Veto Counter | 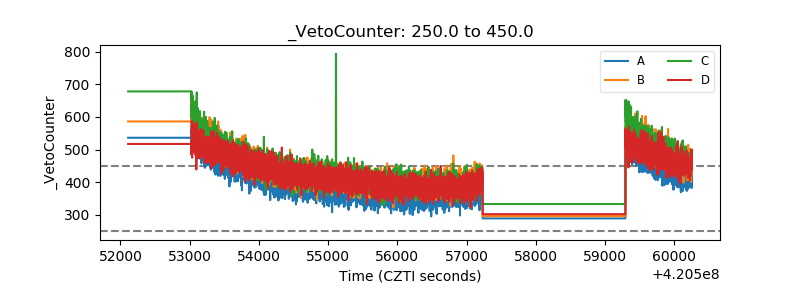 |