| Param | Original file | Final file |
|---|---|---|
| Filename | modeM0/AS1A12_029T02_9000005590_41026cztM0_level2.fits | modeM0/AS1A12_029T02_9000005590_41026cztM0_level2_quad_clean.evt |
| Size (bytes) | 334,272,960 | 90,714,240 |
| Size | 318.8 MB | 86.5 MB |
| Events in quadrant A | 2,841,446 | 624,215 |
| Events in quadrant B | 2,926,112 | 636,014 |
| Events in quadrant C | 3,015,033 | 592,971 |
| Events in quadrant D | 3,202,362 | 543,863 |
| Mode SS | |||
|---|---|---|---|
| Quadrant | BADHDUFLAG | Total packets | Discarded packets |
| A | 0 | 102 | 0 |
| B | 0 | 102 | 0 |
| C | 0 | 102 | 0 |
| D | 0 | 102 | 0 |
| Mode M0 | |||
|---|---|---|---|
| Quadrant | BADHDUFLAG | Total packets | Discarded packets |
| A | 0 | 11555 | 3 |
| B | 0 | 11923 | 2 |
| C | 0 | 11859 | 2 |
| D | 0 | 12871 | 2 |
| Mode M9 | |||
|---|---|---|---|
| Quadrant | BADHDUFLAG | Total packets | Discarded packets |
| A | 0 | 36 | 0 |
| B | 0 | 36 | 0 |
| C | 0 | 36 | 0 |
| D | 0 | 37 | 0 |
| Quadrant | Total seconds | Saturated seconds | Saturation percentage |
|---|---|---|---|
| A | 4991 | 18 | 0.360649% |
| B | 4991 | 76 | 1.522741% |
| C | 4991 | 140 | 2.805049% |
| D | 4991 | 199 | 3.987177% |
Noise dominated data is calculated using 1-second bins in cleaned event files. If a bin has >2000 counts, and if more than 50% of those come from <1% of pixels, then it is considered to be noise-dominated and hence unusable.
| Quadrant | # 1 sec bins | Bins with >0 counts | Bins with >2000 counts | High rate bins dominated by noise | Noise dominated (total time) | Noise dominated (detector-on time) | Marked lightcurve |
|---|---|---|---|---|---|---|---|
| A | 7114 | 4992 | 5 | 5 | 0.07% | 0.10% | 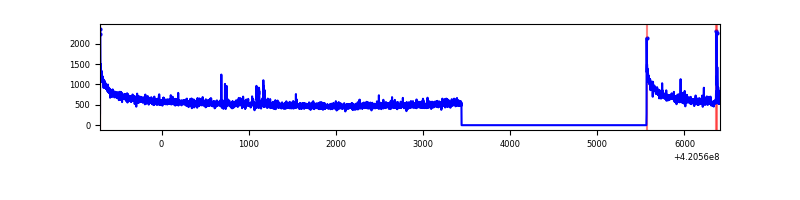 |
| B | 7114 | 4992 | 41 | 41 | 0.58% | 0.82% | 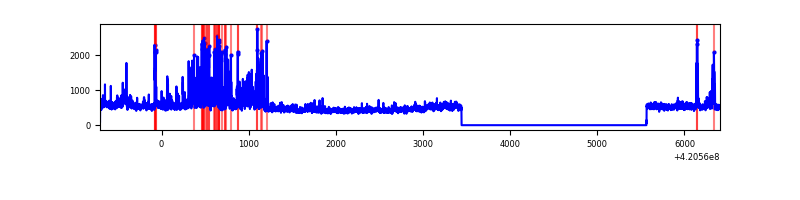 |
| C | 7114 | 4992 | 119 | 119 | 1.67% | 2.38% | 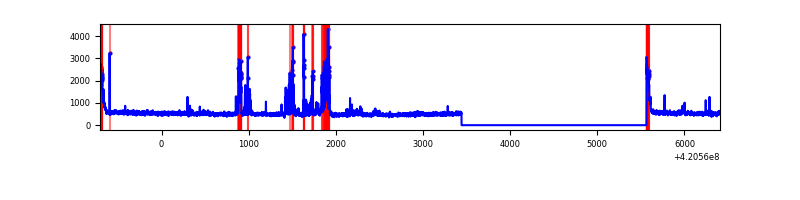 |
| D | 7114 | 4992 | 173 | 173 | 2.43% | 3.47% | 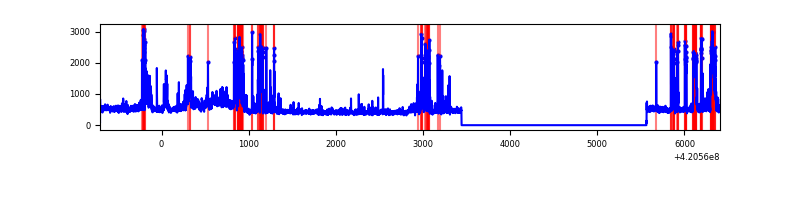 |
Top three noisy pixels from each quadrant. If the there are fewer than three noisy pixels in the level2.evt file, extra rows are filled as -1
| Pixel properties | Quadrant properties | ||||||
|---|---|---|---|---|---|---|---|
| Quadrant | DetID | PixID | Counts | Sigma | Mean | Median | Sigma |
| A | 10 | 83 | 486567 | 4048.64 | 591 | 581 | 120.0 |
| A | 12 | 189 | 32171 | 263.17 | 591 | 581 | 120.0 |
| A | 13 | 248 | 28912 | 236.02 | 591 | 581 | 120.0 |
| B | 0 | 190 | 529125 | 4734.21 | 585 | 569 | 111.6 |
| B | 15 | 32 | 47935 | 424.25 | 585 | 569 | 111.6 |
| B | 0 | 229 | 30457 | 267.7 | 585 | 569 | 111.6 |
| C | 14 | 254 | 369785 | 2781.37 | 575 | 581 | 132.7 |
| C | 15 | 214 | 214418 | 1610.92 | 575 | 581 | 132.7 |
| C | 0 | 10 | 138320 | 1037.65 | 575 | 581 | 132.7 |
| D | 13 | 249 | 665999 | 4836.64 | 569 | 555 | 137.6 |
| D | 2 | 249 | 114872 | 830.89 | 569 | 555 | 137.6 |
| D | 9 | 19 | 85850 | 619.95 | 569 | 555 | 137.6 |
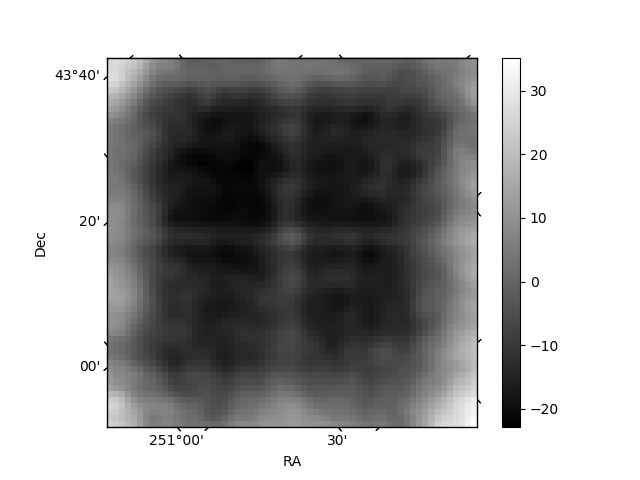
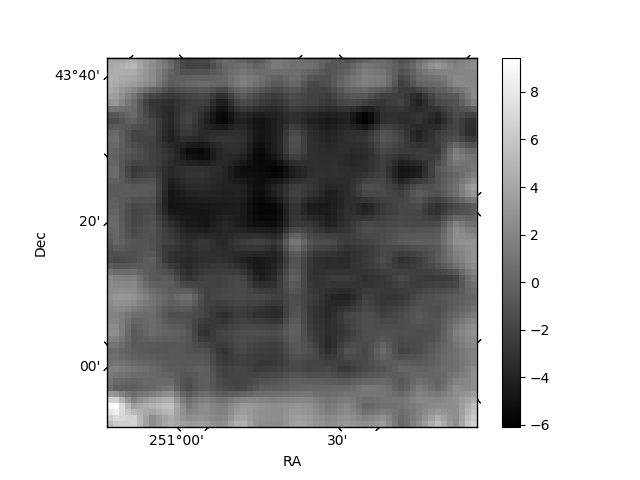
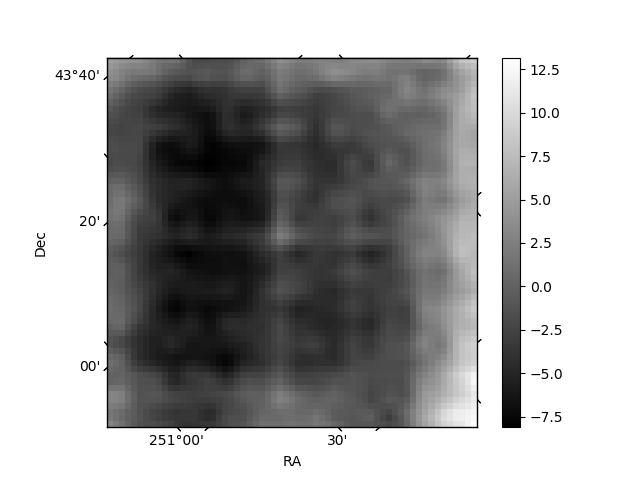
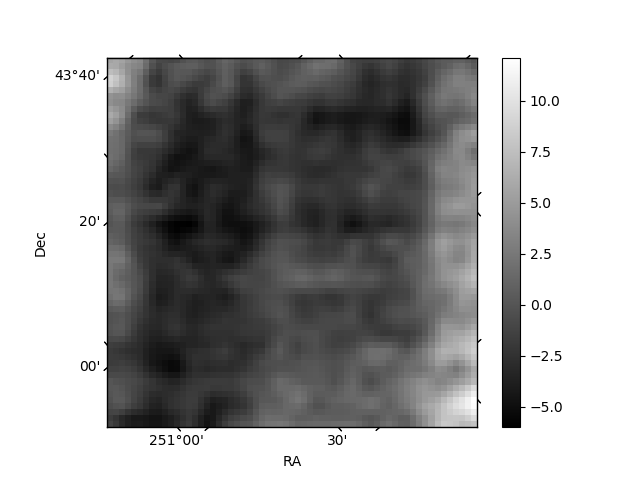
Histogram calculated using DETX and DETY for each event in the final _common_clean file
| Quadrant A | 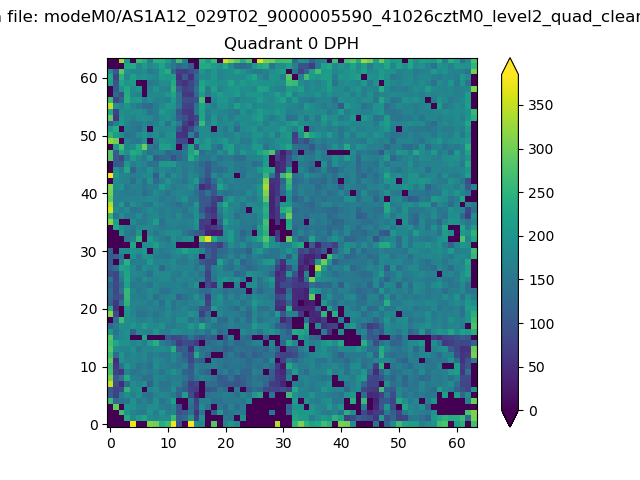 |
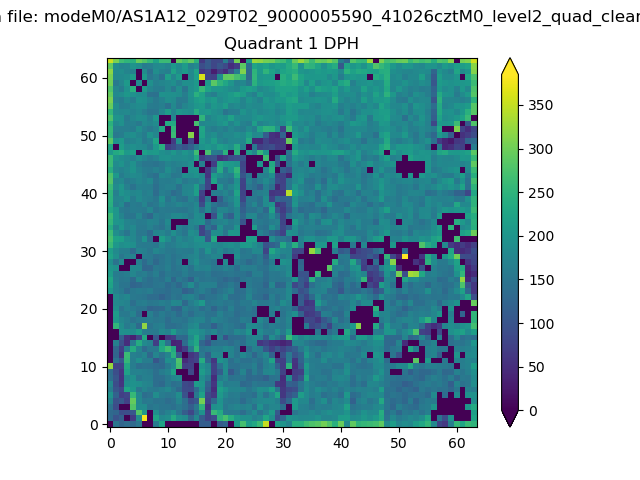 |
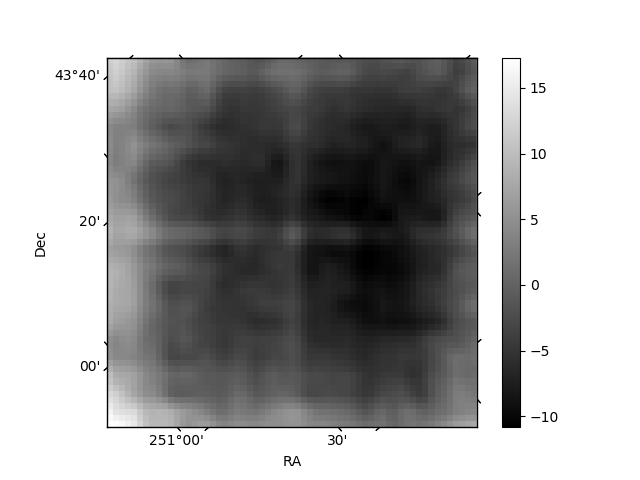
Quadrant B |
|---|---|---|---|
| Quadrant D | 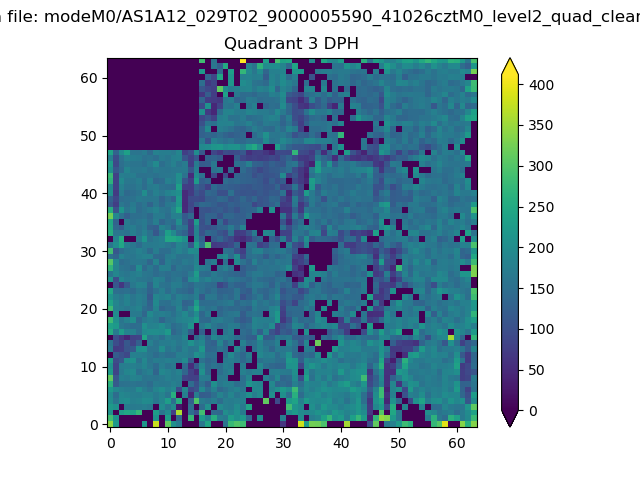 |
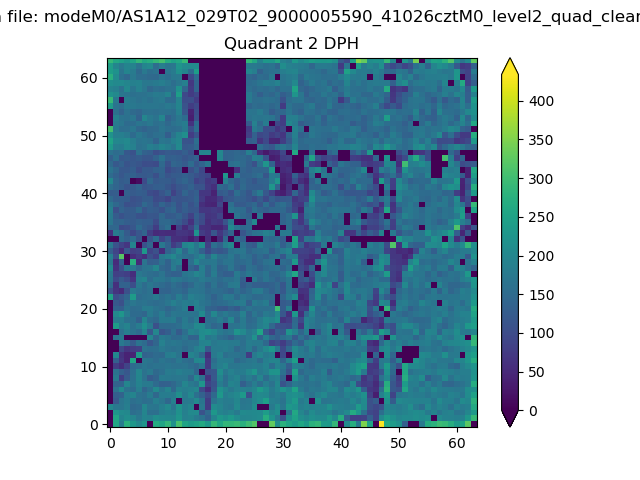 |
Quadrant C |
| Plot type | Count rate plots | Images |
|---|---|---|
| Comparison with Poisson distribution Blue bars denote a histogram of data divided into 1 sec bins. Red curve is a Poisson curve with rate = median count rate of data. |
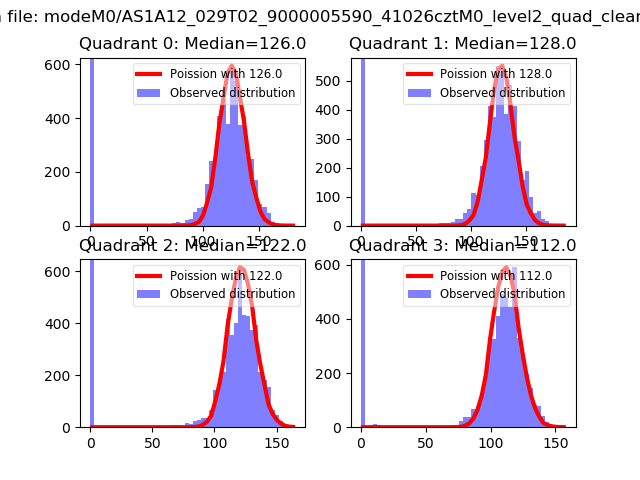 |
 |
| Quadrant-wise count rates Data is divided into 100 sec bins |
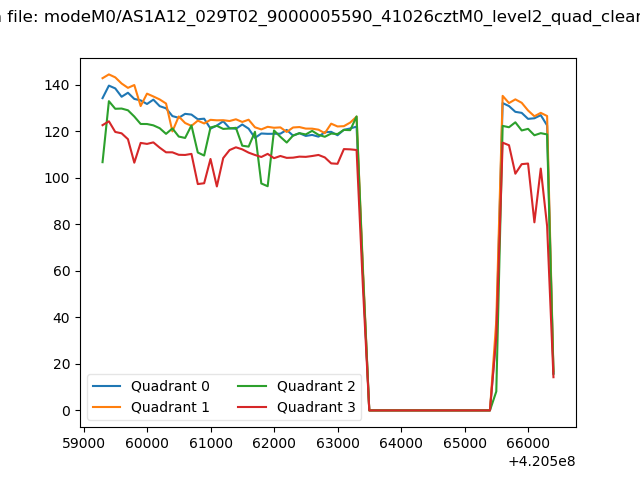 |
|
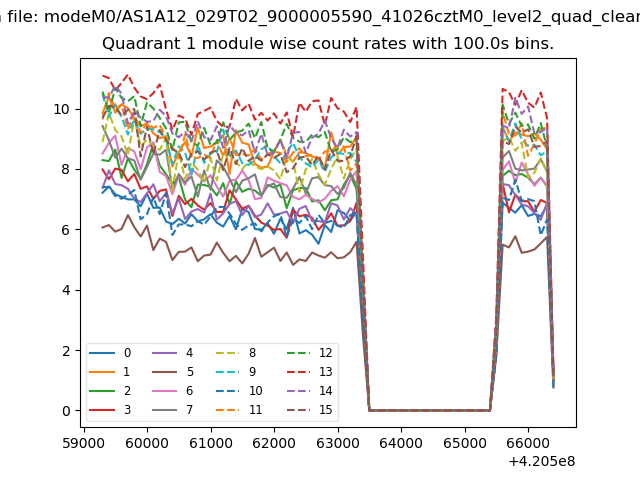
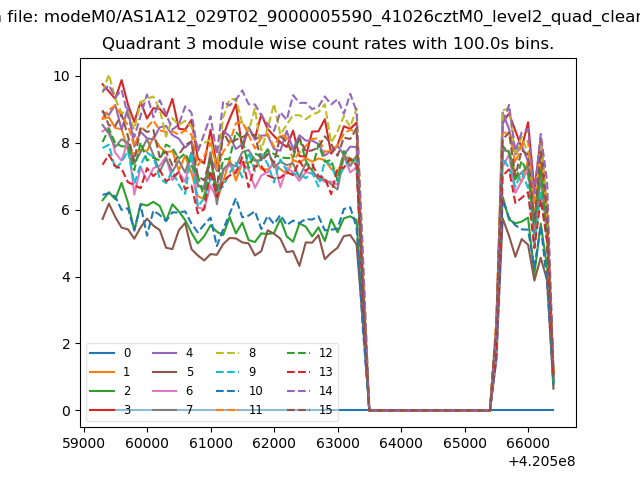
| Module-wise count rates for Quadrant A Data is divided into 100 sec bins |
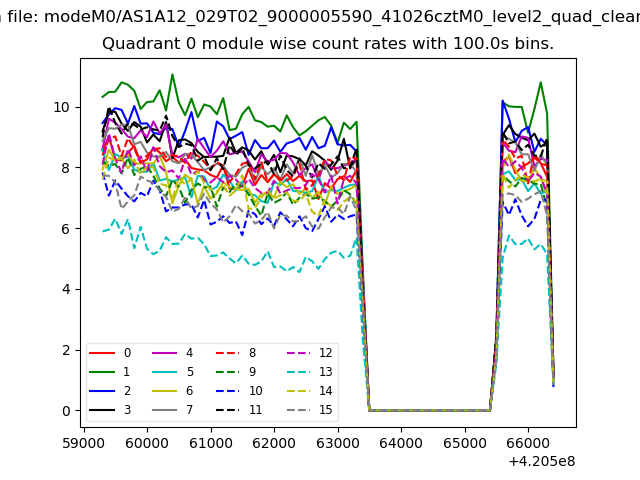 |
 |
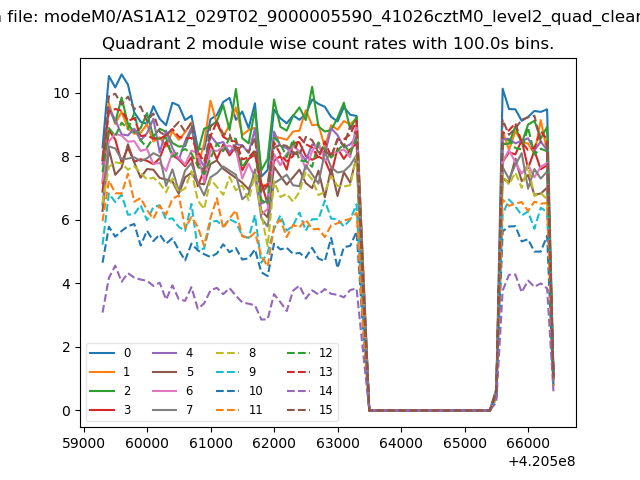
| Module-wise count rates for Quadrant B Data is divided into 100 sec bins |
 |
 |
| Module-wise count rates for Quadrant C Data is divided into 100 sec bins |
 |
 |
| Module-wise count rates for Quadrant D Data is divided into 100 sec bins |
 |
 |
| Parameter | Plot |
|---|---|
| CZT HV Monitor | 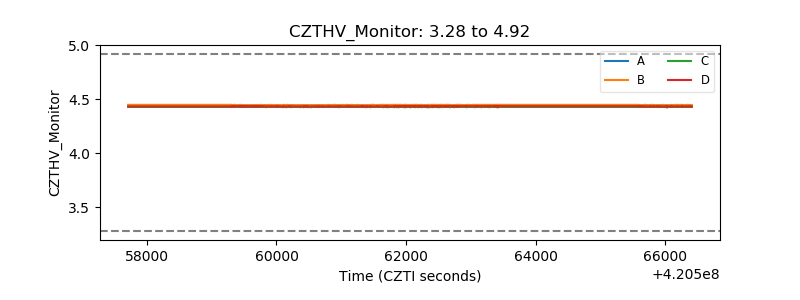 |
| D_VDD | 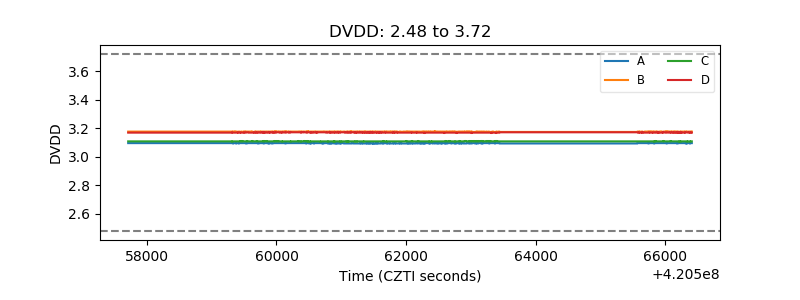 |
| Temperature 1 | 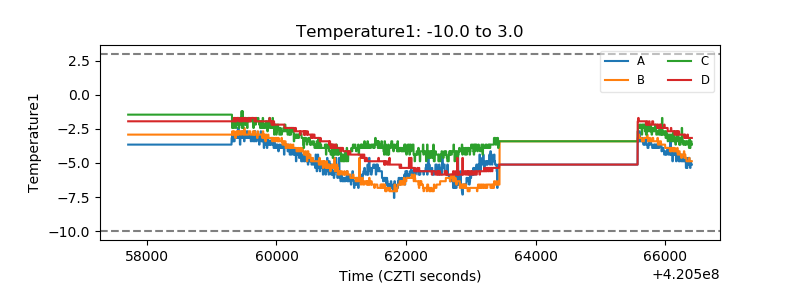 |
| Veto HV Monitor |  |
| Veto LLD | 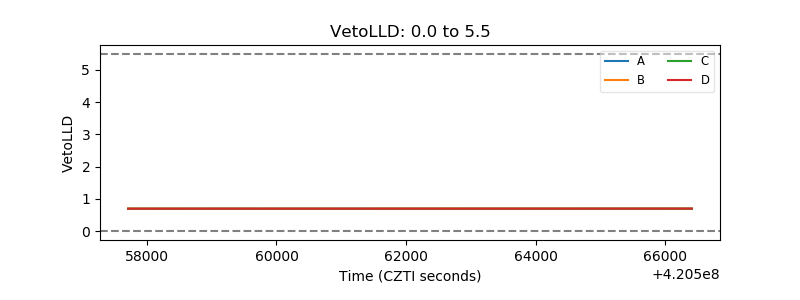 |
| Alpha Counter | 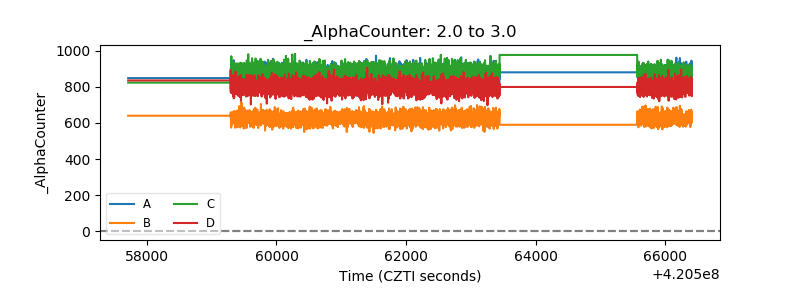 |
| _CPM_Rate |  |
| CZT Counter | 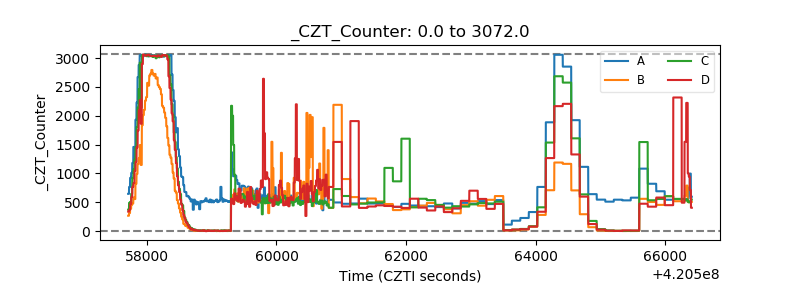 |
| +2.5 Volts monitor | 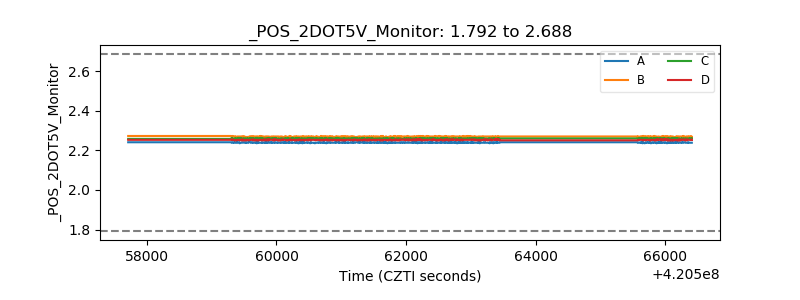 |
| +5 Volts monitor | 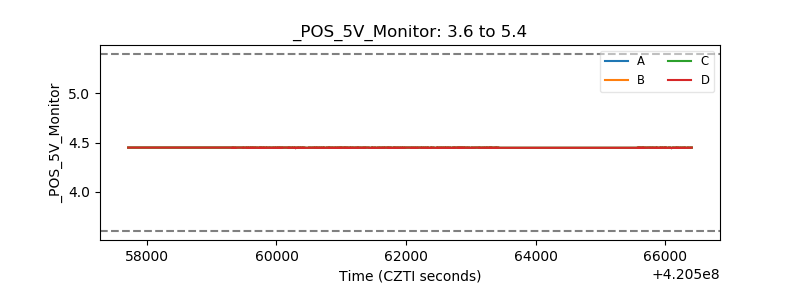 |
| _ROLL_ROT | 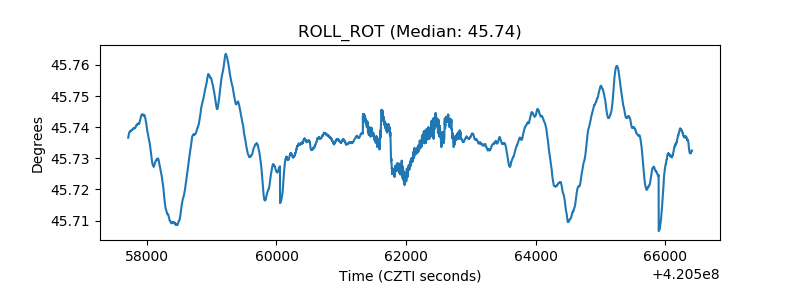 |
| _Roll_DEC | 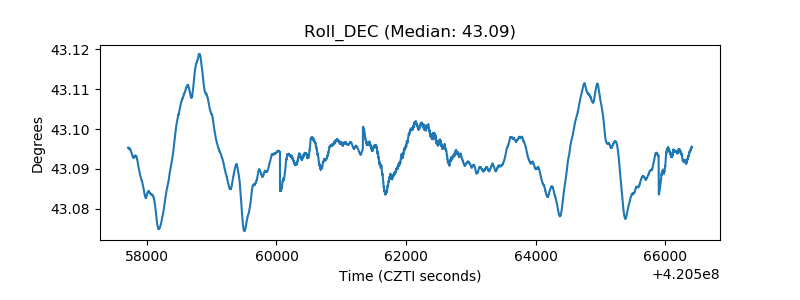 |
| _Roll_RA | 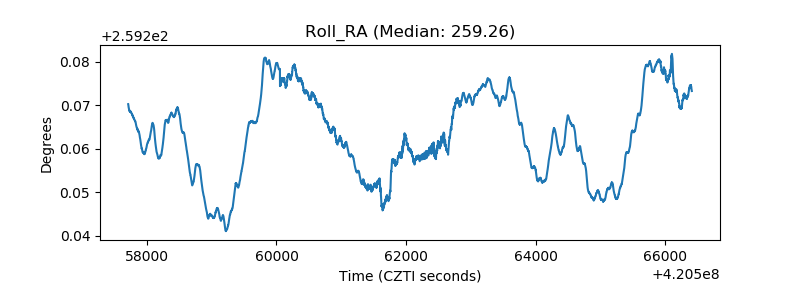 |
| Veto Counter | 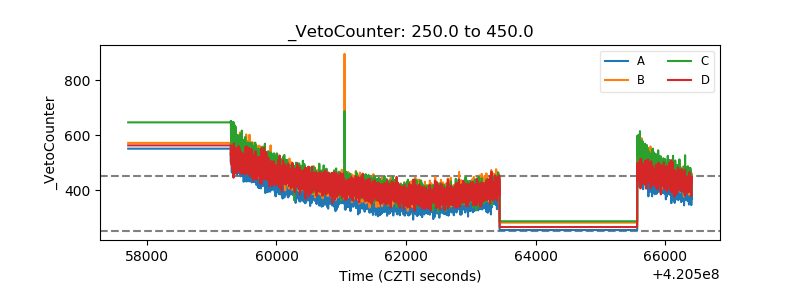 |