| Param | Original file | Final file |
|---|---|---|
| Filename | modeM0/AS1A12_029T02_9000005590_41027cztM0_level2.fits | modeM0/AS1A12_029T02_9000005590_41027cztM0_level2_quad_clean.evt |
| Size (bytes) | 292,072,320 | 86,034,240 |
| Size | 278.5 MB | 82.0 MB |
| Events in quadrant A | 2,680,239 | 581,214 |
| Events in quadrant B | 2,414,585 | 597,146 |
| Events in quadrant C | 2,679,538 | 566,132 |
| Events in quadrant D | 2,655,731 | 517,835 |
| Mode SS | |||
|---|---|---|---|
| Quadrant | BADHDUFLAG | Total packets | Discarded packets |
| A | 0 | 100 | 0 |
| B | 0 | 100 | 0 |
| C | 0 | 100 | 0 |
| D | 0 | 100 | 0 |
| Mode M0 | |||
|---|---|---|---|
| Quadrant | BADHDUFLAG | Total packets | Discarded packets |
| A | 0 | 11008 | 3 |
| B | 0 | 10242 | 2 |
| C | 0 | 10908 | 2 |
| D | 0 | 11354 | 2 |
| Mode M9 | |||
|---|---|---|---|
| Quadrant | BADHDUFLAG | Total packets | Discarded packets |
| A | 0 | 28 | 0 |
| B | 0 | 28 | 0 |
| C | 0 | 28 | 0 |
| D | 0 | 29 | 0 |
| Quadrant | Total seconds | Saturated seconds | Saturation percentage |
|---|---|---|---|
| A | 4889 | 18 | 0.368173% |
| B | 4889 | 15 | 0.306811% |
| C | 4889 | 84 | 1.718143% |
| D | 4889 | 132 | 2.699939% |
Noise dominated data is calculated using 1-second bins in cleaned event files. If a bin has >2000 counts, and if more than 50% of those come from <1% of pixels, then it is considered to be noise-dominated and hence unusable.
| Quadrant | # 1 sec bins | Bins with >0 counts | Bins with >2000 counts | High rate bins dominated by noise | Noise dominated (total time) | Noise dominated (detector-on time) | Marked lightcurve |
|---|---|---|---|---|---|---|---|
| A | 7012 | 4890 | 4 | 4 | 0.06% | 0.08% | 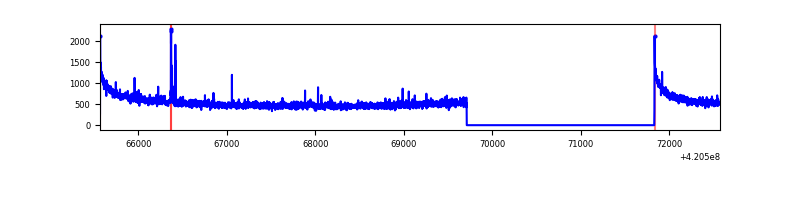 |
| B | 7012 | 4890 | 3 | 3 | 0.04% | 0.06% | 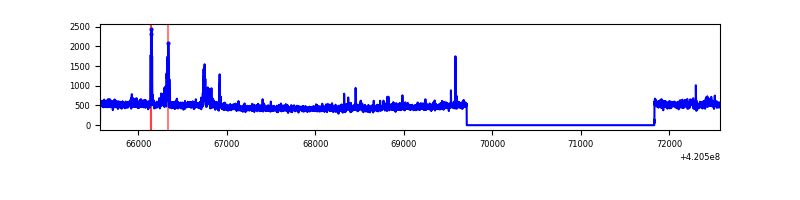 |
| C | 7012 | 4890 | 81 | 81 | 1.16% | 1.66% | 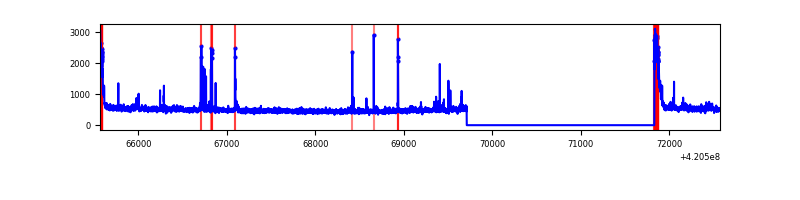 |
| D | 7012 | 4890 | 114 | 114 | 1.63% | 2.33% | 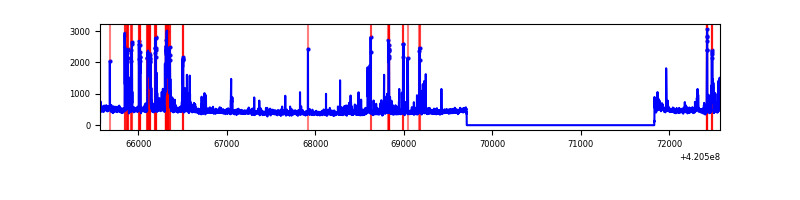 |
Top three noisy pixels from each quadrant. If the there are fewer than three noisy pixels in the level2.evt file, extra rows are filled as -1
| Pixel properties | Quadrant properties | ||||||
|---|---|---|---|---|---|---|---|
| Quadrant | DetID | PixID | Counts | Sigma | Mean | Median | Sigma |
| A | 10 | 83 | 477505 | 4196.45 | 553 | 543 | 113.7 |
| A | 13 | 248 | 32425 | 280.51 | 553 | 543 | 113.7 |
| A | 12 | 189 | 12973 | 109.36 | 553 | 543 | 113.7 |
| B | 0 | 245 | 100941 | 937.62 | 553 | 539 | 107.1 |
| B | 15 | 32 | 75109 | 696.39 | 553 | 539 | 107.1 |
| B | 0 | 229 | 41202 | 379.74 | 553 | 539 | 107.1 |
| C | 15 | 214 | 211872 | 1669.57 | 545 | 550 | 126.6 |
| C | 0 | 10 | 203857 | 1606.25 | 545 | 550 | 126.6 |
| C | 14 | 254 | 65764 | 515.23 | 545 | 550 | 126.6 |
| D | 13 | 249 | 304568 | 2316.02 | 540 | 523 | 131.3 |
| D | 2 | 249 | 116069 | 880.16 | 540 | 523 | 131.3 |
| D | 9 | 19 | 83409 | 631.37 | 540 | 523 | 131.3 |
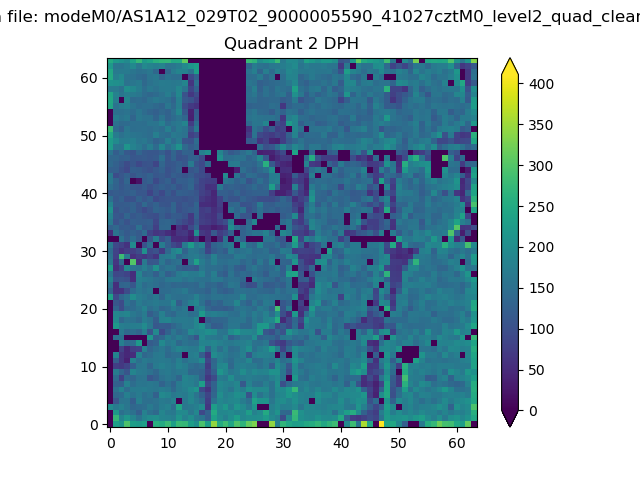
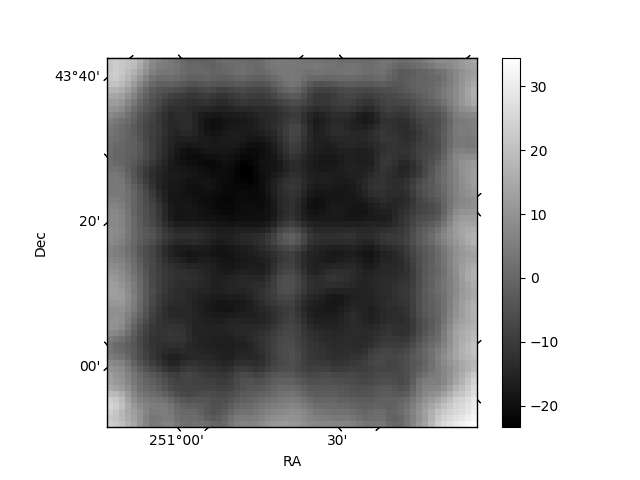
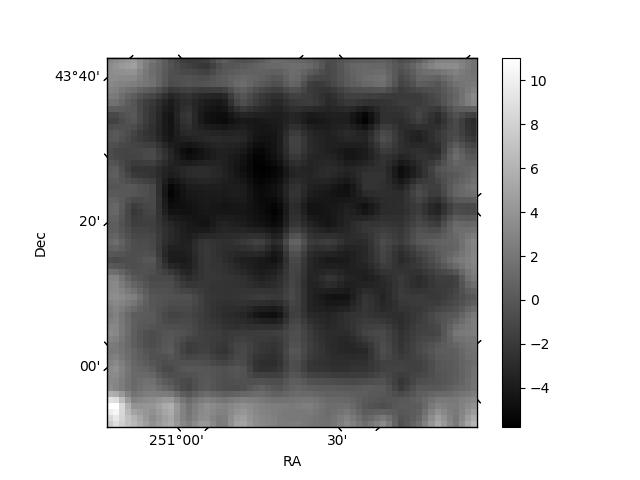
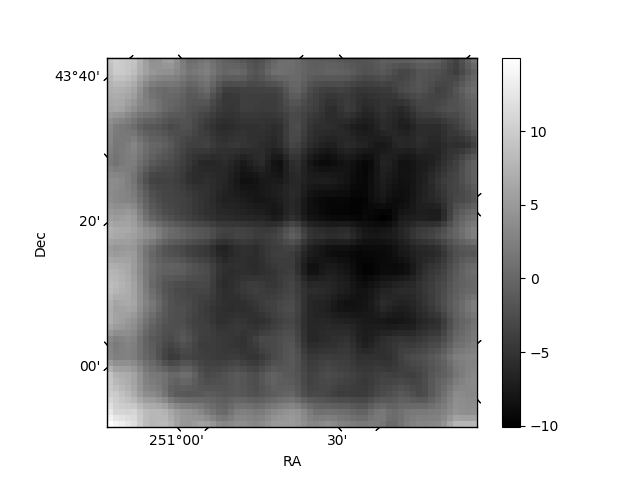
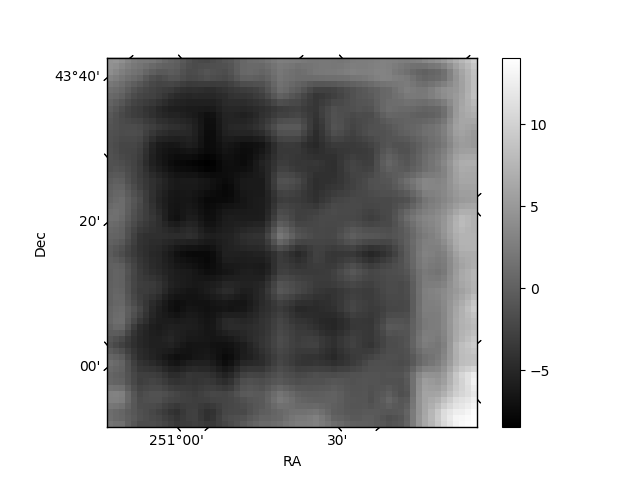
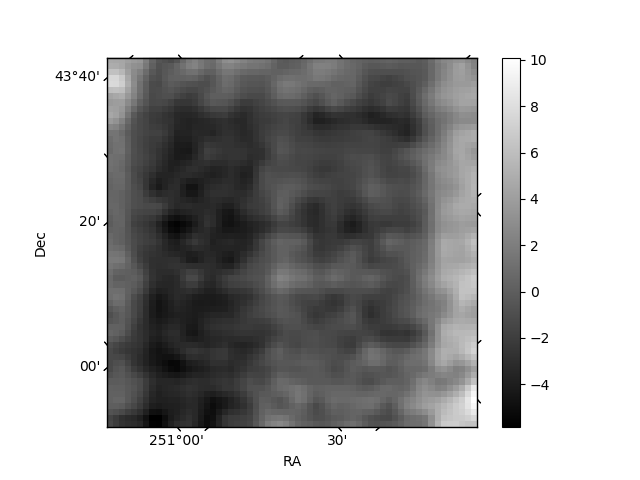
Histogram calculated using DETX and DETY for each event in the final _common_clean file
| Quadrant A | 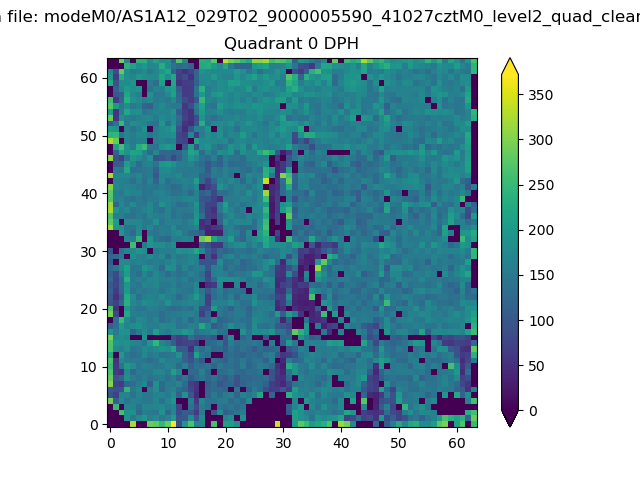 |
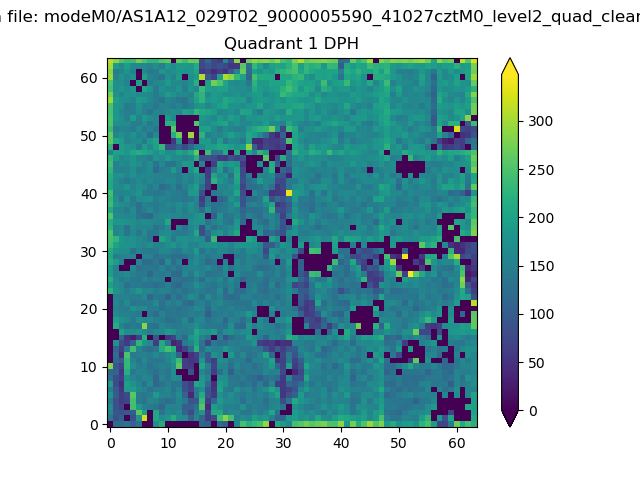 |
Quadrant B |
|---|---|---|---|
| Quadrant D | 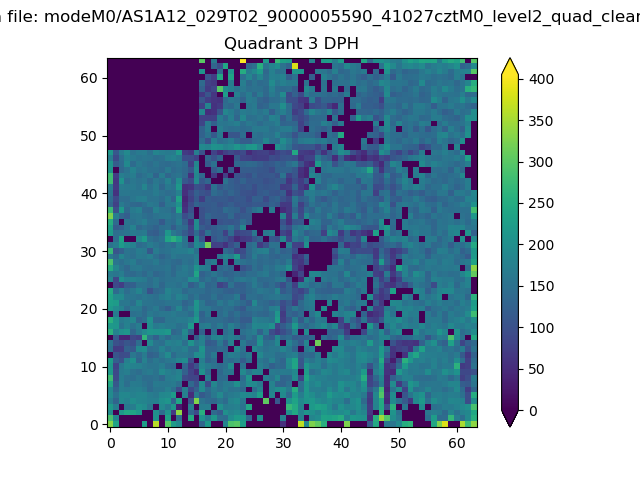 |
 |
Quadrant C |
| Plot type | Count rate plots | Images |
|---|---|---|
| Comparison with Poisson distribution Blue bars denote a histogram of data divided into 1 sec bins. Red curve is a Poisson curve with rate = median count rate of data. |
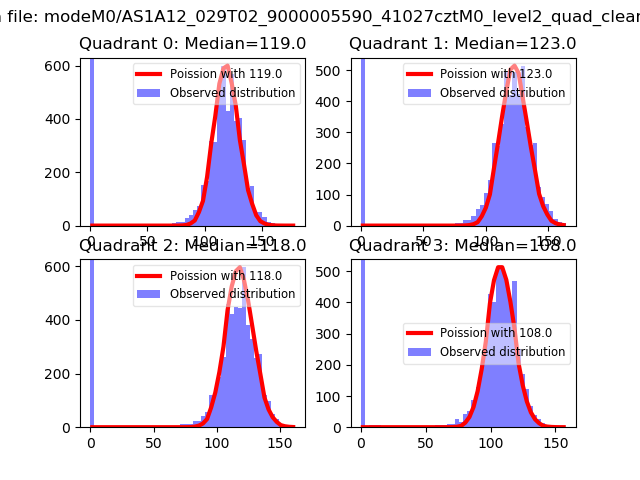 |
 |
| Quadrant-wise count rates Data is divided into 100 sec bins |
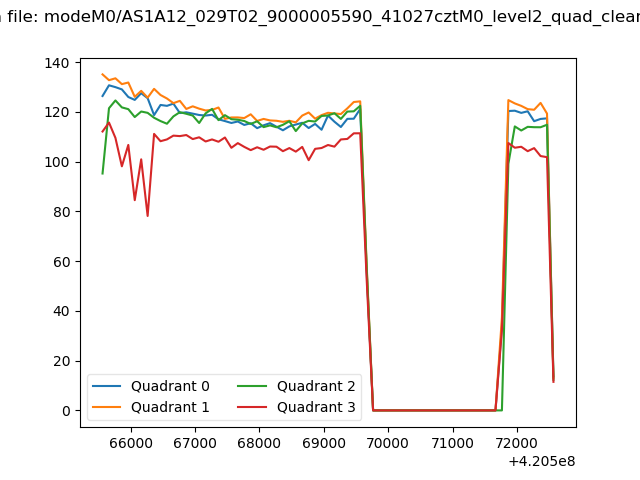 |
|
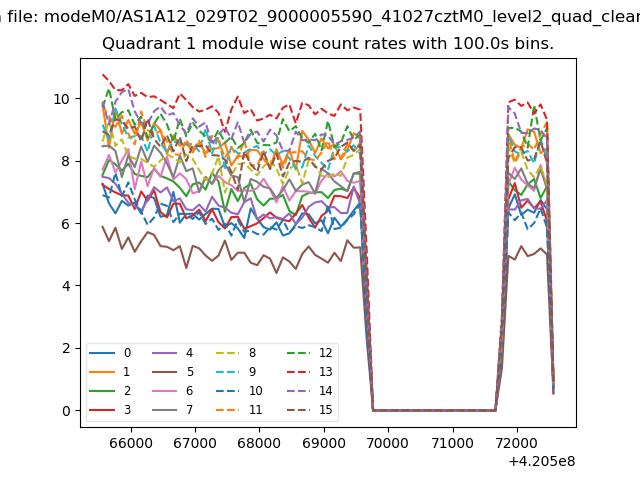
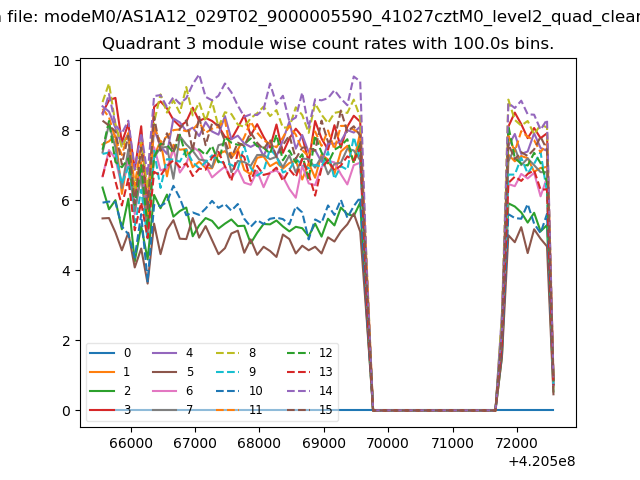
| Module-wise count rates for Quadrant A Data is divided into 100 sec bins |
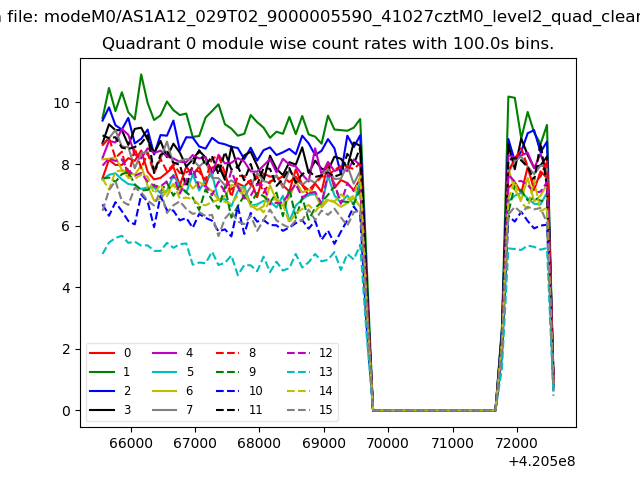 |
 |
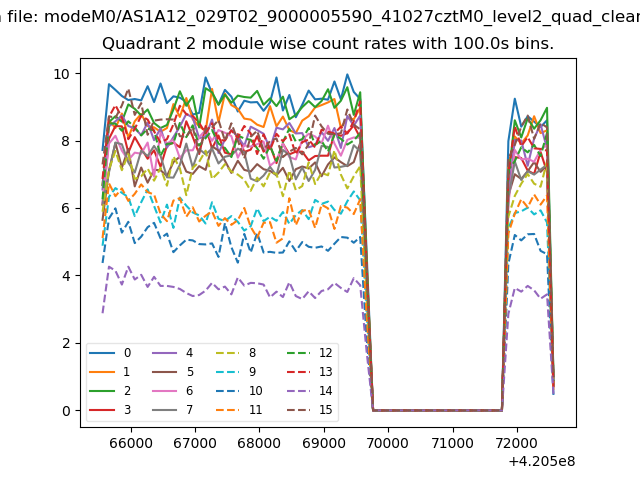
| Module-wise count rates for Quadrant B Data is divided into 100 sec bins |
 |
 |
| Module-wise count rates for Quadrant C Data is divided into 100 sec bins |
 |
 |
| Module-wise count rates for Quadrant D Data is divided into 100 sec bins |
 |
 |
| Parameter | Plot |
|---|---|
| CZT HV Monitor | 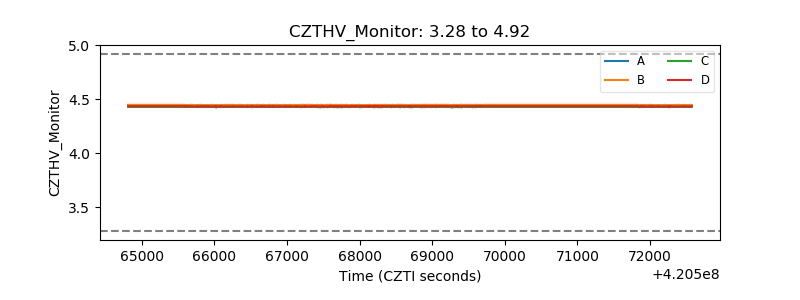 |
| D_VDD | 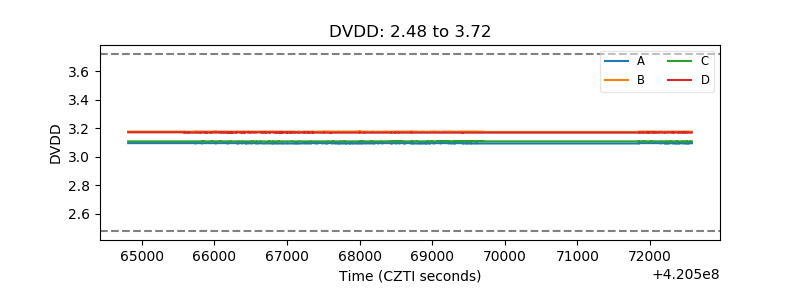 |
| Temperature 1 | 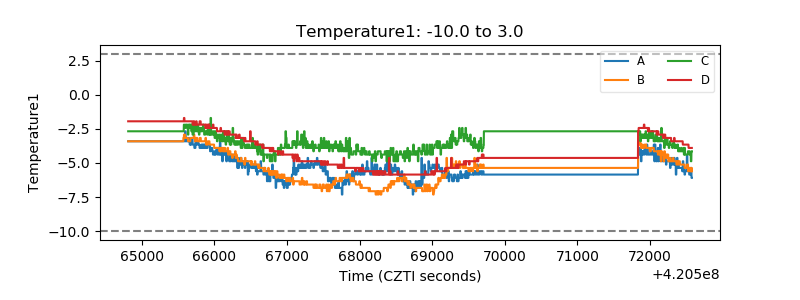 |
| Veto HV Monitor |  |
| Veto LLD | 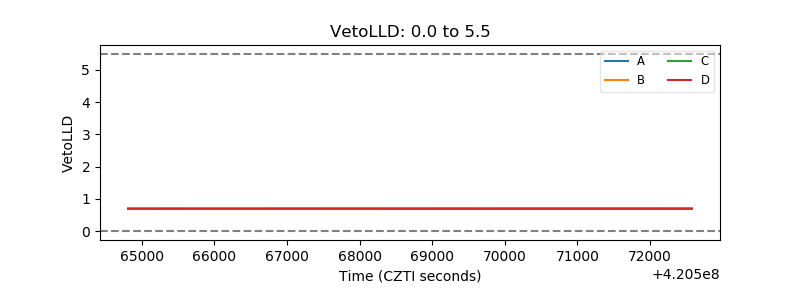 |
| Alpha Counter | 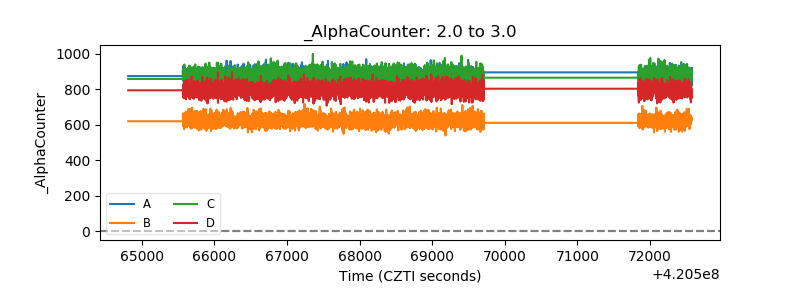 |
| _CPM_Rate | 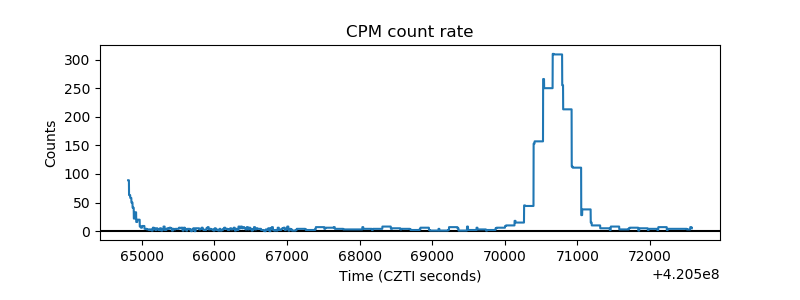 |
| CZT Counter | 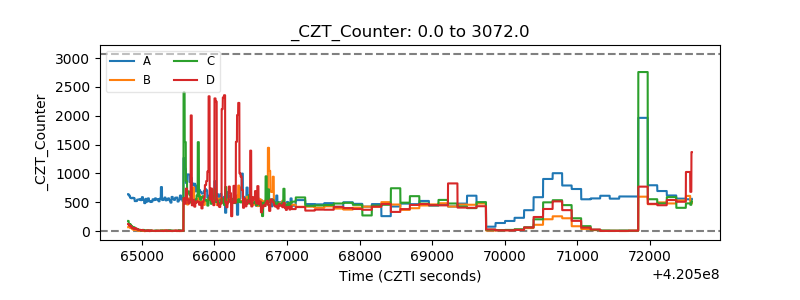 |
| +2.5 Volts monitor | 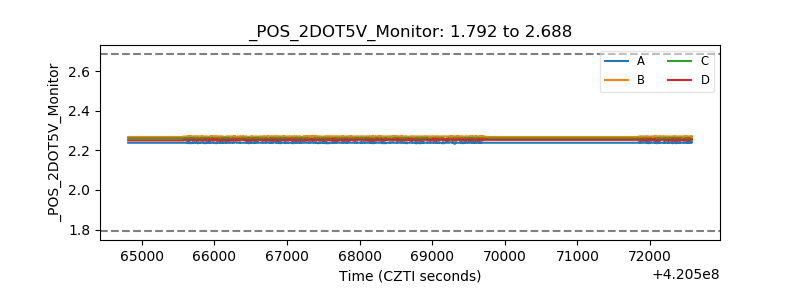 |
| +5 Volts monitor | 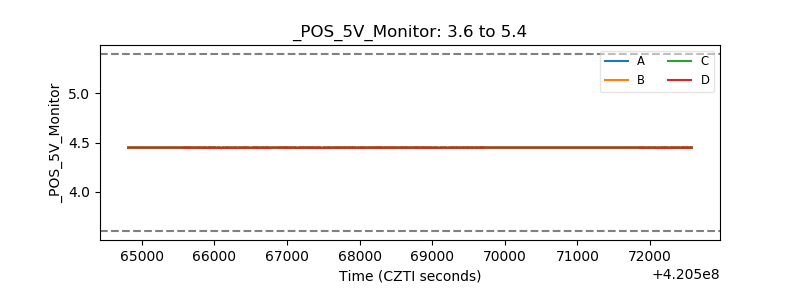 |
| _ROLL_ROT | 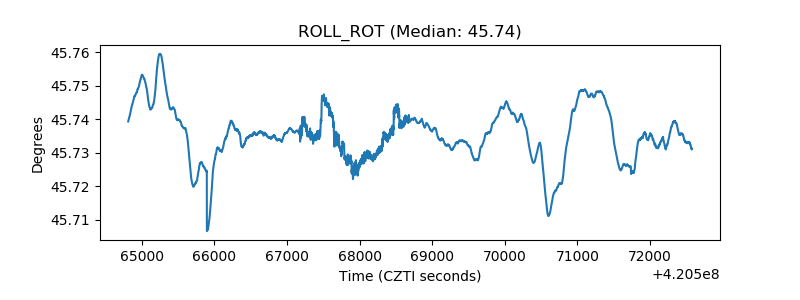 |
| _Roll_DEC | 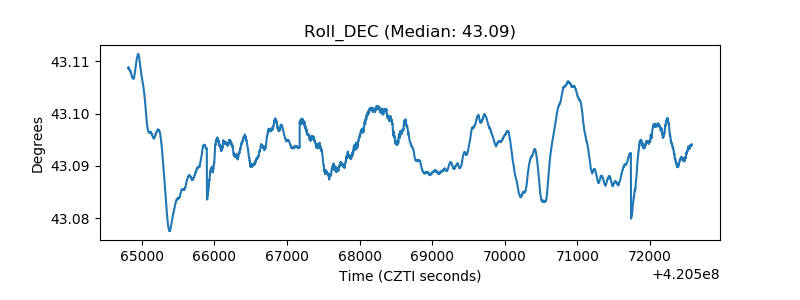 |
| _Roll_RA | 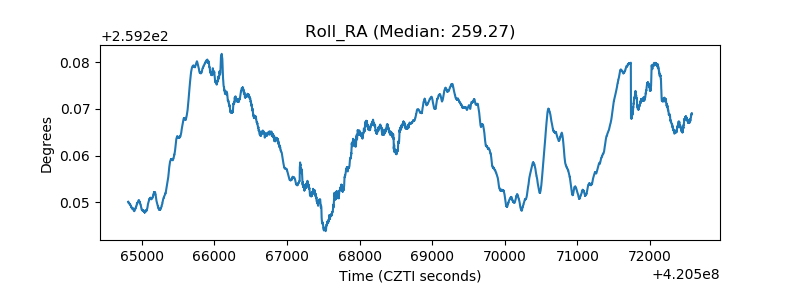 |
| Veto Counter | 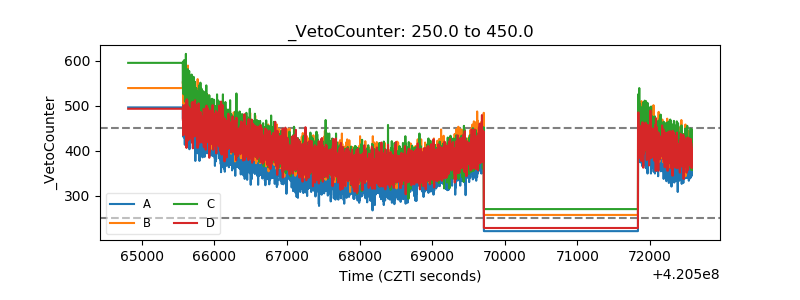 |