| Param | Original file | Final file |
|---|---|---|
| Filename | modeM0/AS1A12_029T02_9000005590_41029cztM0_level2.fits | modeM0/AS1A12_029T02_9000005590_41029cztM0_level2_quad_clean.evt |
| Size (bytes) | 337,550,400 | 99,800,640 |
| Size | 321.9 MB | 95.2 MB |
| Events in quadrant A | 3,175,979 | 661,075 |
| Events in quadrant B | 2,812,490 | 681,812 |
| Events in quadrant C | 3,108,782 | 656,387 |
| Events in quadrant D | 2,930,593 | 603,488 |
| Mode SS | |||
|---|---|---|---|
| Quadrant | BADHDUFLAG | Total packets | Discarded packets |
| A | 0 | 126 | 0 |
| B | 0 | 126 | 0 |
| C | 0 | 126 | 0 |
| D | 0 | 126 | 0 |
| Mode M0 | |||
|---|---|---|---|
| Quadrant | BADHDUFLAG | Total packets | Discarded packets |
| A | 0 | 13152 | 3 |
| B | 0 | 12382 | 2 |
| C | 0 | 13061 | 2 |
| D | 0 | 13199 | 2 |
| Mode M9 | |||
|---|---|---|---|
| Quadrant | BADHDUFLAG | Total packets | Discarded packets |
| A | 0 | 35 | 0 |
| B | 0 | 35 | 0 |
| C | 0 | 35 | 0 |
| D | 0 | 35 | 0 |
| Quadrant | Total seconds | Saturated seconds | Saturation percentage |
|---|---|---|---|
| A | 5996 | 14 | 0.233489% |
| B | 5996 | 16 | 0.266845% |
| C | 5996 | 98 | 1.634423% |
| D | 5996 | 80 | 1.334223% |
Noise dominated data is calculated using 1-second bins in cleaned event files. If a bin has >2000 counts, and if more than 50% of those come from <1% of pixels, then it is considered to be noise-dominated and hence unusable.
| Quadrant | # 1 sec bins | Bins with >0 counts | Bins with >2000 counts | High rate bins dominated by noise | Noise dominated (total time) | Noise dominated (detector-on time) | Marked lightcurve |
|---|---|---|---|---|---|---|---|
| A | 9612 | 5999 | 4 | 4 | 0.04% | 0.07% | 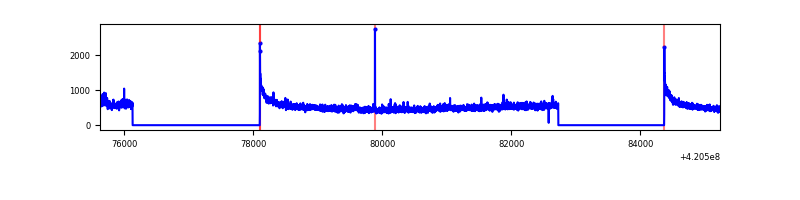 |
| B | 9612 | 5999 | 1 | 1 | 0.01% | 0.02% | 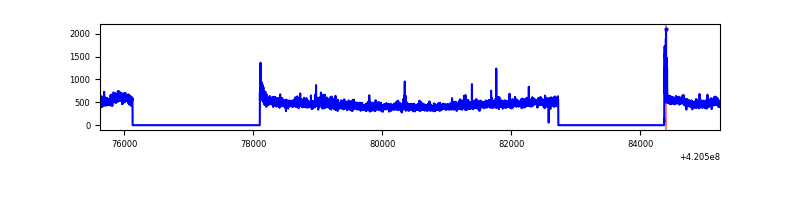 |
| C | 9612 | 5999 | 56 | 56 | 0.58% | 0.93% | 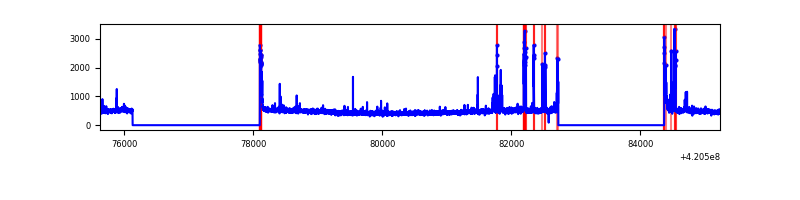 |
| D | 9612 | 5999 | 82 | 82 | 0.85% | 1.37% | 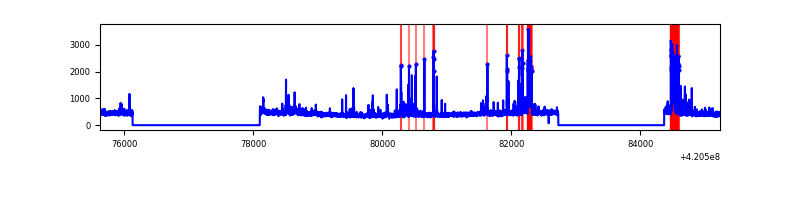 |
Top three noisy pixels from each quadrant. If the there are fewer than three noisy pixels in the level2.evt file, extra rows are filled as -1
| Pixel properties | Quadrant properties | ||||||
|---|---|---|---|---|---|---|---|
| Quadrant | DetID | PixID | Counts | Sigma | Mean | Median | Sigma |
| A | 10 | 83 | 520282 | 3896.47 | 652 | 639 | 133.4 |
| A | 12 | 189 | 124240 | 926.81 | 652 | 639 | 133.4 |
| A | 13 | 254 | 8477 | 58.77 | 652 | 639 | 133.4 |
| B | 0 | 229 | 124866 | 976.36 | 650 | 631 | 127.2 |
| B | 0 | 190 | 56063 | 435.64 | 650 | 631 | 127.2 |
| B | 0 | 245 | 52370 | 406.62 | 650 | 631 | 127.2 |
| C | 15 | 214 | 255510 | 1697.08 | 639 | 643 | 150.2 |
| C | 14 | 254 | 231682 | 1538.42 | 639 | 643 | 150.2 |
| C | 0 | 10 | 93915 | 621.07 | 639 | 643 | 150.2 |
| D | 13 | 249 | 184566 | 1177.65 | 636 | 618 | 156.2 |
| D | 13 | 171 | 183691 | 1172.05 | 636 | 618 | 156.2 |
| D | 2 | 153 | 47718 | 301.54 | 636 | 618 | 156.2 |
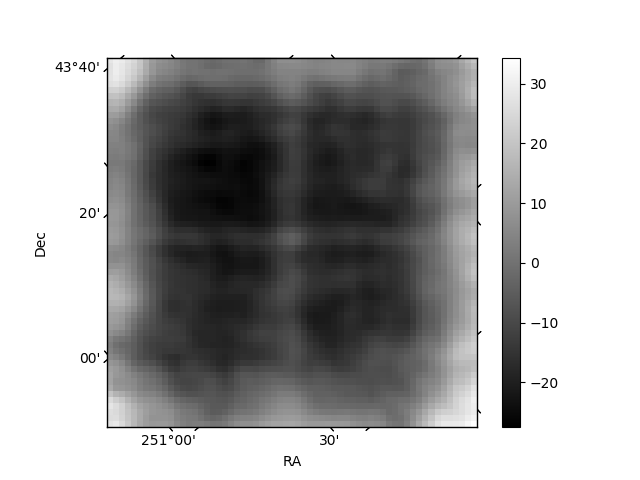
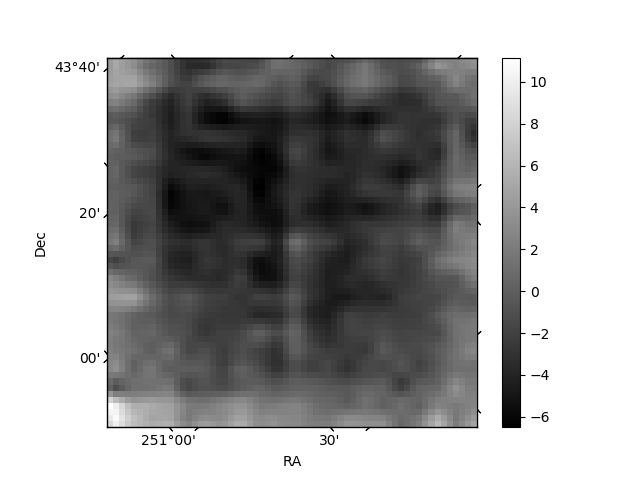
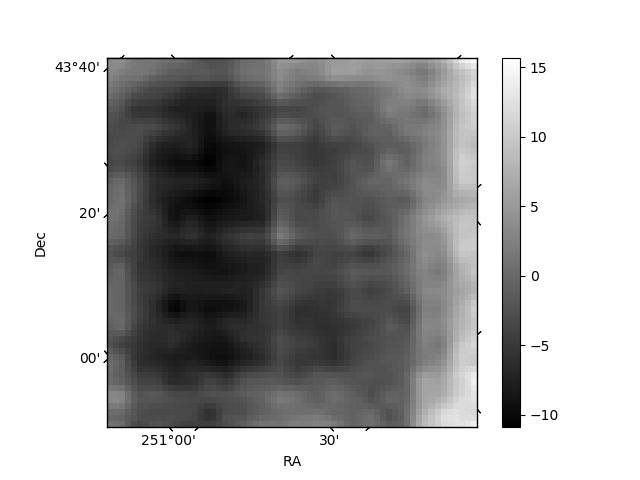
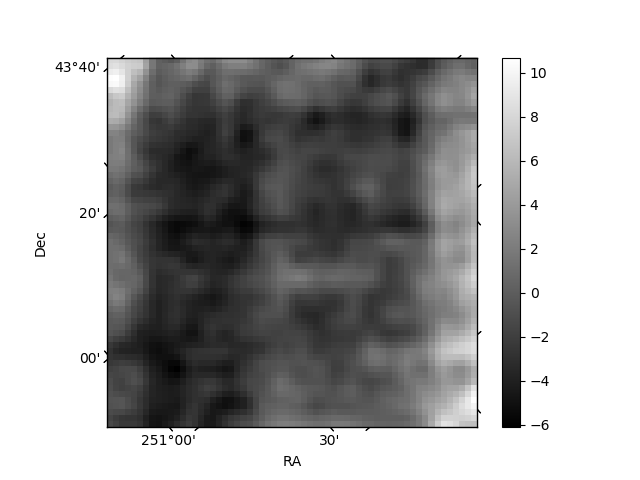
Histogram calculated using DETX and DETY for each event in the final _common_clean file
| Quadrant A | 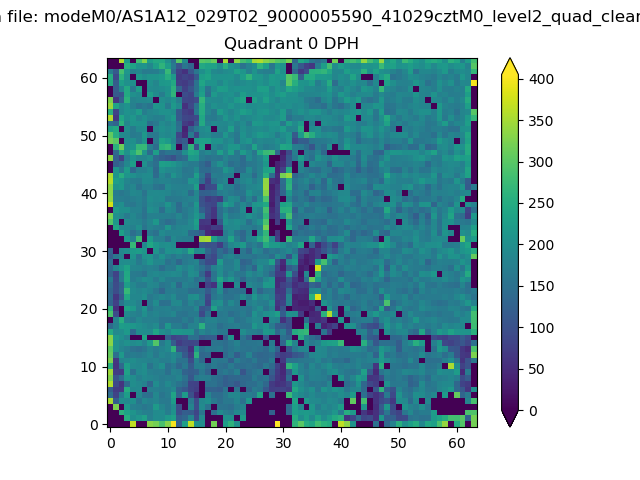 |
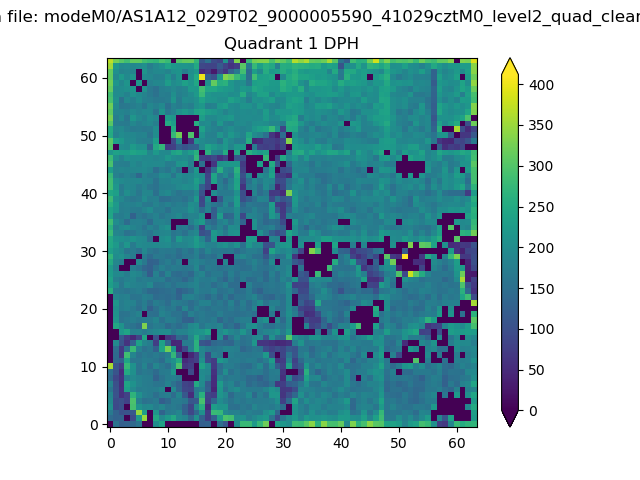 |
Quadrant B |
|---|---|---|---|
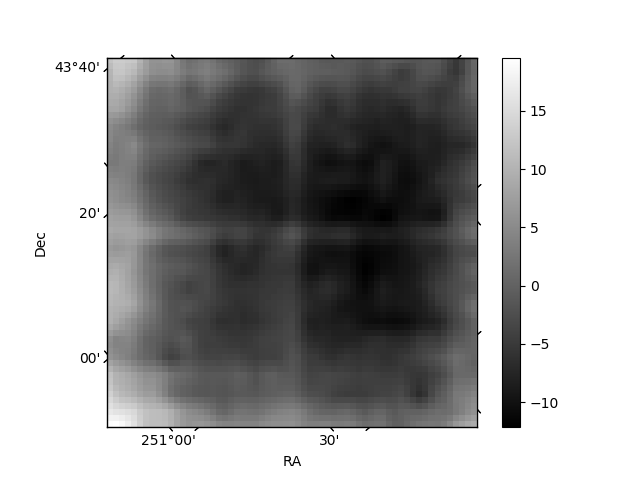
| Quadrant D | 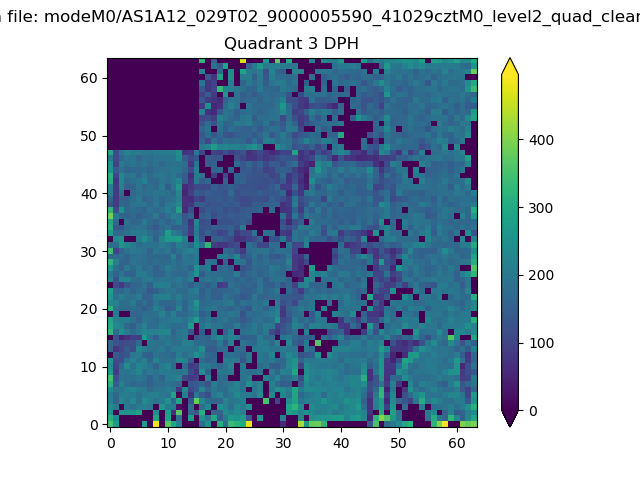 |
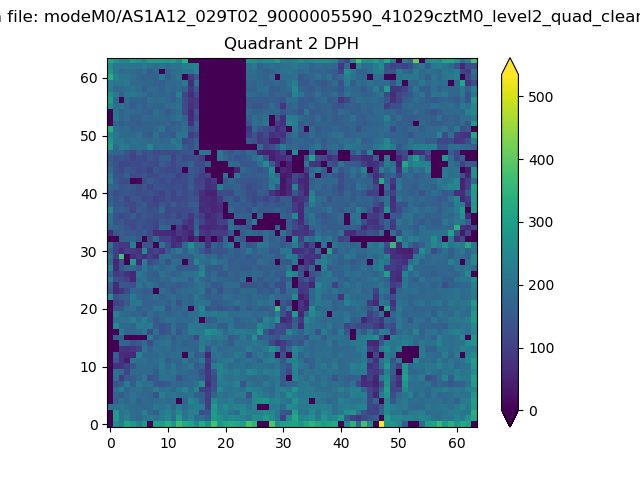 |
Quadrant C |
| Plot type | Count rate plots | Images |
|---|---|---|
| Comparison with Poisson distribution Blue bars denote a histogram of data divided into 1 sec bins. Red curve is a Poisson curve with rate = median count rate of data. |
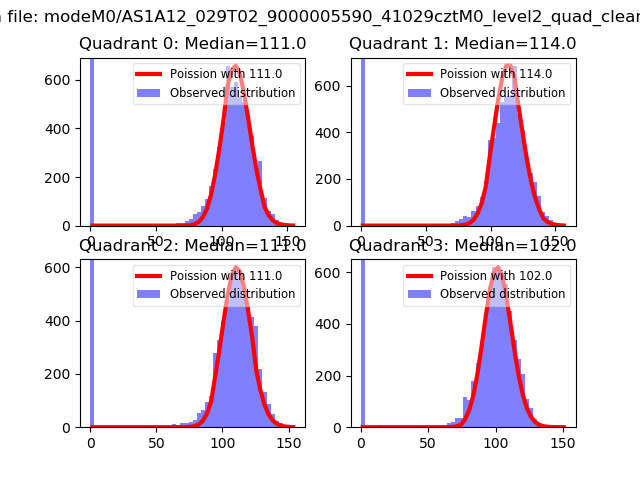 |
 |
| Quadrant-wise count rates Data is divided into 100 sec bins |
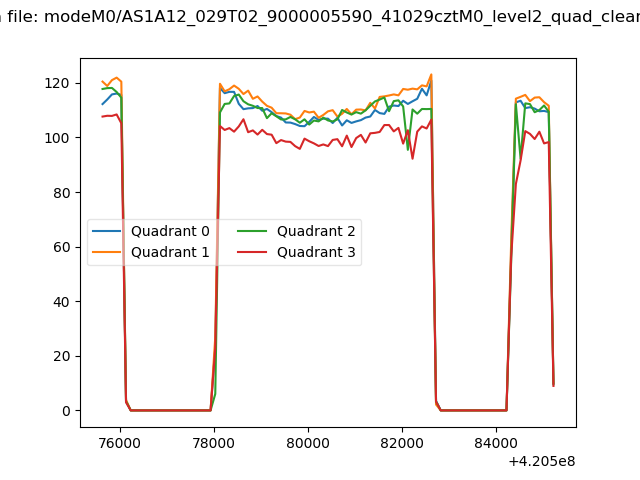 |
|
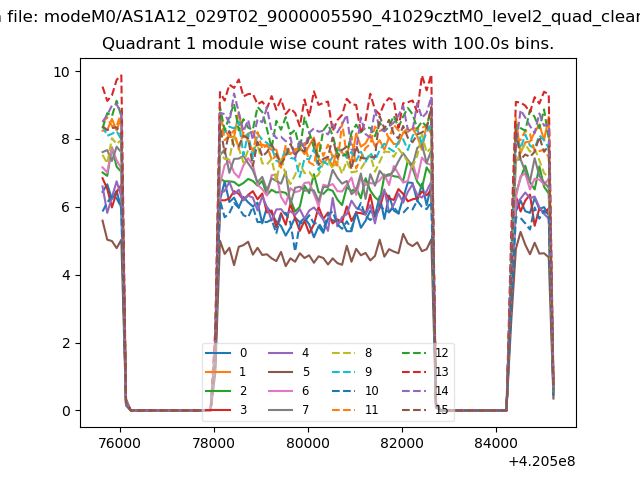
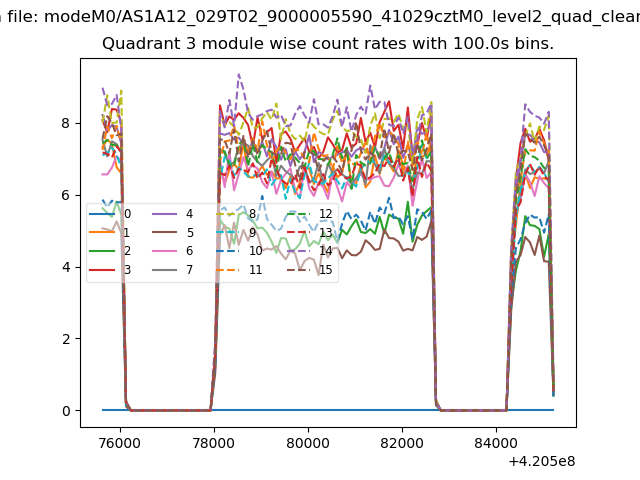
| Module-wise count rates for Quadrant A Data is divided into 100 sec bins |
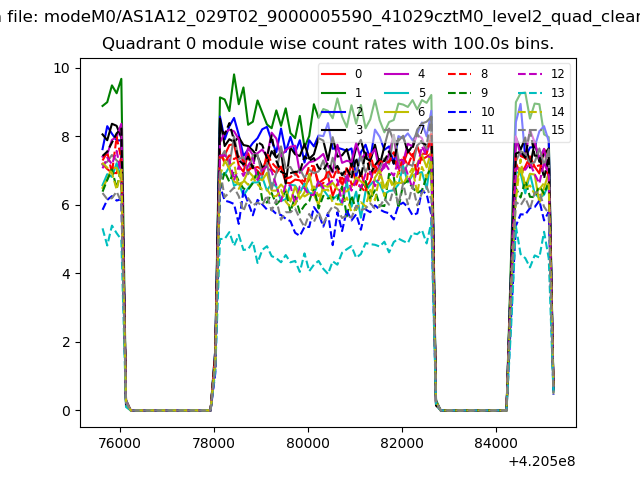 |
 |
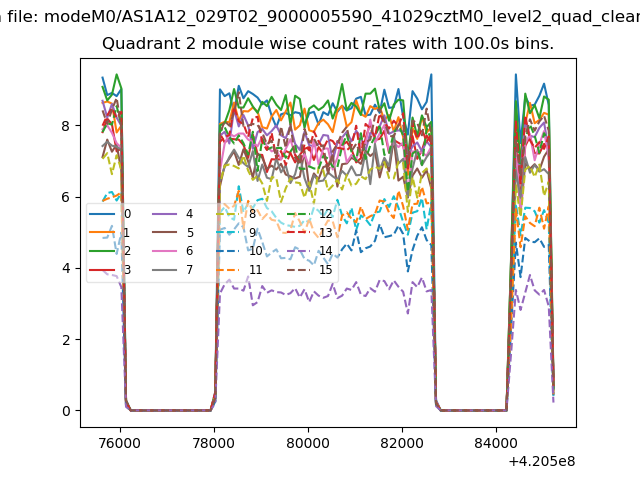
| Module-wise count rates for Quadrant B Data is divided into 100 sec bins |
 |
 |
| Module-wise count rates for Quadrant C Data is divided into 100 sec bins |
 |
 |
| Module-wise count rates for Quadrant D Data is divided into 100 sec bins |
 |
 |
| Parameter | Plot |
|---|---|
| CZT HV Monitor | 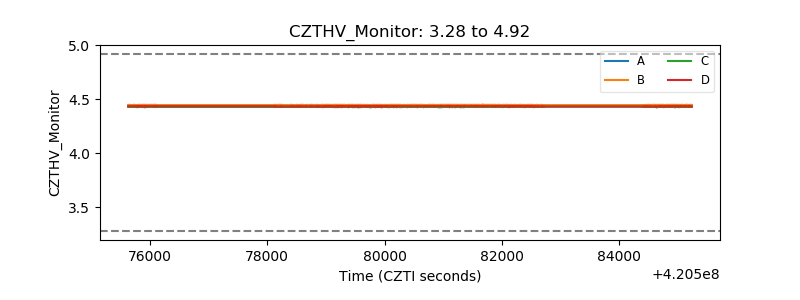 |
| D_VDD | 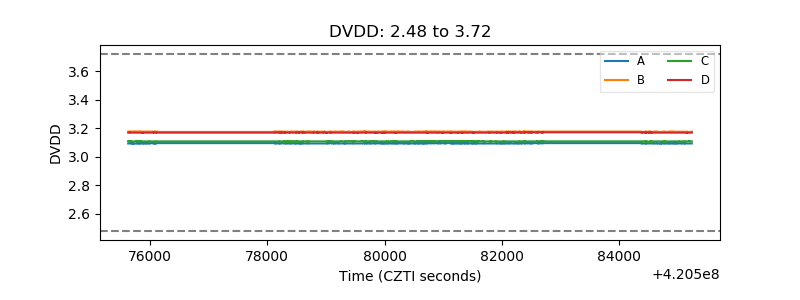 |
| Temperature 1 | 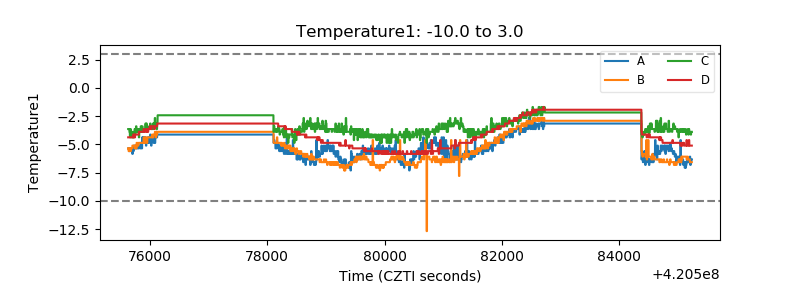 |
| Veto HV Monitor | 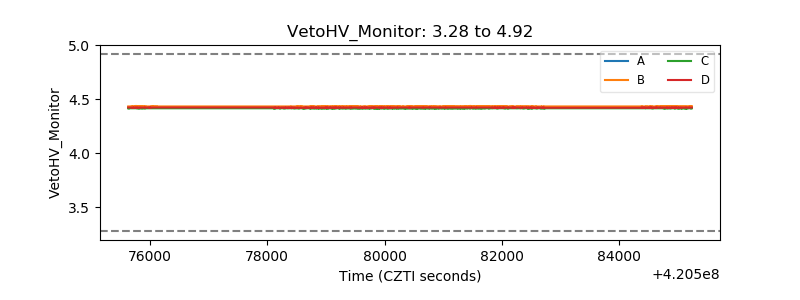 |
| Veto LLD | 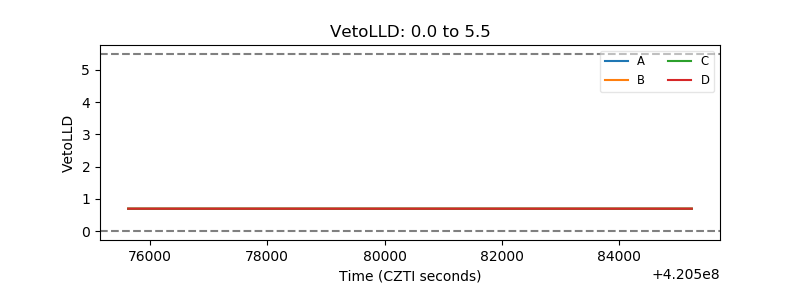 |
| Alpha Counter | 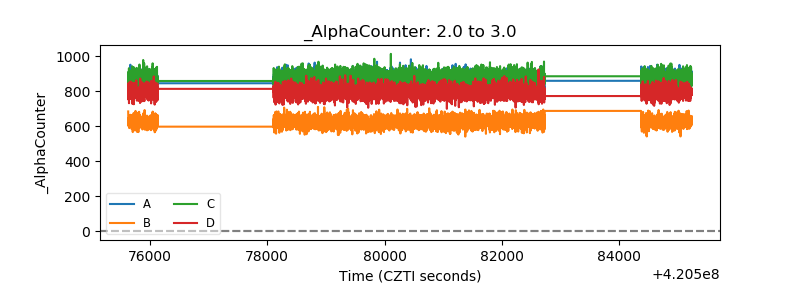 |
| _CPM_Rate | 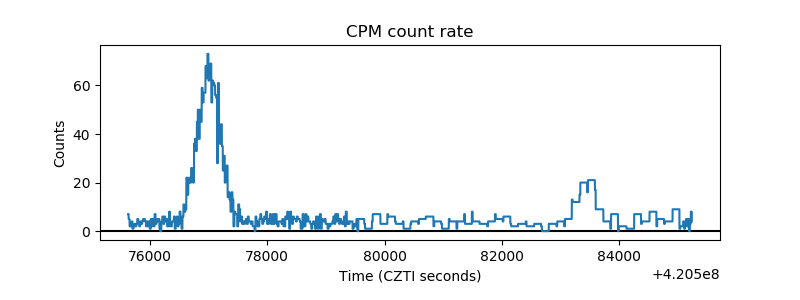 |
| CZT Counter | 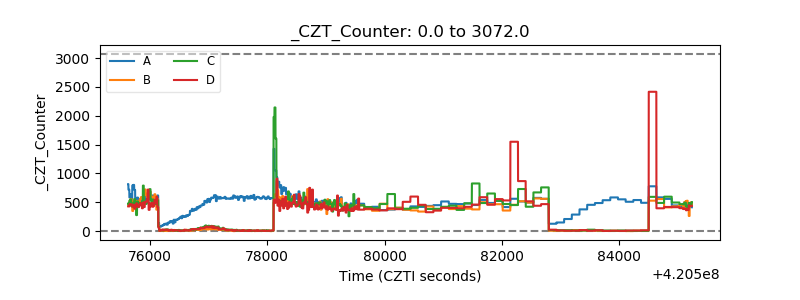 |
| +2.5 Volts monitor | 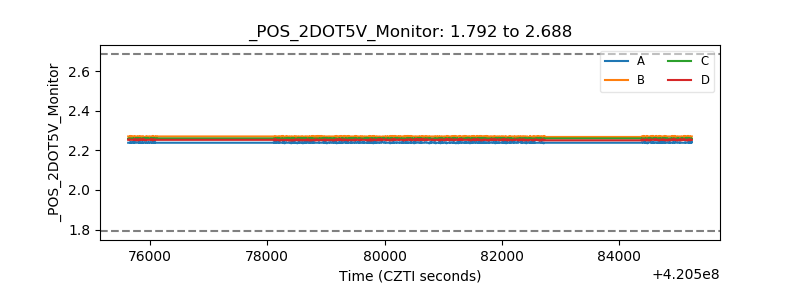 |
| +5 Volts monitor | 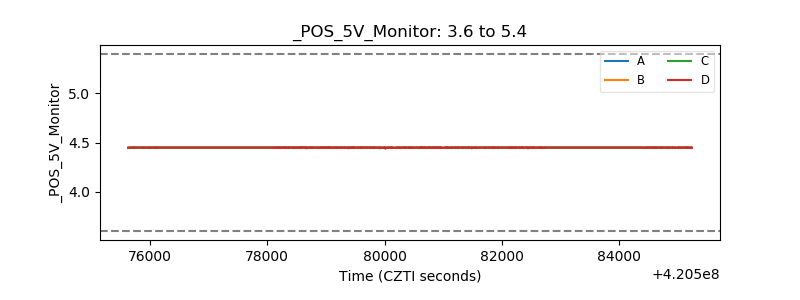 |
| _ROLL_ROT | 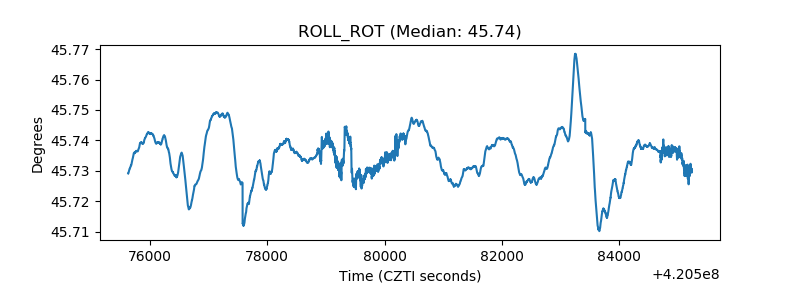 |
| _Roll_DEC | 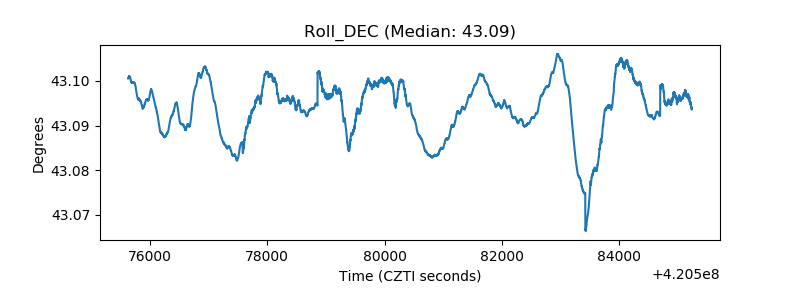 |
| _Roll_RA | 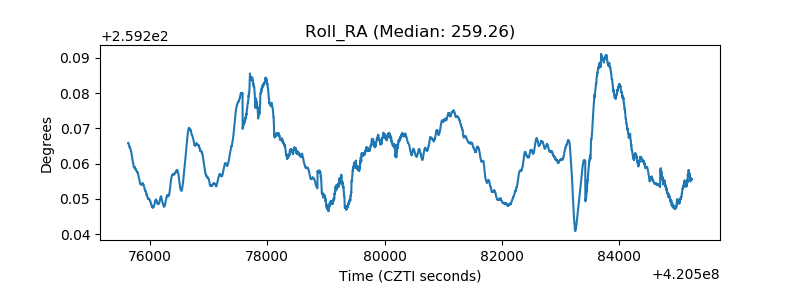 |
| Veto Counter | 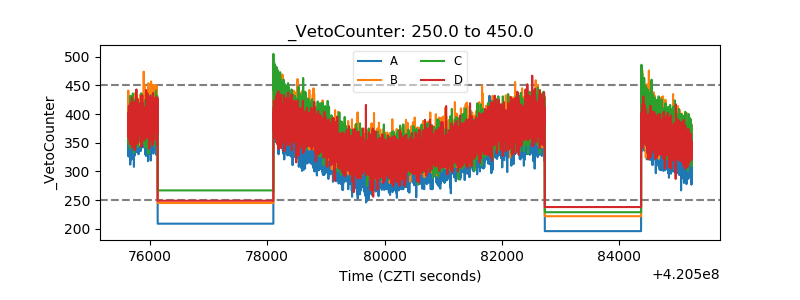 |