| Param | Original file | Final file |
|---|---|---|
| Filename | modeM0/AS1A12_029T02_9000005590_41030cztM0_level2.fits | modeM0/AS1A12_029T02_9000005590_41030cztM0_level2_quad_clean.evt |
| Size (bytes) | 342,604,800 | 94,656,960 |
| Size | 326.7 MB | 90.3 MB |
| Events in quadrant A | 2,971,384 | 632,004 |
| Events in quadrant B | 2,679,100 | 650,619 |
| Events in quadrant C | 3,373,245 | 614,640 |
| Events in quadrant D | 3,205,236 | 562,570 |
| Mode SS | |||
|---|---|---|---|
| Quadrant | BADHDUFLAG | Total packets | Discarded packets |
| A | 0 | 118 | 0 |
| B | 0 | 118 | 0 |
| C | 0 | 118 | 0 |
| D | 0 | 118 | 0 |
| Mode M0 | |||
|---|---|---|---|
| Quadrant | BADHDUFLAG | Total packets | Discarded packets |
| A | 0 | 12526 | 16 |
| B | 0 | 11937 | 9 |
| C | 0 | 13801 | 20 |
| D | 0 | 14041 | 37 |
| Mode M9 | |||
|---|---|---|---|
| Quadrant | BADHDUFLAG | Total packets | Discarded packets |
| A | 0 | 28 | 0 |
| B | 0 | 28 | 0 |
| C | 0 | 28 | 0 |
| D | 0 | 29 | 0 |
| Quadrant | Total seconds | Saturated seconds | Saturation percentage |
|---|---|---|---|
| A | 5813 | 11 | 0.189231% |
| B | 5817 | 22 | 0.378202% |
| C | 5815 | 169 | 2.906277% |
| D | 5811 | 216 | 3.717088% |
Noise dominated data is calculated using 1-second bins in cleaned event files. If a bin has >2000 counts, and if more than 50% of those come from <1% of pixels, then it is considered to be noise-dominated and hence unusable.
| Quadrant | # 1 sec bins | Bins with >0 counts | Bins with >2000 counts | High rate bins dominated by noise | Noise dominated (total time) | Noise dominated (detector-on time) | Marked lightcurve |
|---|---|---|---|---|---|---|---|
| A | 7195 | 5819 | 2 | 2 | 0.03% | 0.03% | 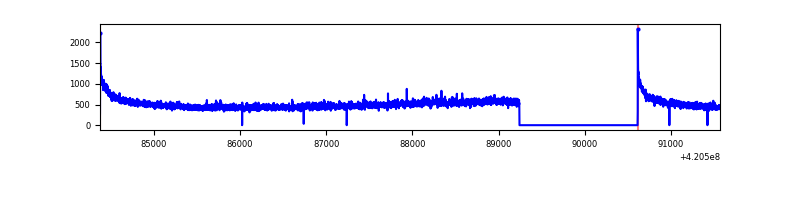 |
| B | 7195 | 5821 | 1 | 1 | 0.01% | 0.02% | 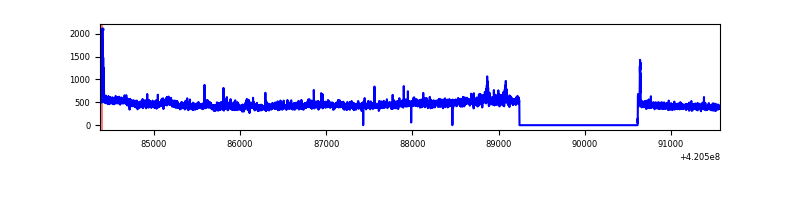 |
| C | 7195 | 5821 | 149 | 149 | 2.07% | 2.56% | 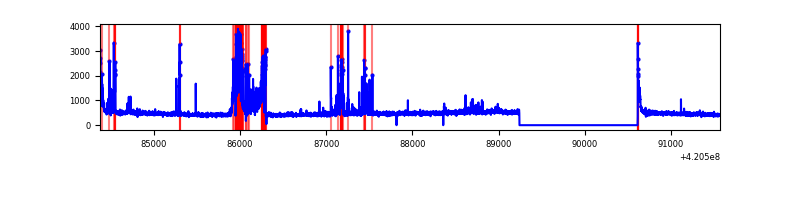 |
| D | 7195 | 5820 | 162 | 162 | 2.25% | 2.78% | 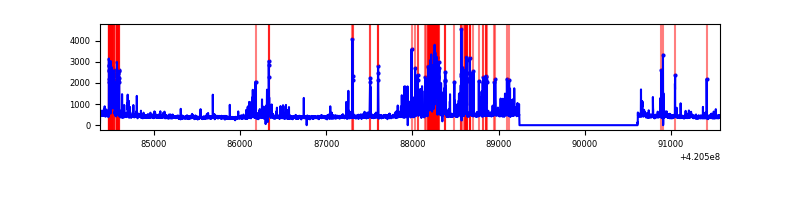 |
Top three noisy pixels from each quadrant. If the there are fewer than three noisy pixels in the level2.evt file, extra rows are filled as -1
| Pixel properties | Quadrant properties | ||||||
|---|---|---|---|---|---|---|---|
| Quadrant | DetID | PixID | Counts | Sigma | Mean | Median | Sigma |
| A | 10 | 83 | 518584 | 4028.28 | 624 | 610 | 128.6 |
| A | 12 | 189 | 42110 | 322.74 | 624 | 610 | 128.6 |
| A | 13 | 254 | 8469 | 61.12 | 624 | 610 | 128.6 |
| B | 0 | 229 | 102385 | 831.8 | 623 | 607 | 122.4 |
| B | 0 | 245 | 86037 | 698.19 | 623 | 607 | 122.4 |
| B | 15 | 32 | 25463 | 203.14 | 623 | 607 | 122.4 |
| C | 14 | 254 | 618700 | 4389.13 | 606 | 610 | 140.8 |
| C | 15 | 214 | 245993 | 1742.49 | 606 | 610 | 140.8 |
| C | 0 | 10 | 71785 | 505.42 | 606 | 610 | 140.8 |
| D | 13 | 249 | 459965 | 3135.14 | 600 | 584 | 146.5 |
| D | 13 | 171 | 190240 | 1294.35 | 600 | 584 | 146.5 |
| D | 12 | 0 | 151749 | 1031.66 | 600 | 584 | 146.5 |
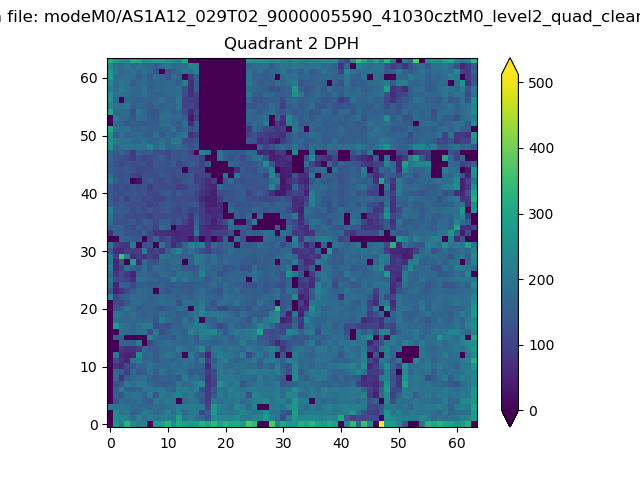
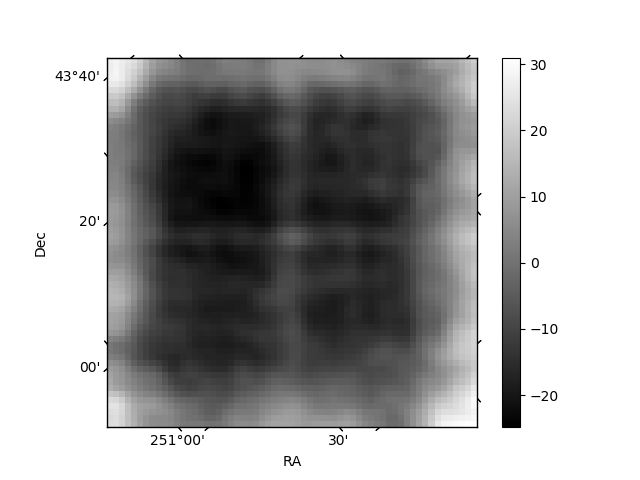
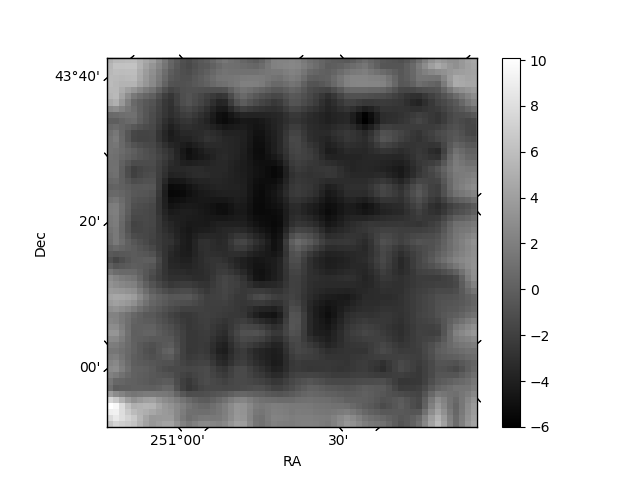
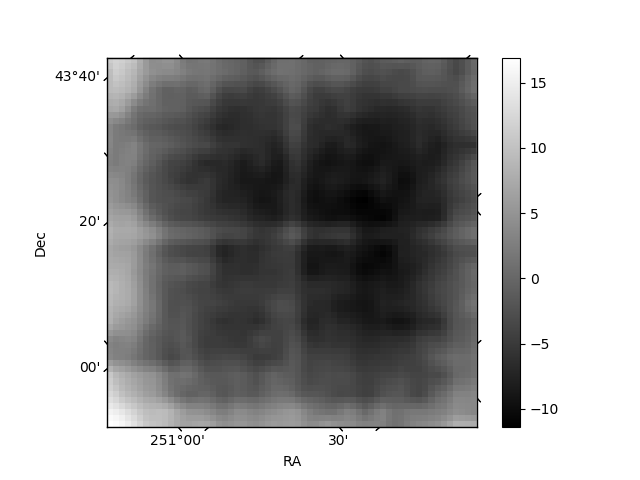
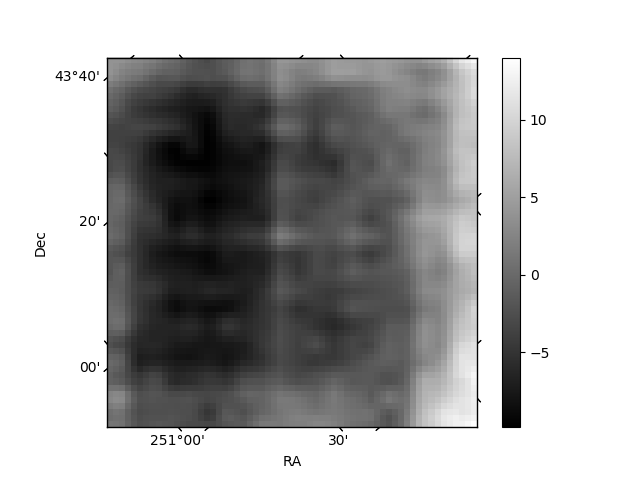
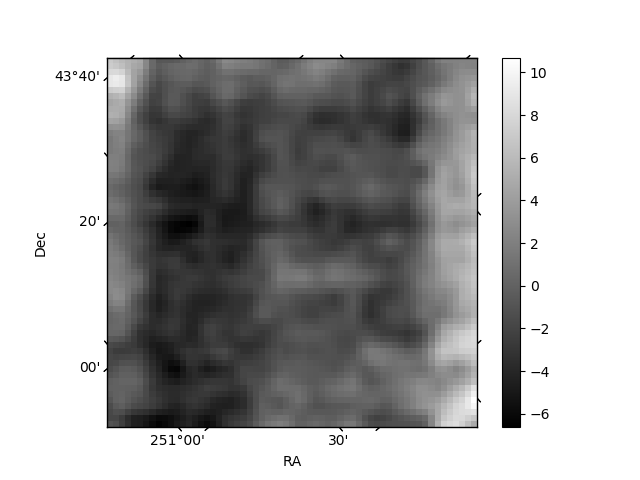
Histogram calculated using DETX and DETY for each event in the final _common_clean file
| Quadrant A | 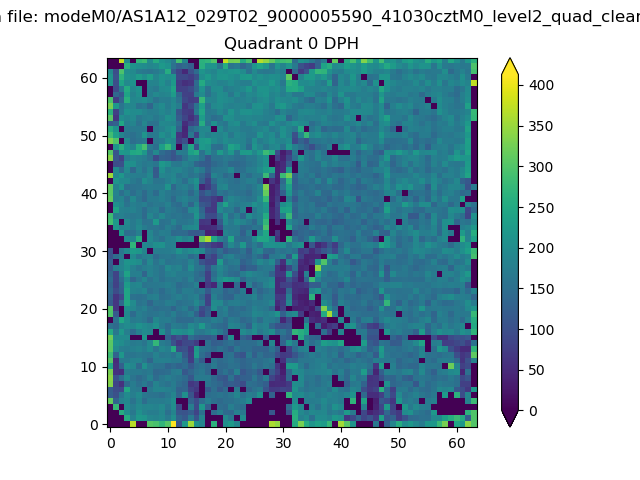 |
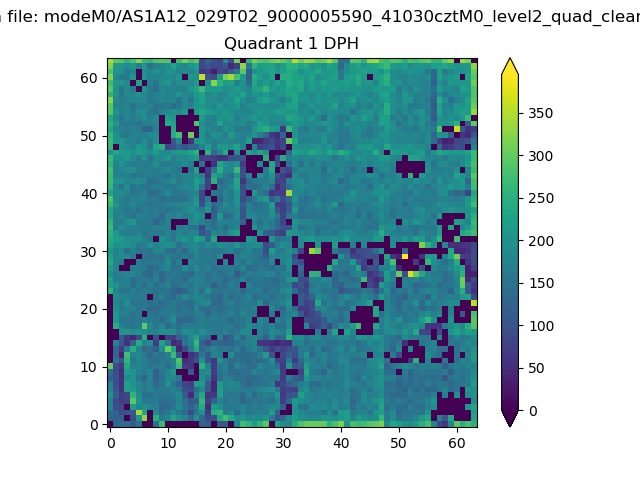 |
Quadrant B |
|---|---|---|---|
| Quadrant D | 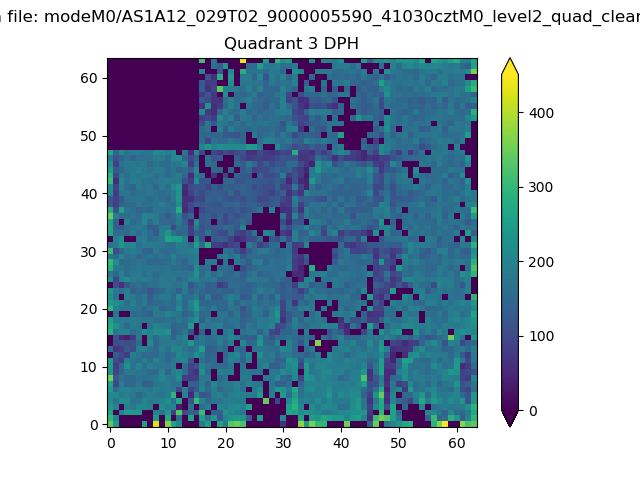 |
 |
Quadrant C |
| Plot type | Count rate plots | Images |
|---|---|---|
| Comparison with Poisson distribution Blue bars denote a histogram of data divided into 1 sec bins. Red curve is a Poisson curve with rate = median count rate of data. |
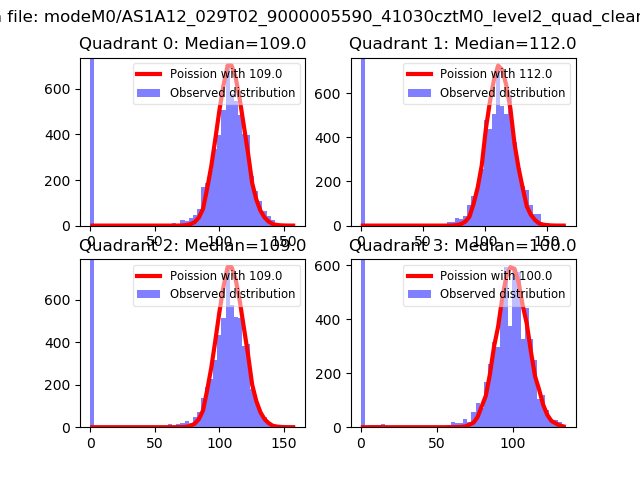 |
 |
| Quadrant-wise count rates Data is divided into 100 sec bins |
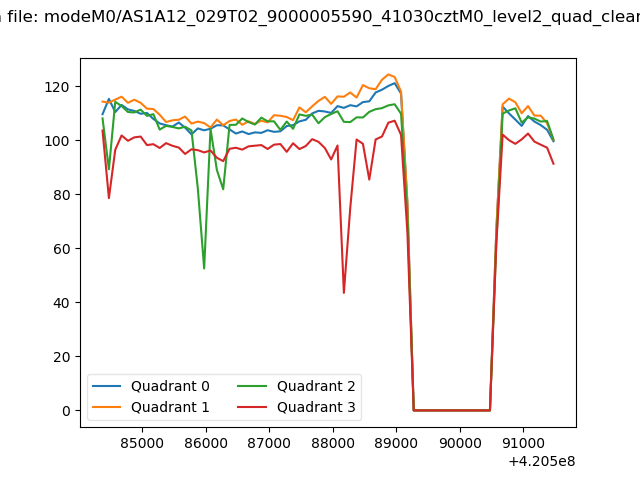 |
|
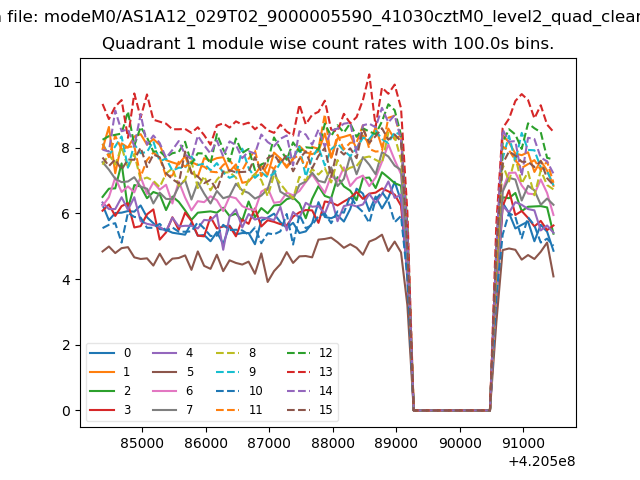
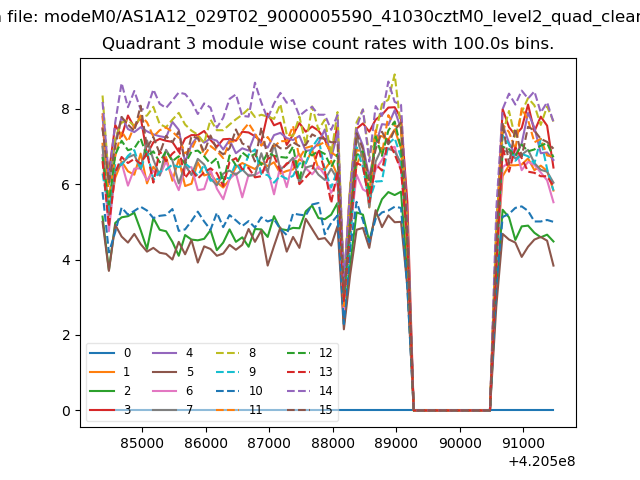
| Module-wise count rates for Quadrant A Data is divided into 100 sec bins |
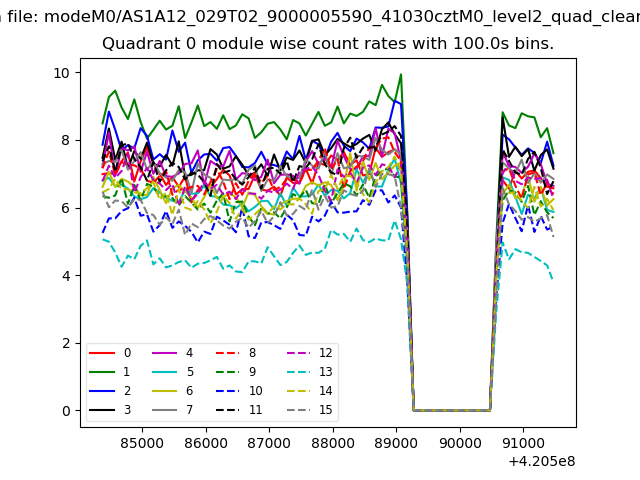 |
 |
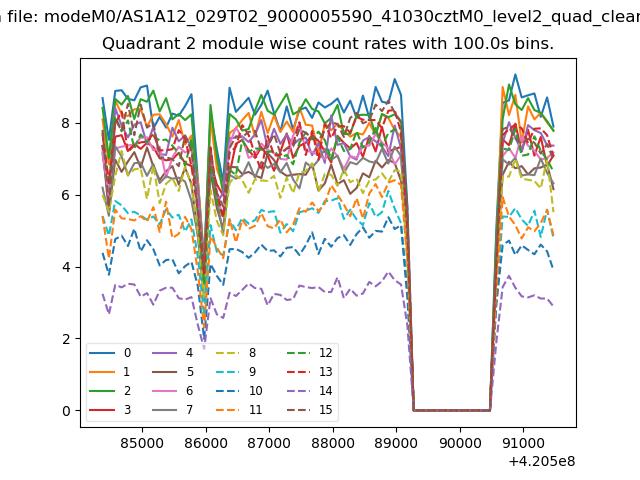
| Module-wise count rates for Quadrant B Data is divided into 100 sec bins |
 |
 |
| Module-wise count rates for Quadrant C Data is divided into 100 sec bins |
 |
 |
| Module-wise count rates for Quadrant D Data is divided into 100 sec bins |
 |
 |
| Parameter | Plot |
|---|---|
| CZT HV Monitor | 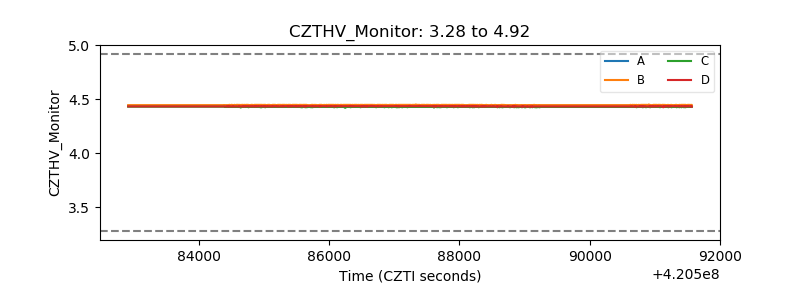 |
| D_VDD | 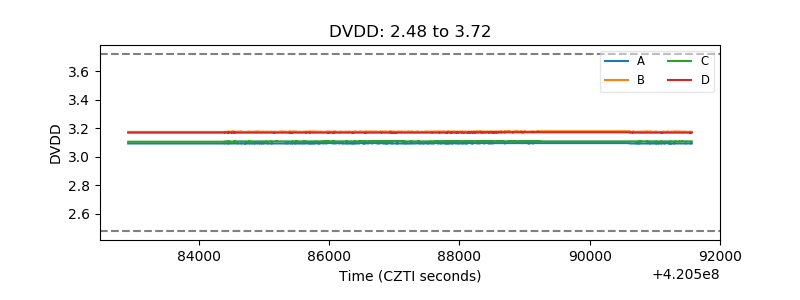 |
| Temperature 1 | 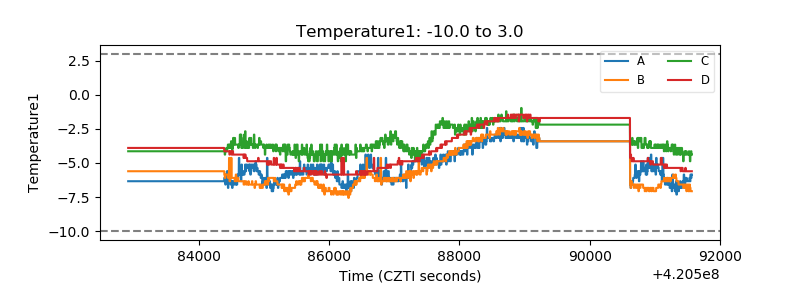 |
| Veto HV Monitor | 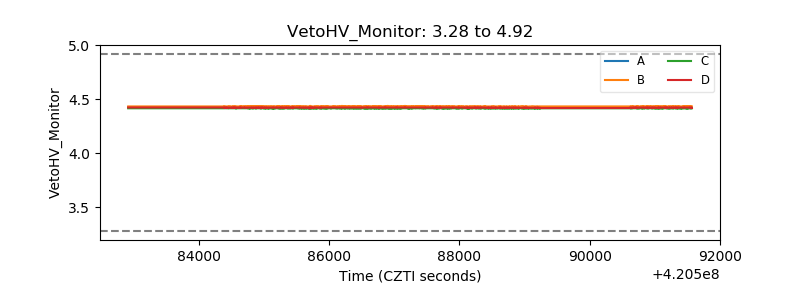 |
| Veto LLD | 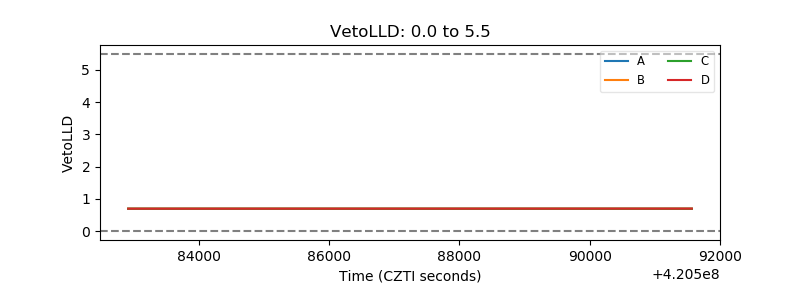 |
| Alpha Counter | 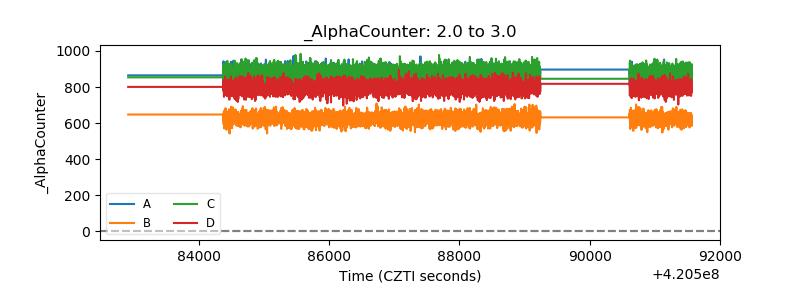 |
| _CPM_Rate | 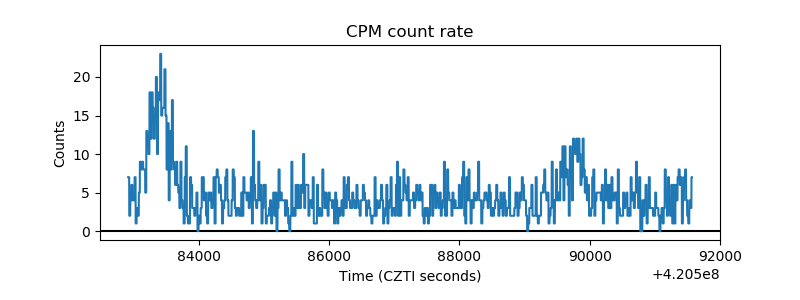 |
| CZT Counter | 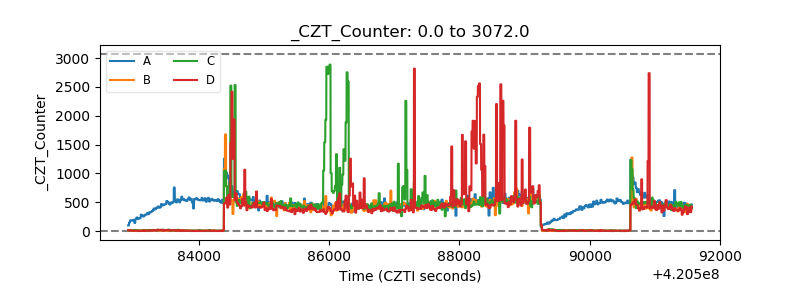 |
| +2.5 Volts monitor | 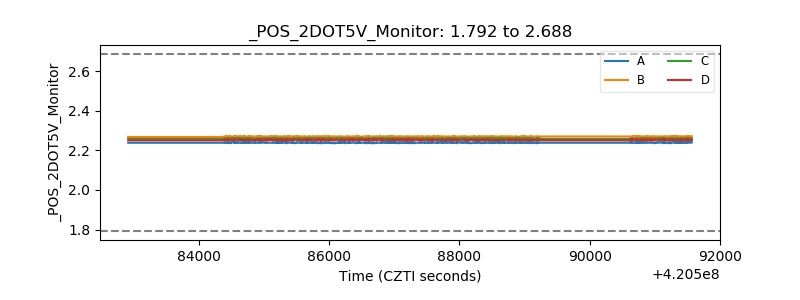 |
| +5 Volts monitor | 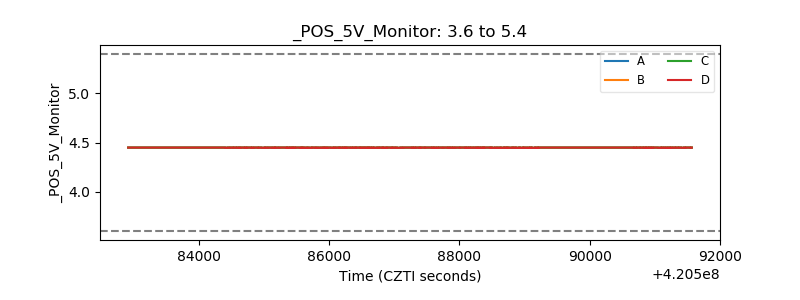 |
| _ROLL_ROT | 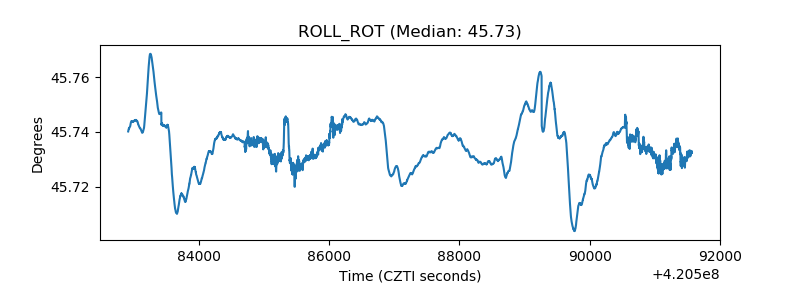 |
| _Roll_DEC | 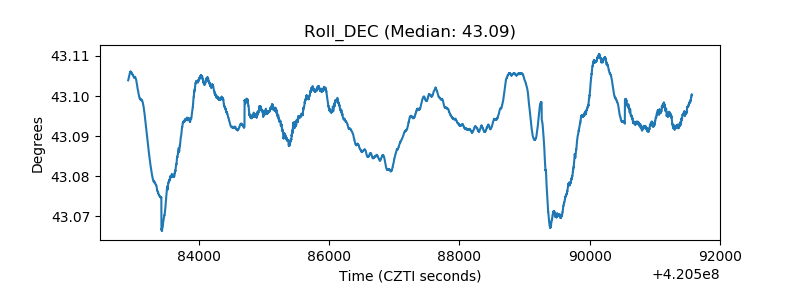 |
| _Roll_RA | 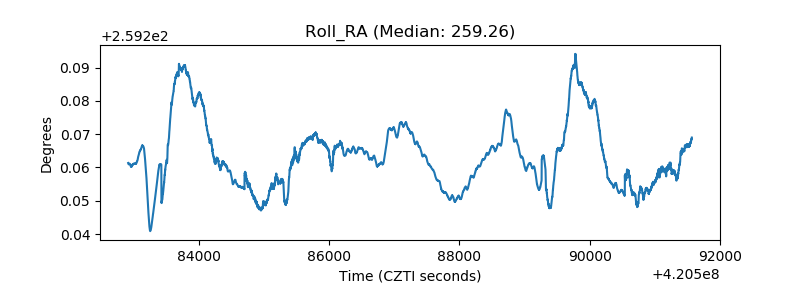 |
| Veto Counter | 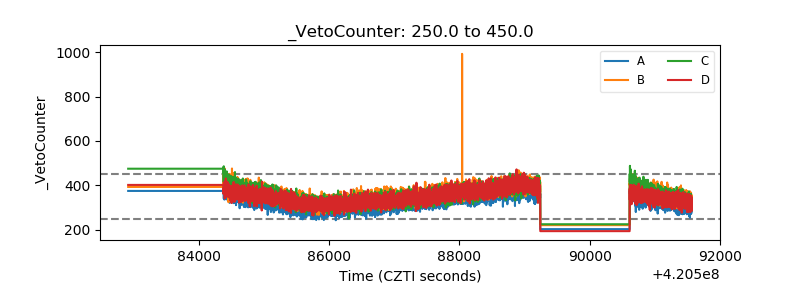 |