| Param | Original file | Final file |
|---|---|---|
| Filename | modeM0/AS1A12_029T02_9000005590_41034cztM0_level2.fits | modeM0/AS1A12_029T02_9000005590_41034cztM0_level2_quad_clean.evt |
| Size (bytes) | 970,081,920 | 256,279,680 |
| Size | 925.1 MB | 244.4 MB |
| Events in quadrant A | 10,631,517 | 1,701,134 |
| Events in quadrant B | 7,147,326 | 1,759,089 |
| Events in quadrant C | 7,983,117 | 1,685,994 |
| Events in quadrant D | 8,915,759 | 1,515,881 |
| Mode SS | |||
|---|---|---|---|
| Quadrant | BADHDUFLAG | Total packets | Discarded packets |
| A | 0 | 328 | 0 |
| B | 0 | 328 | 0 |
| C | 0 | 328 | 0 |
| D | 0 | 328 | 0 |
| Mode M0 | |||
|---|---|---|---|
| Quadrant | BADHDUFLAG | Total packets | Discarded packets |
| A | 0 | 42190 | 5 |
| B | 0 | 32331 | 4 |
| C | 0 | 33888 | 4 |
| D | 0 | 37976 | 4 |
| Mode M9 | |||
|---|---|---|---|
| Quadrant | BADHDUFLAG | Total packets | Discarded packets |
| A | 0 | 55 | 0 |
| B | 0 | 55 | 0 |
| C | 0 | 55 | 0 |
| D | 0 | 55 | 0 |
| Quadrant | Total seconds | Saturated seconds | Saturation percentage |
|---|---|---|---|
| A | 15900 | 62 | 0.389937% |
| B | 15900 | 23 | 0.144654% |
| C | 15900 | 81 | 0.509434% |
| D | 15900 | 442 | 2.779874% |
Noise dominated data is calculated using 1-second bins in cleaned event files. If a bin has >2000 counts, and if more than 50% of those come from <1% of pixels, then it is considered to be noise-dominated and hence unusable.
| Quadrant | # 1 sec bins | Bins with >0 counts | Bins with >2000 counts | High rate bins dominated by noise | Noise dominated (total time) | Noise dominated (detector-on time) | Marked lightcurve |
|---|---|---|---|---|---|---|---|
| A | 21422 | 15904 | 19 | 19 | 0.09% | 0.12% | 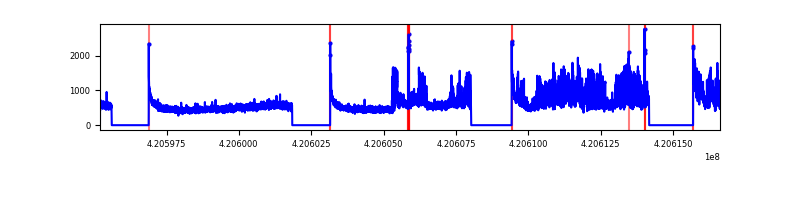 |
| B | 21422 | 15904 | 0 | 0 | 0.00% | 0.00% | 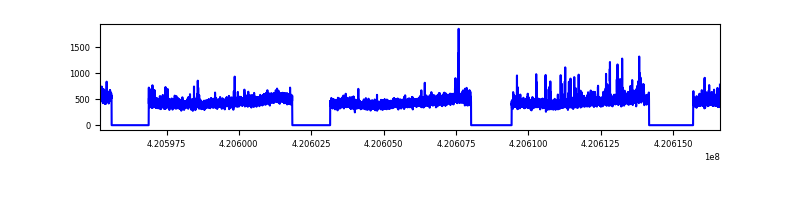 |
| C | 21422 | 15904 | 74 | 74 | 0.35% | 0.47% | 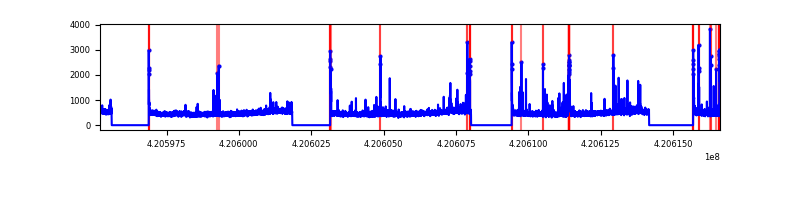 |
| D | 21422 | 15904 | 375 | 375 | 1.75% | 2.36% | 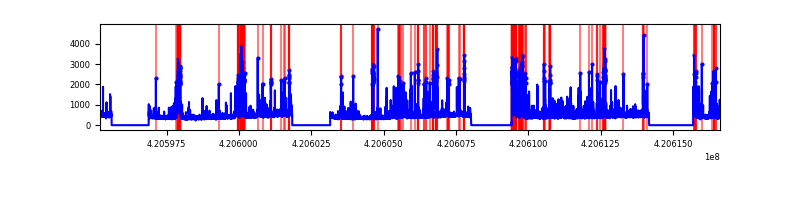 |
Top three noisy pixels from each quadrant. If the there are fewer than three noisy pixels in the level2.evt file, extra rows are filled as -1
| Pixel properties | Quadrant properties | ||||||
|---|---|---|---|---|---|---|---|
| Quadrant | DetID | PixID | Counts | Sigma | Mean | Median | Sigma |
| A | 12 | 189 | 2487874 | 6999.78 | 1750 | 1715 | 355.2 |
| A | 10 | 83 | 1315736 | 3699.63 | 1750 | 1715 | 355.2 |
| A | 13 | 248 | 27362 | 72.21 | 1750 | 1715 | 355.2 |
| B | 0 | 190 | 176333 | 515.55 | 1741 | 1691 | 338.7 |
| B | 0 | 229 | 110807 | 322.11 | 1741 | 1691 | 338.7 |
| B | 12 | 111 | 44745 | 127.1 | 1741 | 1691 | 338.7 |
| C | 15 | 214 | 673497 | 1692.16 | 1710 | 1717 | 397.0 |
| C | 14 | 254 | 373299 | 935.98 | 1710 | 1717 | 397.0 |
| C | 12 | 249 | 128323 | 318.91 | 1710 | 1717 | 397.0 |
| D | 13 | 249 | 1543345 | 3731.06 | 1695 | 1647 | 413.2 |
| D | 2 | 249 | 389199 | 937.91 | 1695 | 1647 | 413.2 |
| D | 9 | 19 | 195826 | 469.93 | 1695 | 1647 | 413.2 |
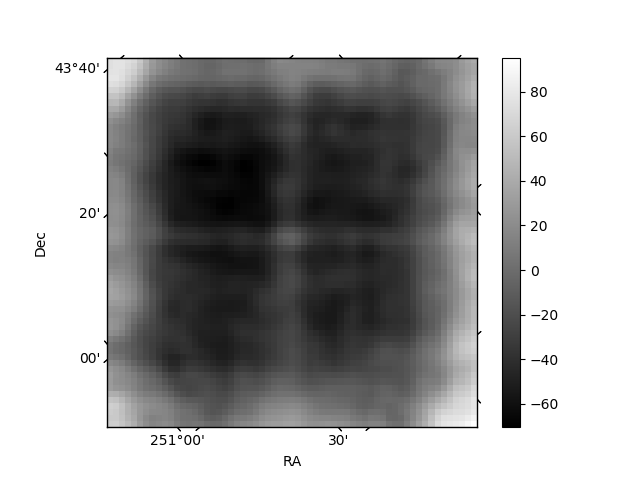
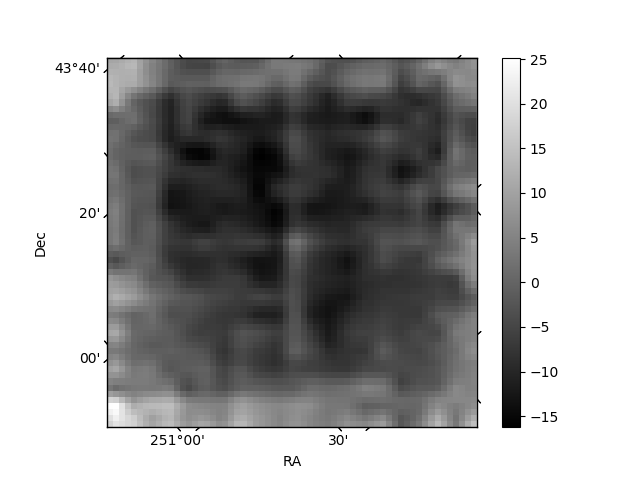
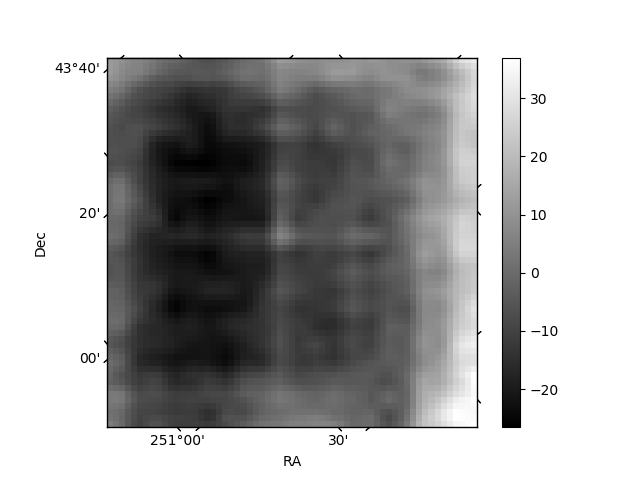
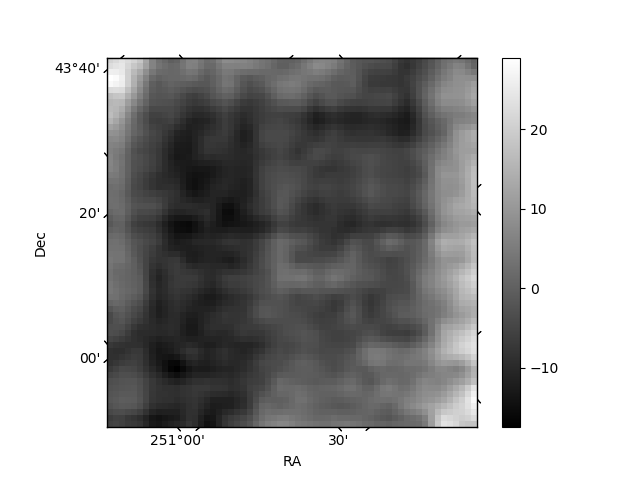
Histogram calculated using DETX and DETY for each event in the final _common_clean file
| Quadrant A | 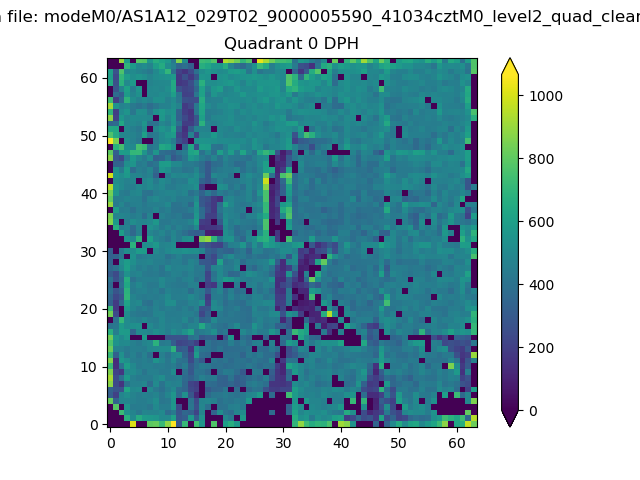 |
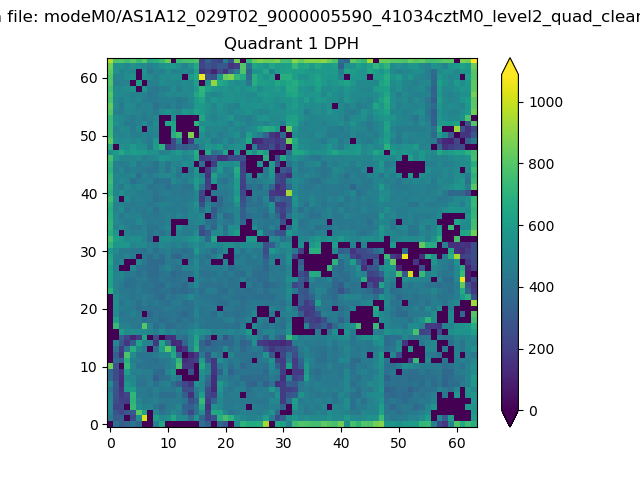 |
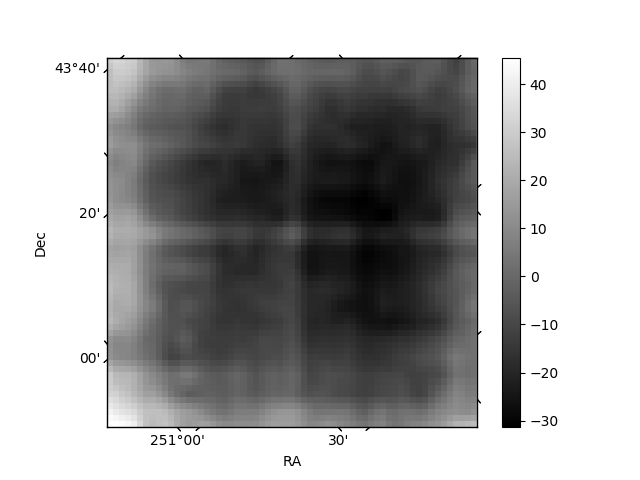
Quadrant B |
|---|---|---|---|
| Quadrant D | 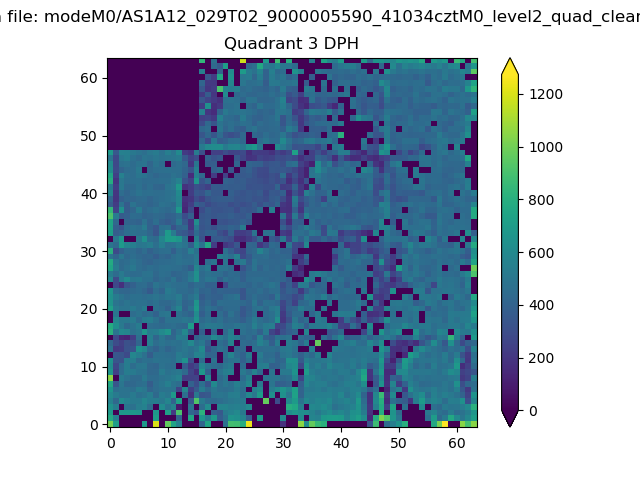 |
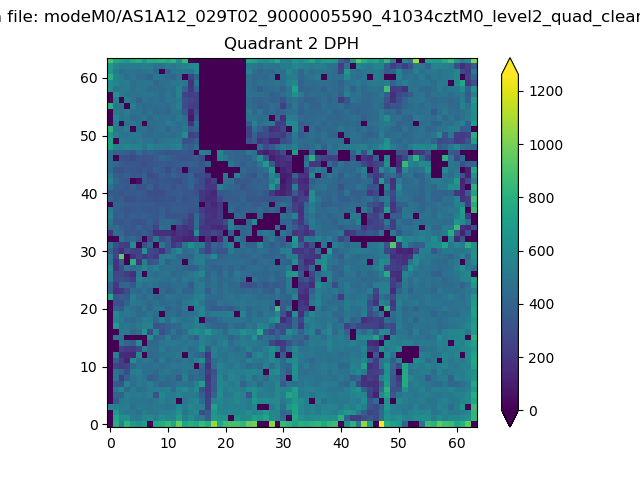 |
Quadrant C |
| Plot type | Count rate plots | Images |
|---|---|---|
| Comparison with Poisson distribution Blue bars denote a histogram of data divided into 1 sec bins. Red curve is a Poisson curve with rate = median count rate of data. |
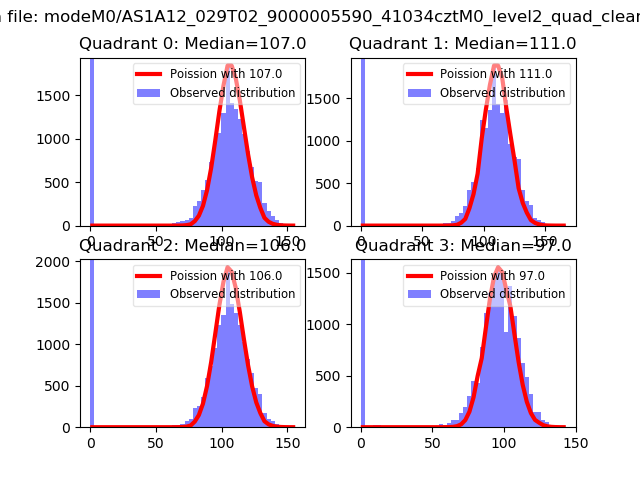 |
 |
| Quadrant-wise count rates Data is divided into 100 sec bins |
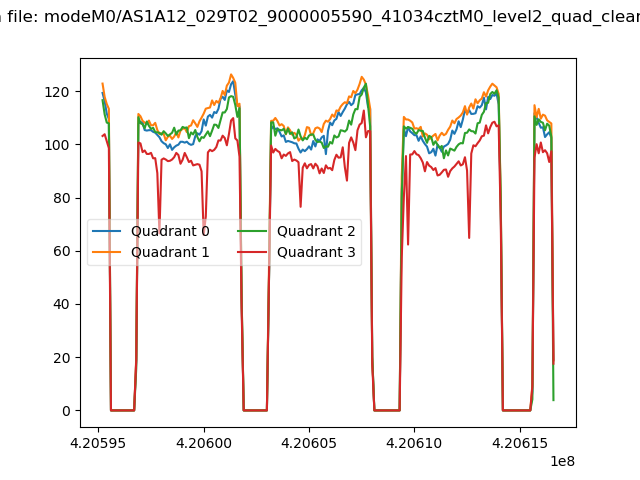 |
|
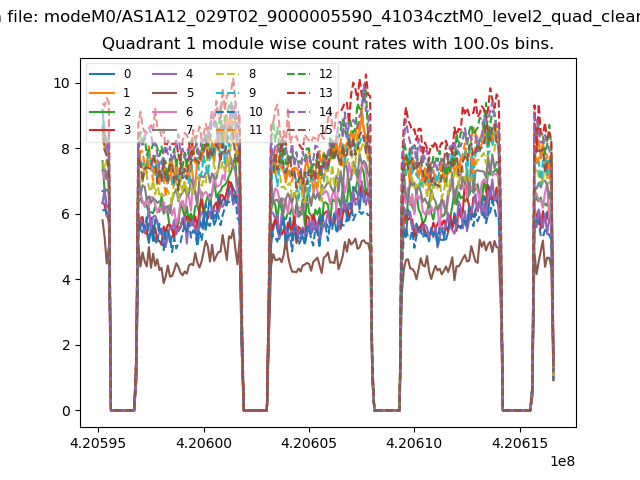
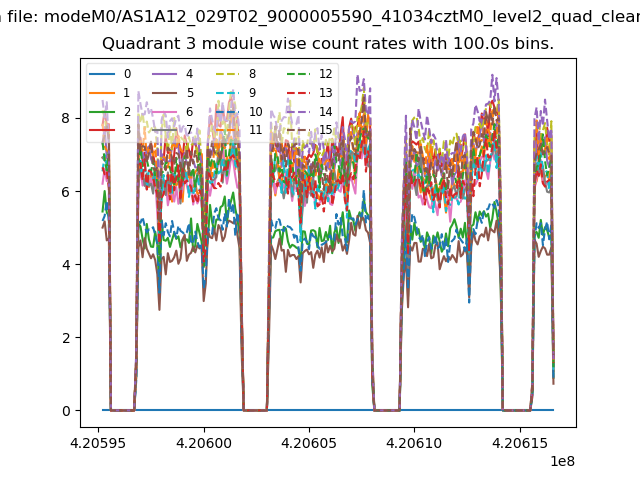
| Module-wise count rates for Quadrant A Data is divided into 100 sec bins |
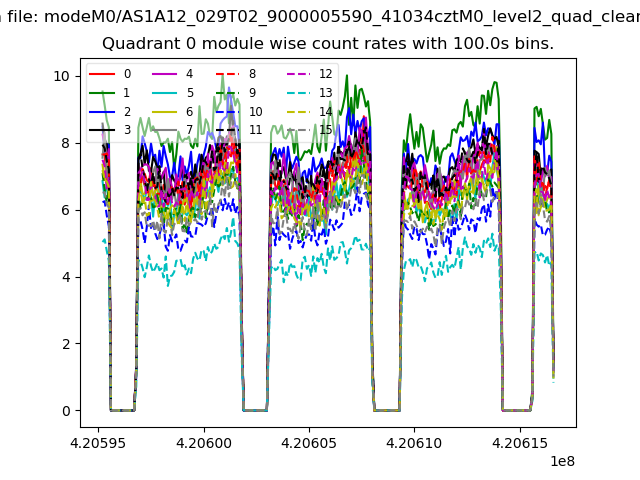 |
 |
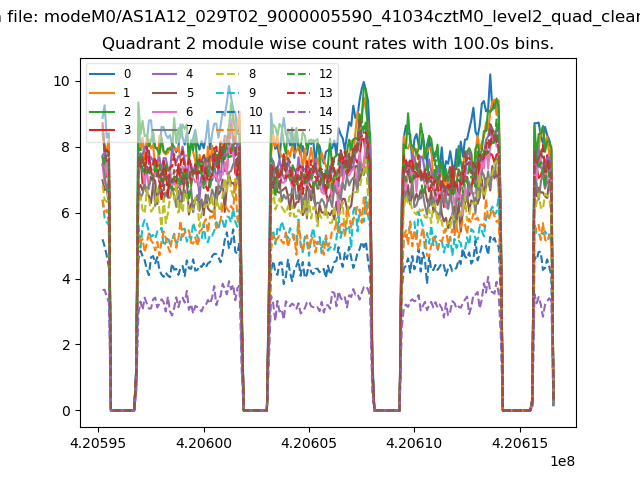
| Module-wise count rates for Quadrant B Data is divided into 100 sec bins |
 |
 |
| Module-wise count rates for Quadrant C Data is divided into 100 sec bins |
 |
 |
| Module-wise count rates for Quadrant D Data is divided into 100 sec bins |
 |
 |
| Parameter | Plot |
|---|---|
| CZT HV Monitor | 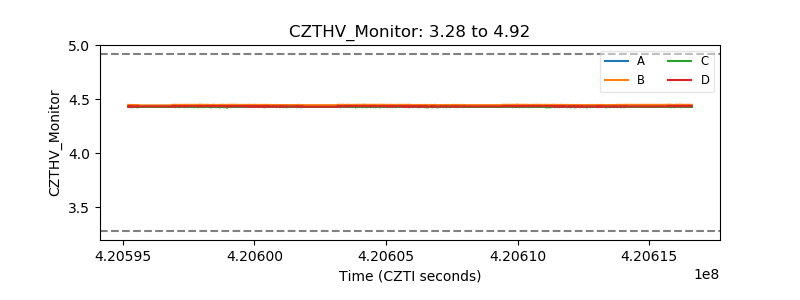 |
| D_VDD | 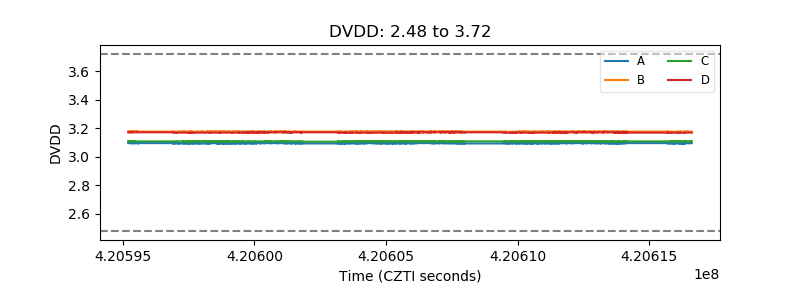 |
| Temperature 1 | 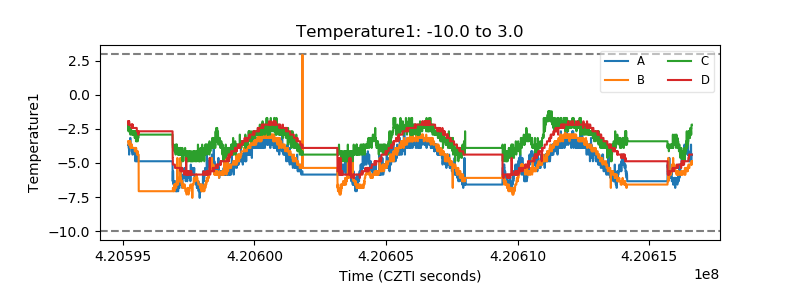 |
| Veto HV Monitor | 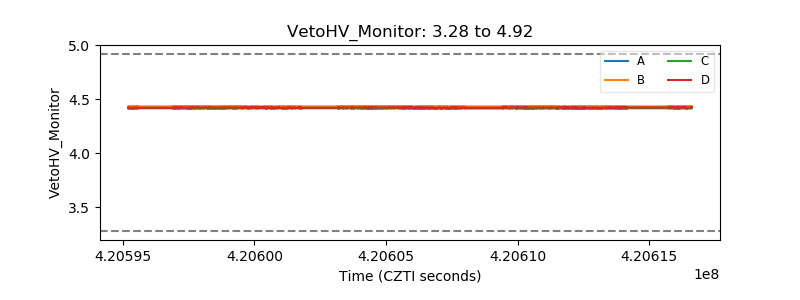 |
| Veto LLD | 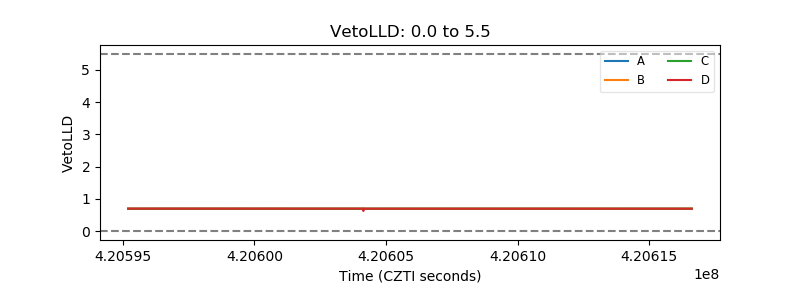 |
| Alpha Counter | 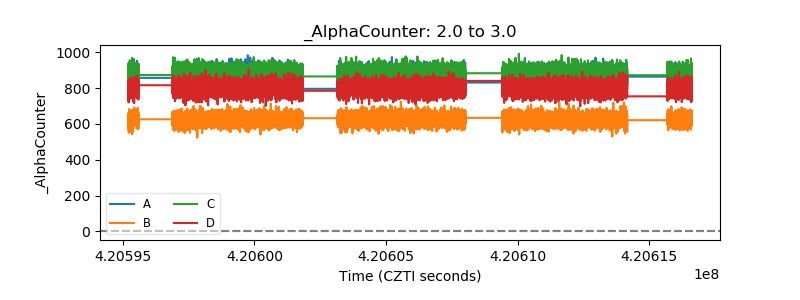 |
| _CPM_Rate |  |
| CZT Counter | 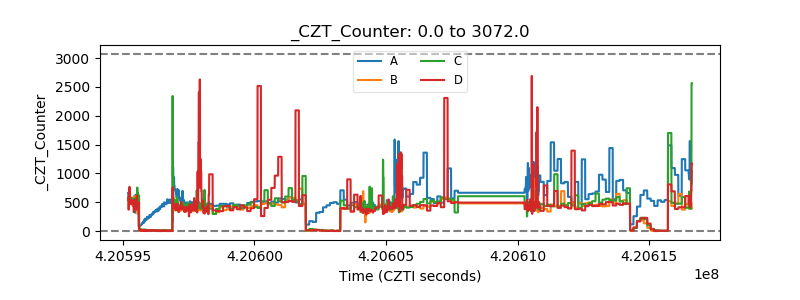 |
| +2.5 Volts monitor | 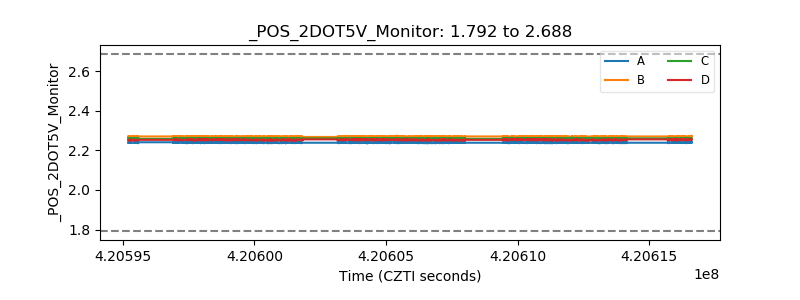 |
| +5 Volts monitor | 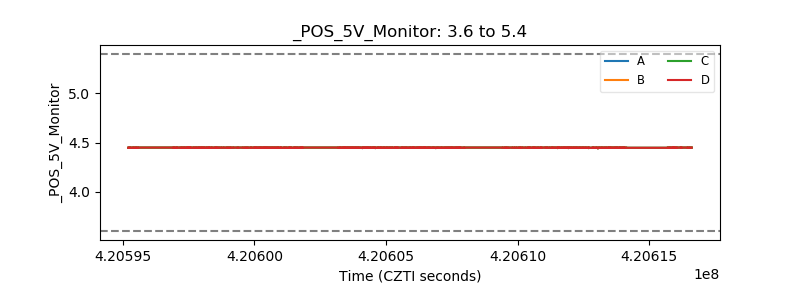 |
| _ROLL_ROT | 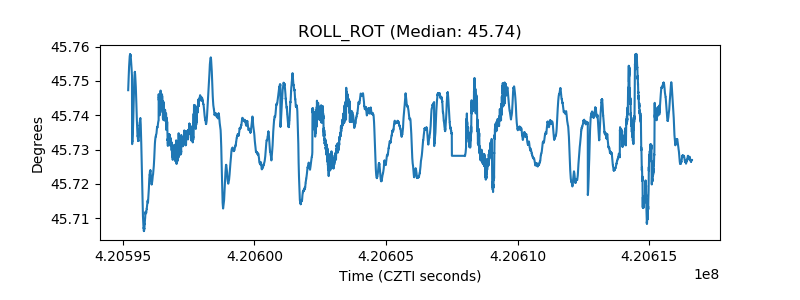 |
| _Roll_DEC | 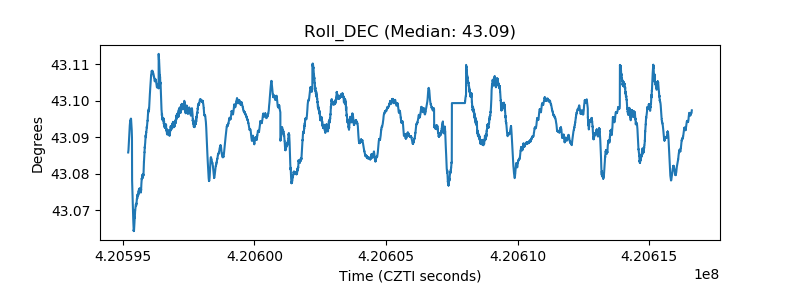 |
| _Roll_RA | 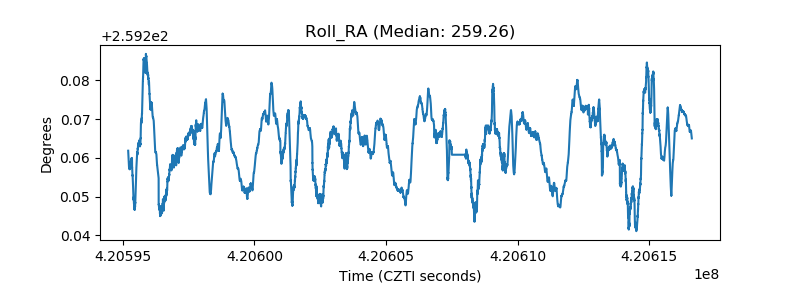 |
| Veto Counter | 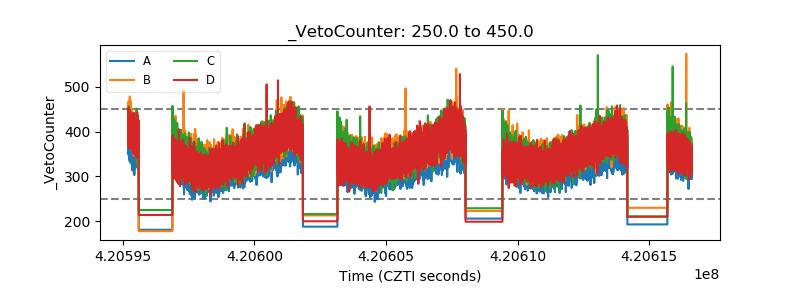 |