| Param | Original file | Final file |
|---|---|---|
| Filename | modeM0/AS1A12_029T02_9000005590_41035cztM0_level2.fits | modeM0/AS1A12_029T02_9000005590_41035cztM0_level2_quad_clean.evt |
| Size (bytes) | 367,496,640 | 87,292,800 |
| Size | 350.5 MB | 83.2 MB |
| Events in quadrant A | 4,244,816 | 584,147 |
| Events in quadrant B | 2,791,338 | 595,282 |
| Events in quadrant C | 3,183,564 | 564,723 |
| Events in quadrant D | 2,966,585 | 523,259 |
| Mode SS | |||
|---|---|---|---|
| Quadrant | BADHDUFLAG | Total packets | Discarded packets |
| A | 0 | 110 | 0 |
| B | 0 | 110 | 0 |
| C | 0 | 110 | 0 |
| D | 0 | 110 | 0 |
| Mode M0 | |||
|---|---|---|---|
| Quadrant | BADHDUFLAG | Total packets | Discarded packets |
| A | 0 | 16239 | 2 |
| B | 0 | 11848 | 1 |
| C | 0 | 12865 | 1 |
| D | 0 | 12630 | 1 |
| Mode M9 | |||
|---|---|---|---|
| Quadrant | BADHDUFLAG | Total packets | Discarded packets |
| A | 0 | 17 | 0 |
| B | 0 | 17 | 0 |
| C | 0 | 17 | 0 |
| D | 0 | 17 | 0 |
| Quadrant | Total seconds | Saturated seconds | Saturation percentage |
|---|---|---|---|
| A | 5365 | 34 | 0.633737% |
| B | 5365 | 94 | 1.752097% |
| C | 5365 | 150 | 2.795899% |
| D | 5365 | 85 | 1.584343% |
Noise dominated data is calculated using 1-second bins in cleaned event files. If a bin has >2000 counts, and if more than 50% of those come from <1% of pixels, then it is considered to be noise-dominated and hence unusable.
| Quadrant | # 1 sec bins | Bins with >0 counts | Bins with >2000 counts | High rate bins dominated by noise | Noise dominated (total time) | Noise dominated (detector-on time) | Marked lightcurve |
|---|---|---|---|---|---|---|---|
| A | 7038 | 5366 | 4 | 4 | 0.06% | 0.07% | 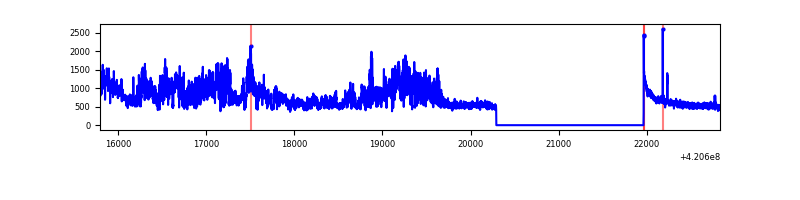 |
| B | 7038 | 5366 | 56 | 56 | 0.80% | 1.04% | 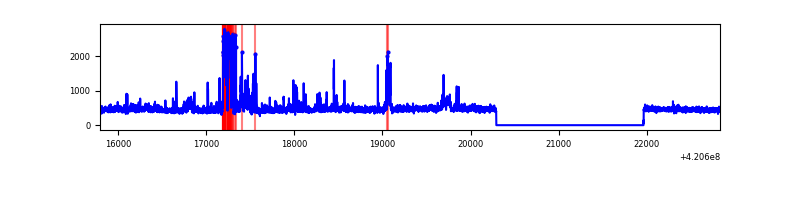 |
| C | 7038 | 5366 | 145 | 145 | 2.06% | 2.70% | 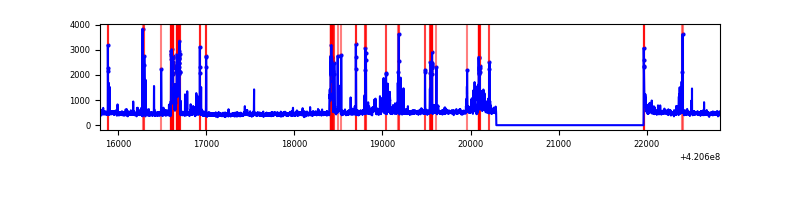 |
| D | 7038 | 5366 | 64 | 64 | 0.91% | 1.19% | 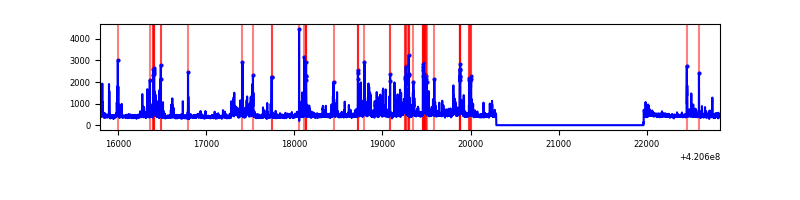 |
Top three noisy pixels from each quadrant. If the there are fewer than three noisy pixels in the level2.evt file, extra rows are filled as -1
| Pixel properties | Quadrant properties | ||||||
|---|---|---|---|---|---|---|---|
| Quadrant | DetID | PixID | Counts | Sigma | Mean | Median | Sigma |
| A | 12 | 189 | 1458932 | 11900.72 | 596 | 584 | 122.5 |
| A | 10 | 83 | 457554 | 3729.06 | 596 | 584 | 122.5 |
| A | 2 | 79 | 22834 | 181.57 | 596 | 584 | 122.5 |
| B | 0 | 229 | 266415 | 2311.4 | 589 | 572 | 115.0 |
| B | 0 | 190 | 210310 | 1823.59 | 589 | 572 | 115.0 |
| B | 12 | 111 | 14909 | 124.65 | 589 | 572 | 115.0 |
| C | 14 | 254 | 639055 | 4733.56 | 575 | 579 | 134.9 |
| C | 15 | 214 | 230747 | 1706.43 | 575 | 579 | 134.9 |
| C | 12 | 249 | 42945 | 314.09 | 575 | 579 | 134.9 |
| D | 2 | 249 | 441700 | 3092.99 | 580 | 563 | 142.6 |
| D | 13 | 249 | 136686 | 954.41 | 580 | 563 | 142.6 |
| D | 2 | 153 | 60429 | 419.74 | 580 | 563 | 142.6 |
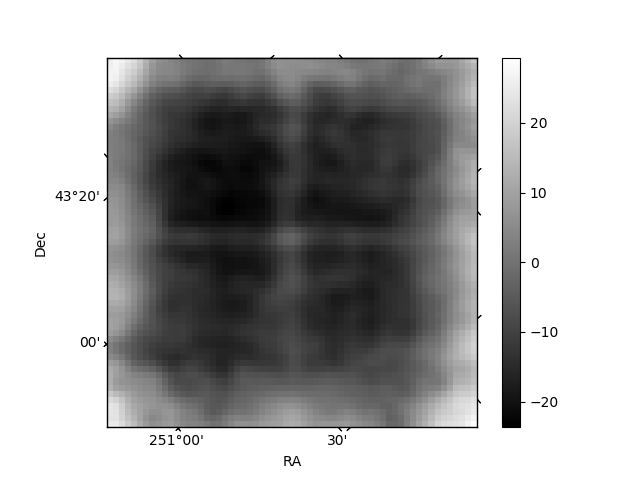
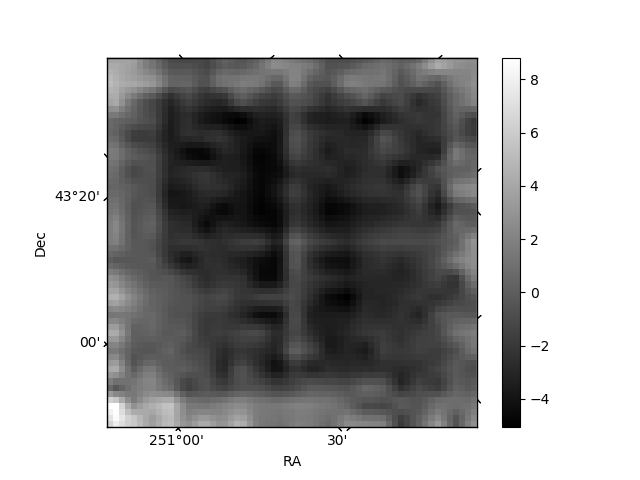
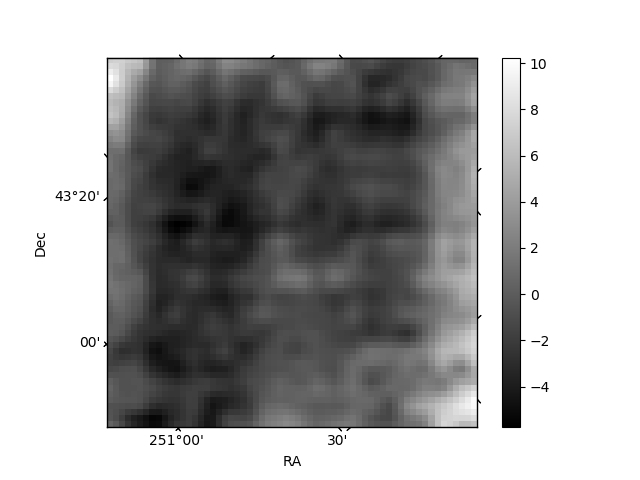
Histogram calculated using DETX and DETY for each event in the final _common_clean file
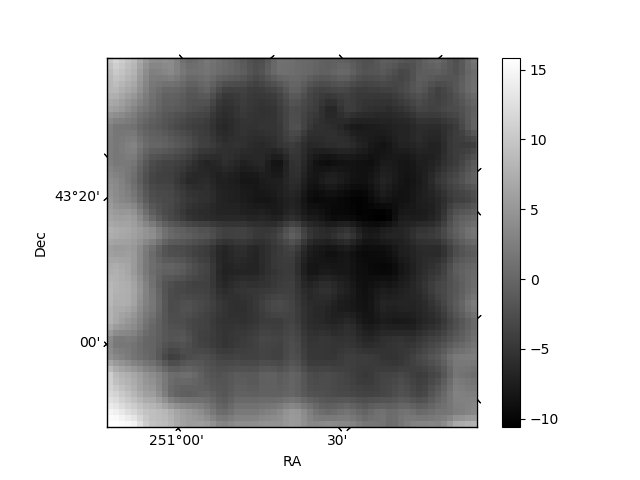
| Quadrant A | 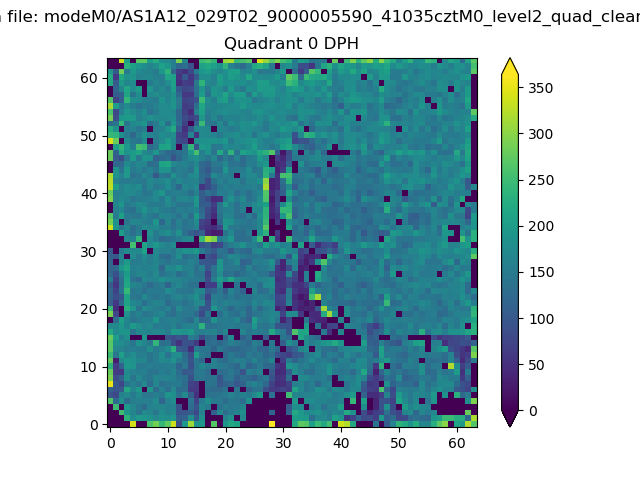 |
 |
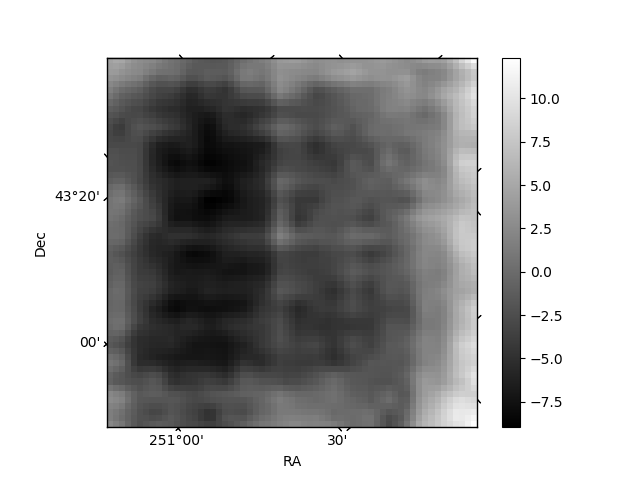
Quadrant B |
|---|---|---|---|
| Quadrant D | 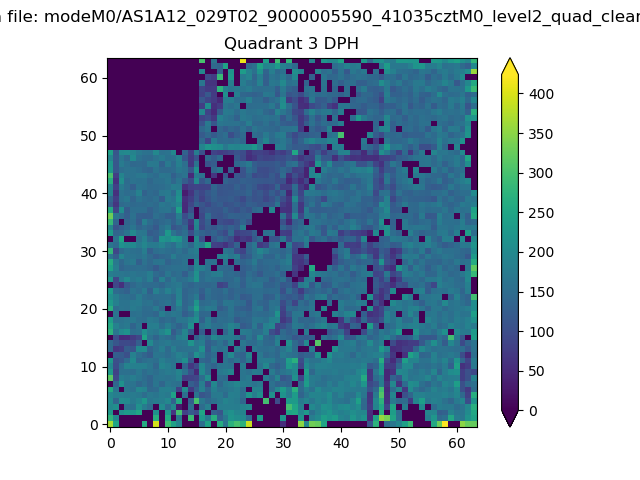 |
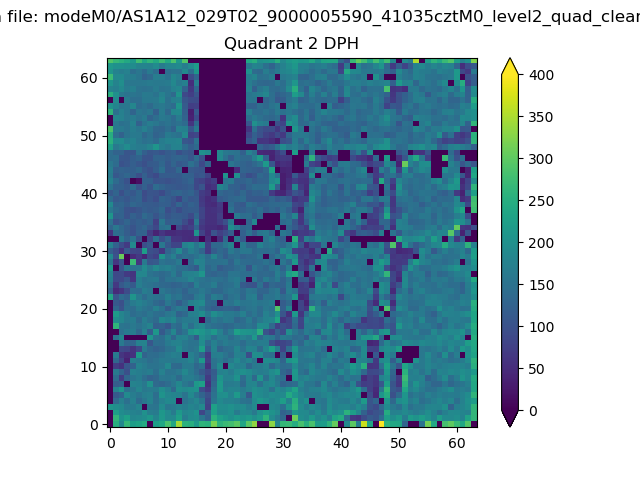 |
Quadrant C |
| Plot type | Count rate plots | Images |
|---|---|---|
| Comparison with Poisson distribution Blue bars denote a histogram of data divided into 1 sec bins. Red curve is a Poisson curve with rate = median count rate of data. |
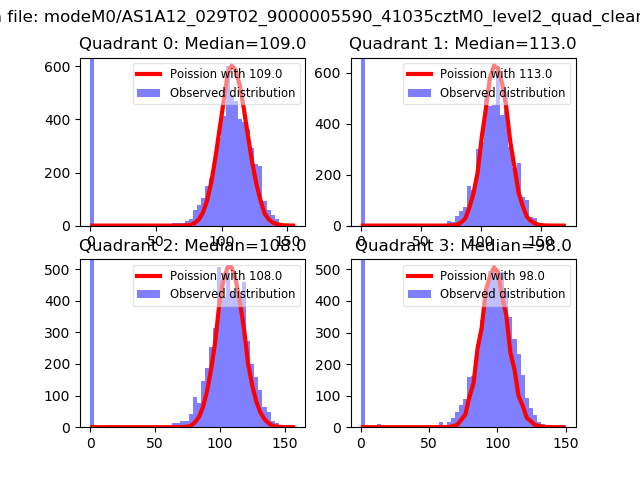 |
 |
| Quadrant-wise count rates Data is divided into 100 sec bins |
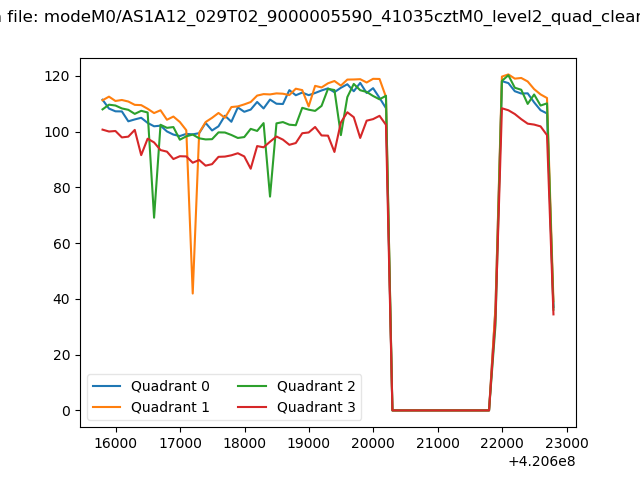 |
|
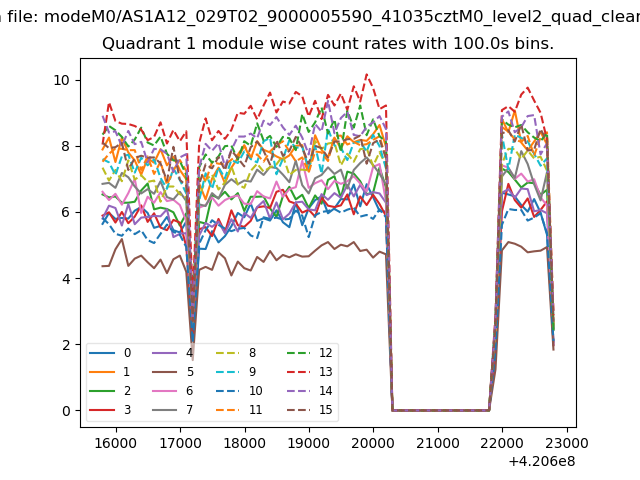
| Module-wise count rates for Quadrant A Data is divided into 100 sec bins |
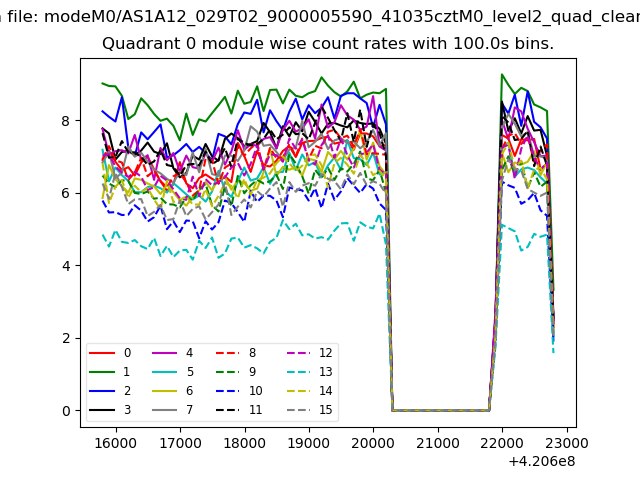 |
 |
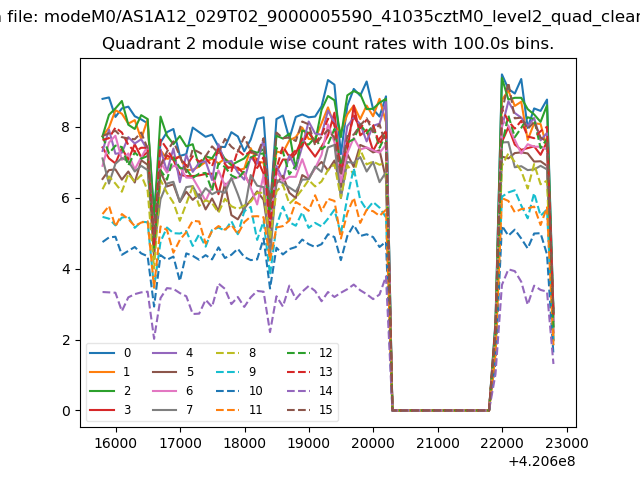
| Module-wise count rates for Quadrant B Data is divided into 100 sec bins |
 |
 |
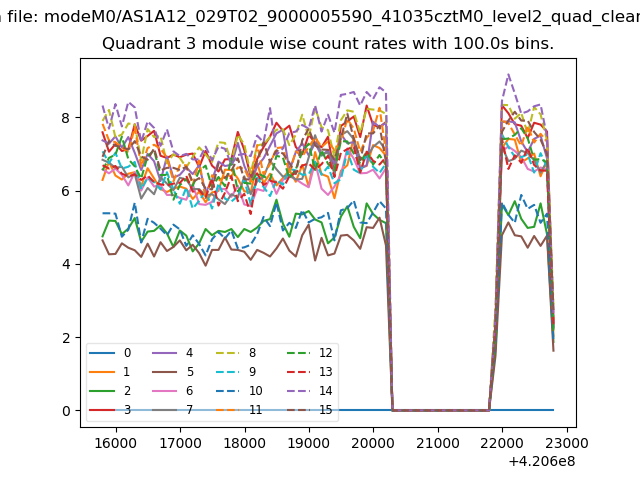
| Module-wise count rates for Quadrant C Data is divided into 100 sec bins |
 |
 |
| Module-wise count rates for Quadrant D Data is divided into 100 sec bins |
 |
 |
| Parameter | Plot |
|---|---|
| CZT HV Monitor | 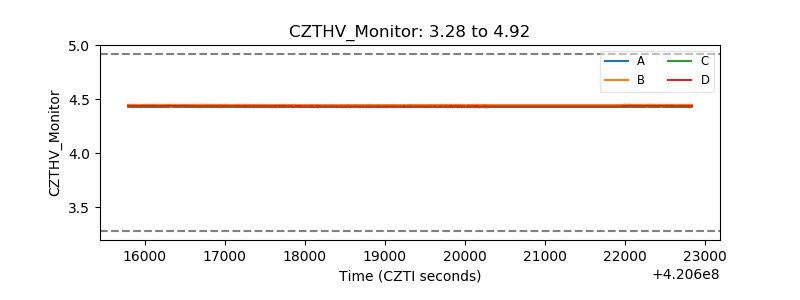 |
| D_VDD | 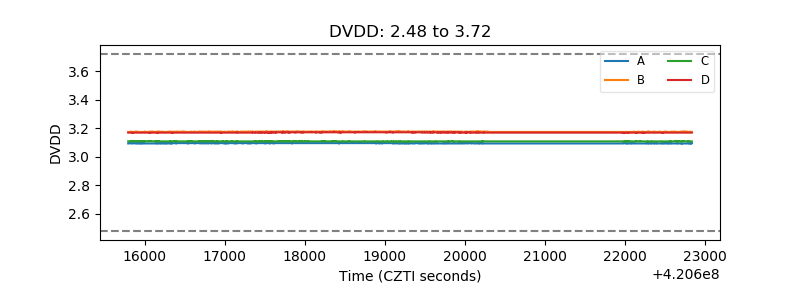 |
| Temperature 1 | 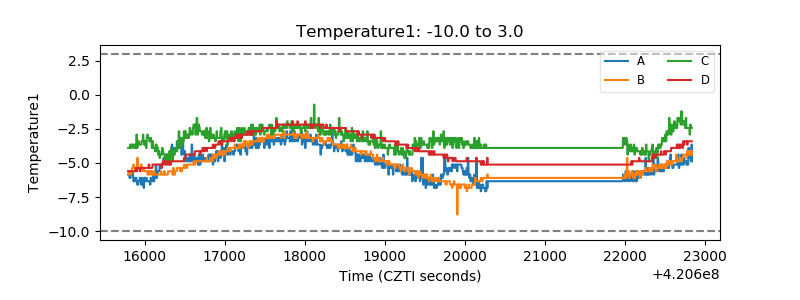 |
| Veto HV Monitor | 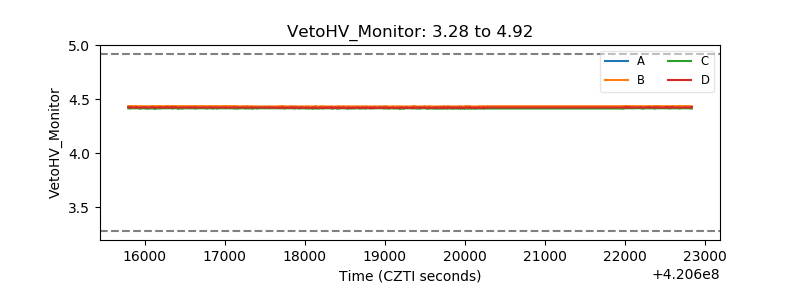 |
| Veto LLD | 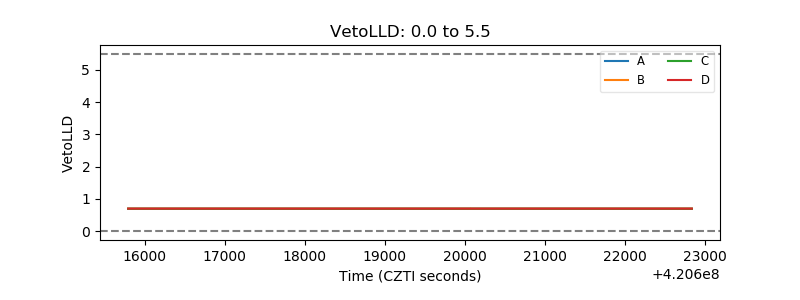 |
| Alpha Counter | 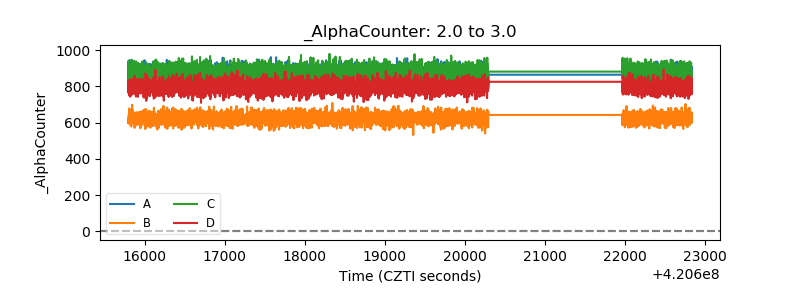 |
| _CPM_Rate |  |
| CZT Counter | 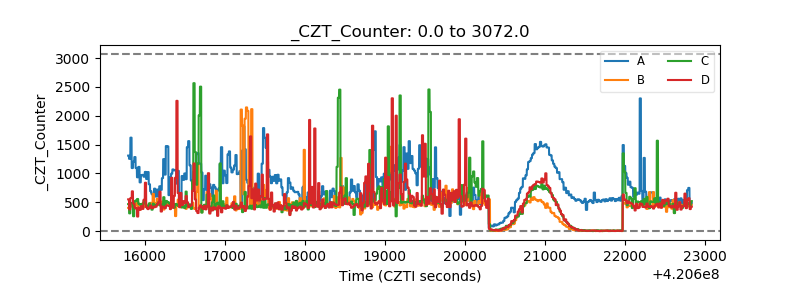 |
| +2.5 Volts monitor |  |
| +5 Volts monitor | 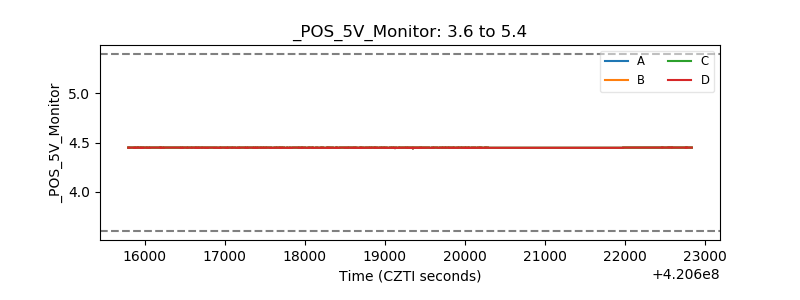 |
| _ROLL_ROT | 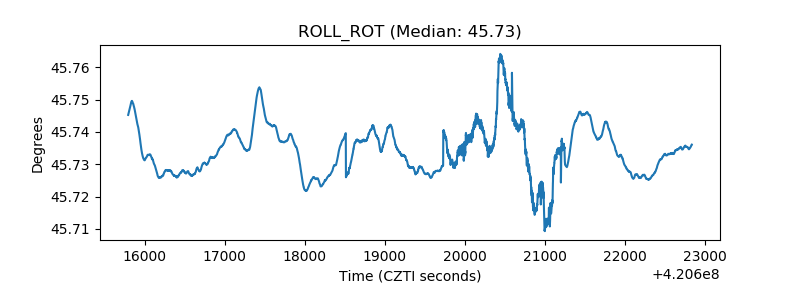 |
| _Roll_DEC | 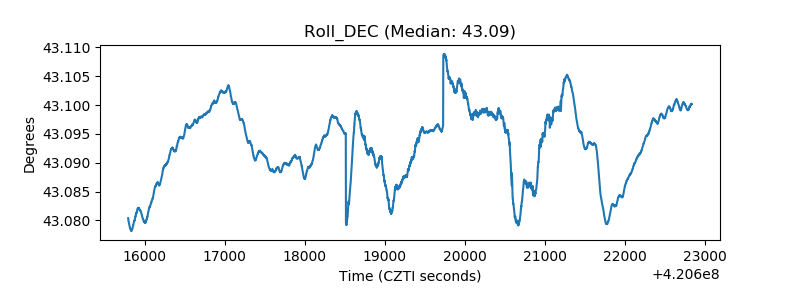 |
| _Roll_RA | 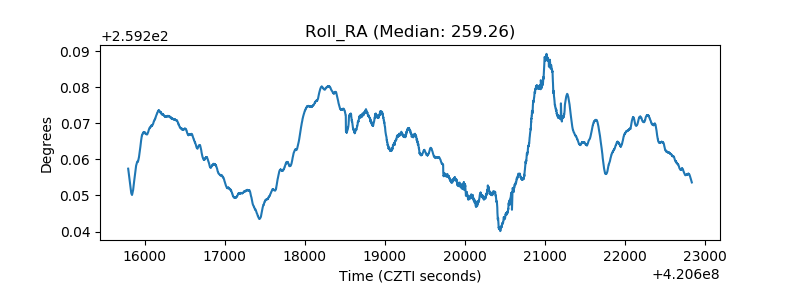 |
| Veto Counter | 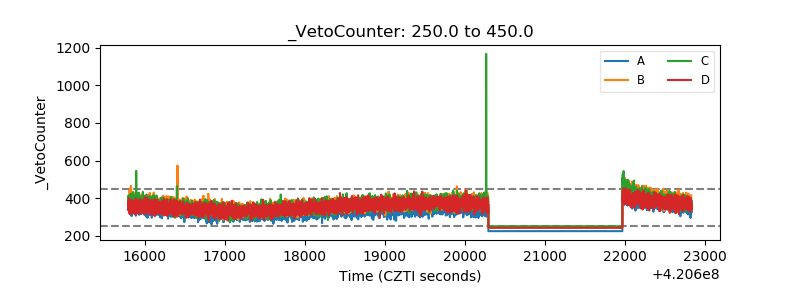 |