| Param | Original file | Final file |
|---|---|---|
| Filename | modeM0/AS1A12_029T02_9000005590_41037cztM0_level2.fits | modeM0/AS1A12_029T02_9000005590_41037cztM0_level2_quad_clean.evt |
| Size (bytes) | 328,271,040 | 92,687,040 |
| Size | 313.1 MB | 88.4 MB |
| Events in quadrant A | 2,944,007 | 625,136 |
| Events in quadrant B | 2,513,981 | 642,596 |
| Events in quadrant C | 2,937,070 | 604,447 |
| Events in quadrant D | 3,328,320 | 549,532 |
| Mode SS | |||
|---|---|---|---|
| Quadrant | BADHDUFLAG | Total packets | Discarded packets |
| A | 0 | 114 | 0 |
| B | 0 | 114 | 0 |
| C | 0 | 114 | 0 |
| D | 0 | 114 | 0 |
| Mode M0 | |||
|---|---|---|---|
| Quadrant | BADHDUFLAG | Total packets | Discarded packets |
| A | 0 | 11967 | 3 |
| B | 0 | 11130 | 2 |
| C | 0 | 12070 | 2 |
| D | 0 | 13623 | 2 |
| Mode M9 | |||
|---|---|---|---|
| Quadrant | BADHDUFLAG | Total packets | Discarded packets |
| A | 0 | 28 | 0 |
| B | 0 | 28 | 0 |
| C | 0 | 28 | 0 |
| D | 0 | 29 | 0 |
| Quadrant | Total seconds | Saturated seconds | Saturation percentage |
|---|---|---|---|
| A | 5494 | 15 | 0.273025% |
| B | 5494 | 7 | 0.127412% |
| C | 5494 | 72 | 1.310521% |
| D | 5494 | 162 | 2.948671% |
Noise dominated data is calculated using 1-second bins in cleaned event files. If a bin has >2000 counts, and if more than 50% of those come from <1% of pixels, then it is considered to be noise-dominated and hence unusable.
| Quadrant | # 1 sec bins | Bins with >0 counts | Bins with >2000 counts | High rate bins dominated by noise | Noise dominated (total time) | Noise dominated (detector-on time) | Marked lightcurve |
|---|---|---|---|---|---|---|---|
| A | 7257 | 5495 | 4 | 4 | 0.06% | 0.07% | 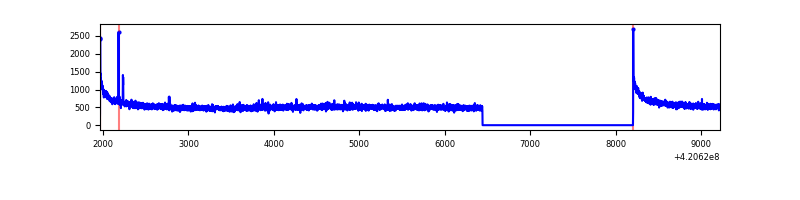 |
| B | 7257 | 5495 | 1 | 1 | 0.01% | 0.02% | 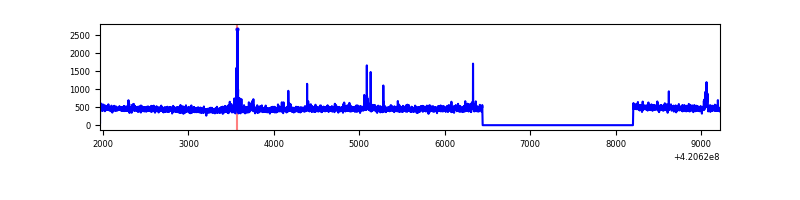 |
| C | 7257 | 5495 | 55 | 55 | 0.76% | 1.00% | 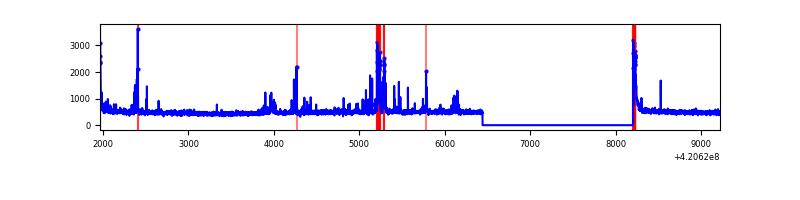 |
| D | 7257 | 5495 | 131 | 131 | 1.81% | 2.38% | 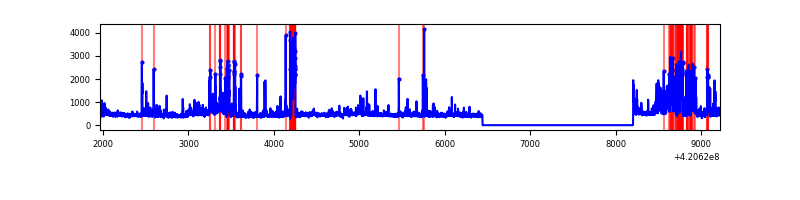 |
Top three noisy pixels from each quadrant. If the there are fewer than three noisy pixels in the level2.evt file, extra rows are filled as -1
| Pixel properties | Quadrant properties | ||||||
|---|---|---|---|---|---|---|---|
| Quadrant | DetID | PixID | Counts | Sigma | Mean | Median | Sigma |
| A | 10 | 83 | 495334 | 3864.61 | 626 | 613 | 128.0 |
| A | 2 | 79 | 22707 | 172.59 | 626 | 613 | 128.0 |
| A | 13 | 254 | 7875 | 56.73 | 626 | 613 | 128.0 |
| B | 8 | 128 | 40660 | 329.84 | 618 | 600 | 121.5 |
| B | 0 | 190 | 32758 | 264.78 | 618 | 600 | 121.5 |
| B | 12 | 111 | 15460 | 122.35 | 618 | 600 | 121.5 |
| C | 15 | 214 | 238112 | 1679.76 | 603 | 605 | 141.4 |
| C | 14 | 254 | 204451 | 1441.69 | 603 | 605 | 141.4 |
| C | 0 | 10 | 111888 | 787.04 | 603 | 605 | 141.4 |
| D | 13 | 249 | 728423 | 4923.6 | 601 | 584 | 147.8 |
| D | 12 | 79 | 118740 | 799.29 | 601 | 584 | 147.8 |
| D | 2 | 249 | 68436 | 459.0 | 601 | 584 | 147.8 |
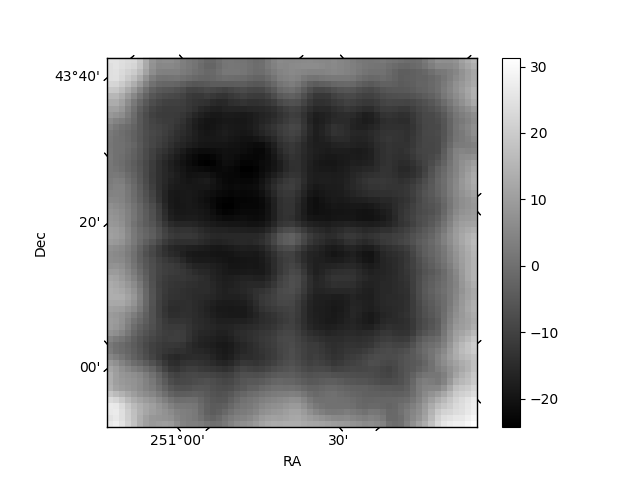
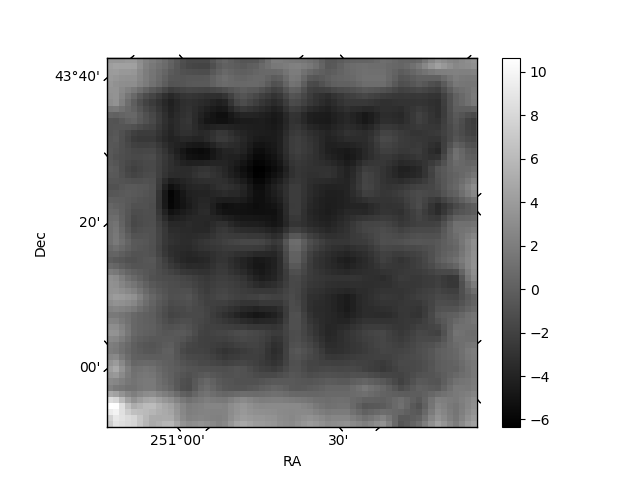
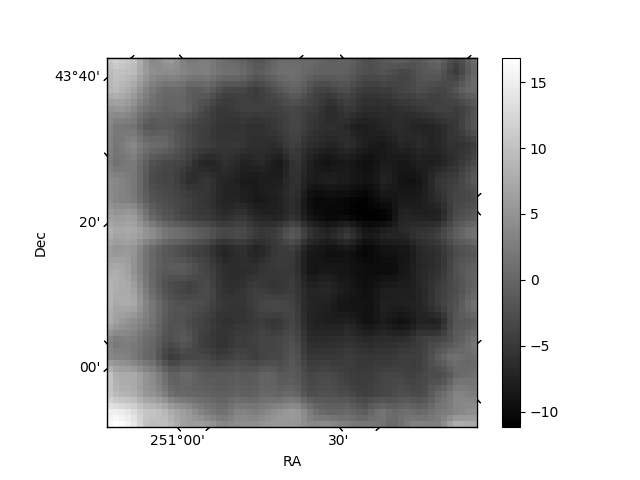
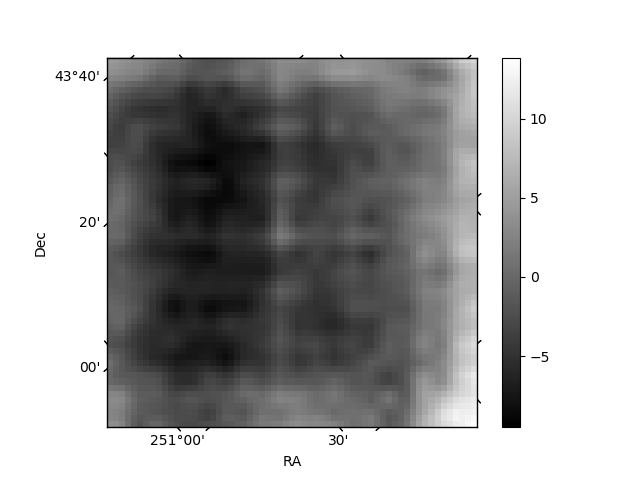
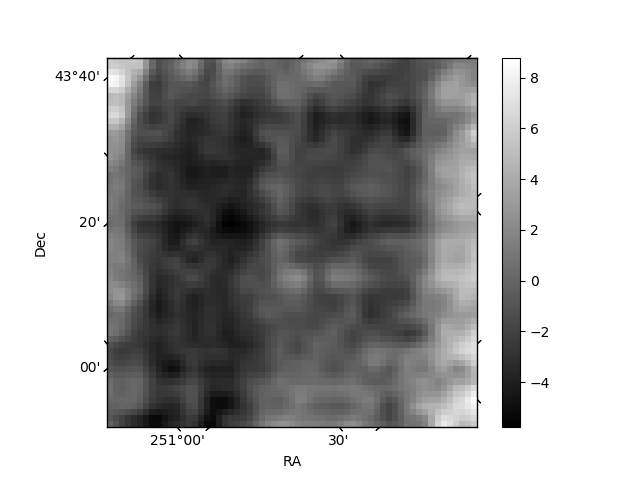
Histogram calculated using DETX and DETY for each event in the final _common_clean file
| Quadrant A | 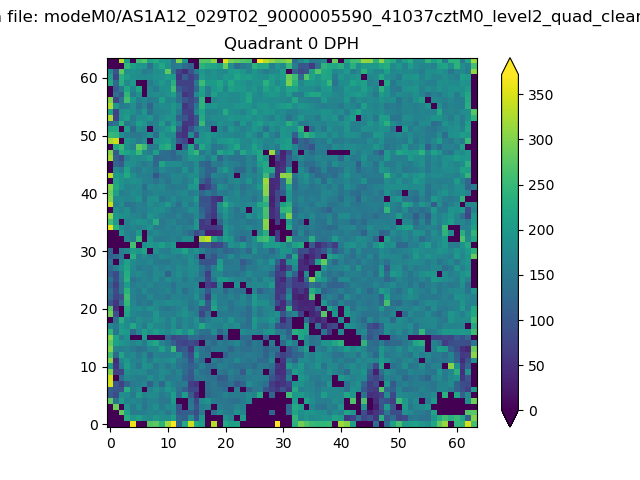 |
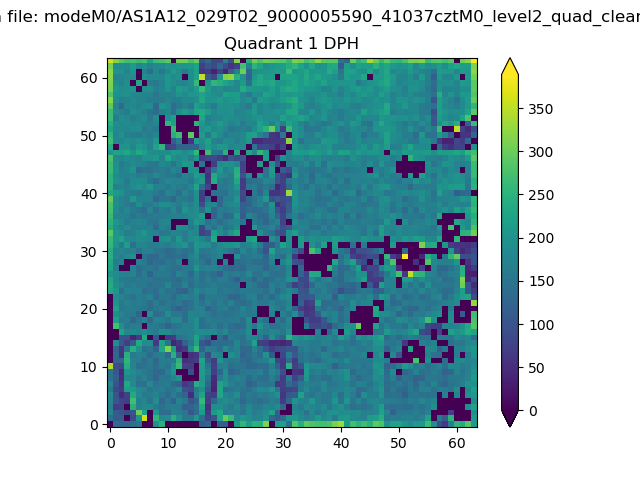 |
Quadrant B |
|---|---|---|---|
| Quadrant D | 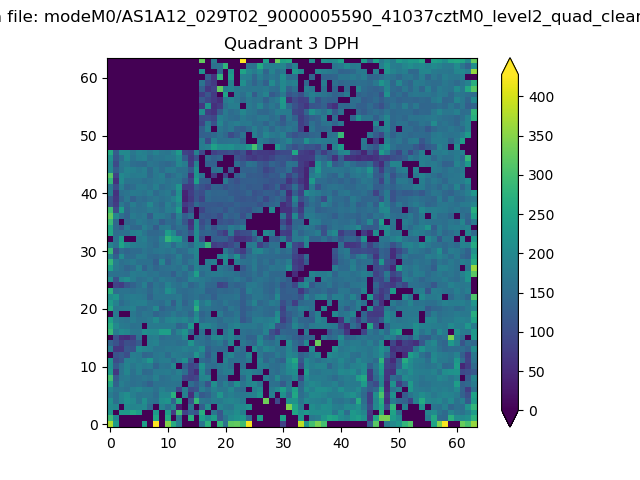 |
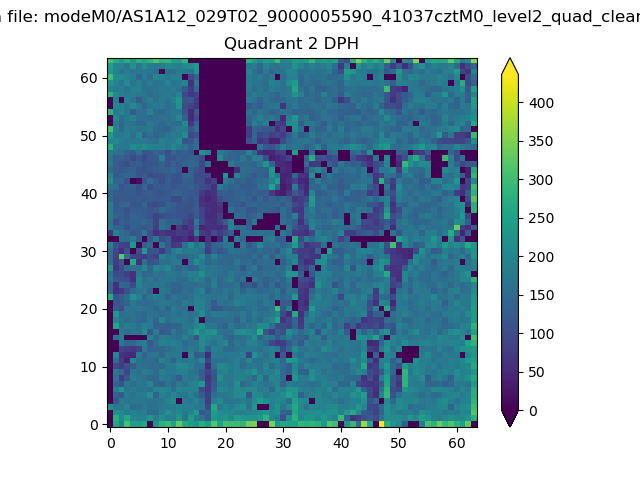 |
Quadrant C |
| Plot type | Count rate plots | Images |
|---|---|---|
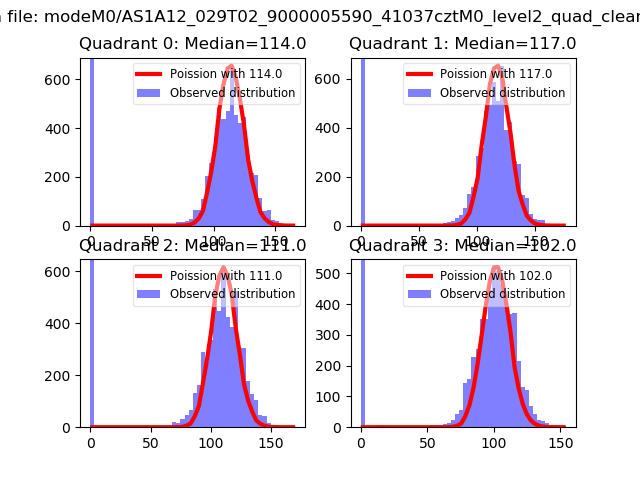
| Comparison with Poisson distribution Blue bars denote a histogram of data divided into 1 sec bins. Red curve is a Poisson curve with rate = median count rate of data. |
 |
 |
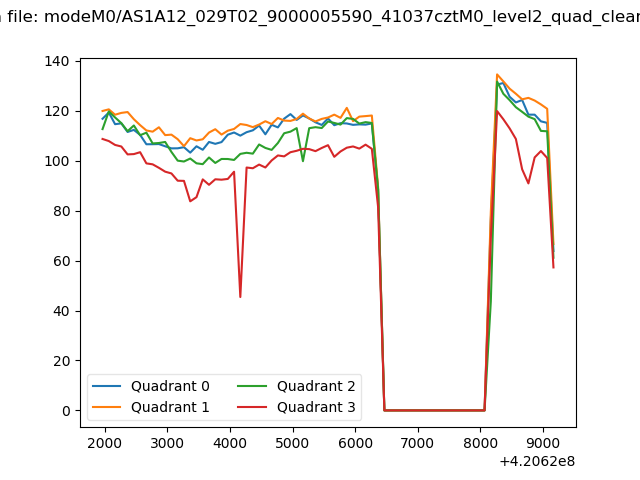
| Quadrant-wise count rates Data is divided into 100 sec bins |
 |
|
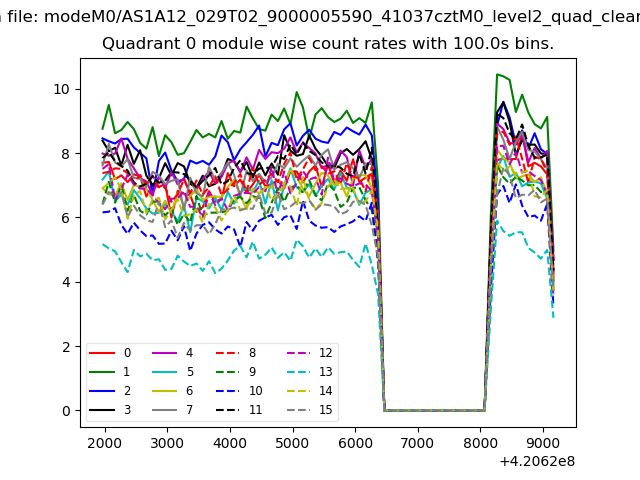
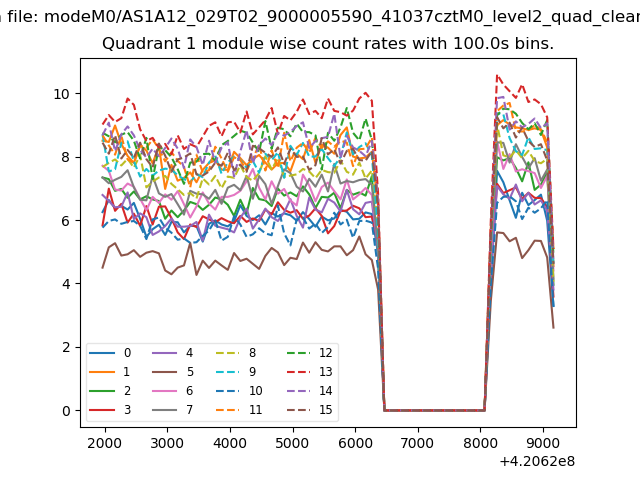
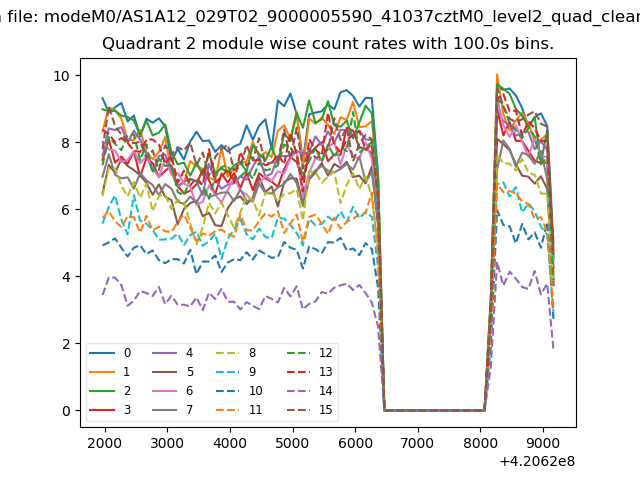
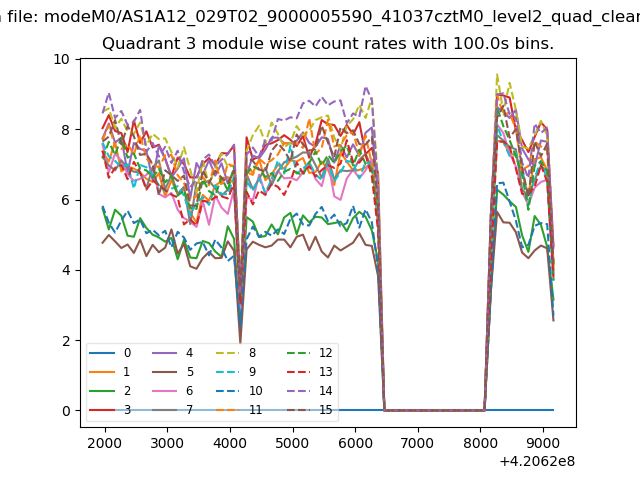
| Module-wise count rates for Quadrant A Data is divided into 100 sec bins |
 |
 |
| Module-wise count rates for Quadrant B Data is divided into 100 sec bins |
 |
 |
| Module-wise count rates for Quadrant C Data is divided into 100 sec bins |
 |
 |
| Module-wise count rates for Quadrant D Data is divided into 100 sec bins |
 |
 |
| Parameter | Plot |
|---|---|
| CZT HV Monitor | 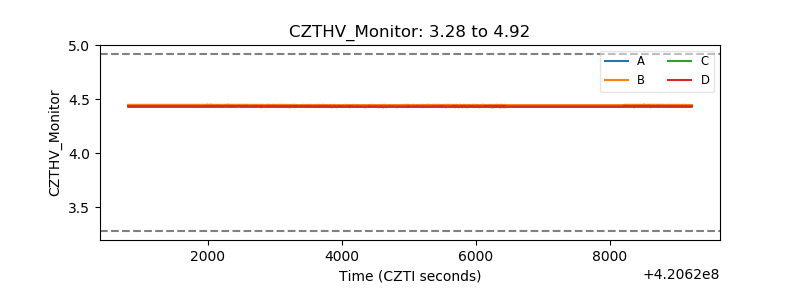 |
| D_VDD | 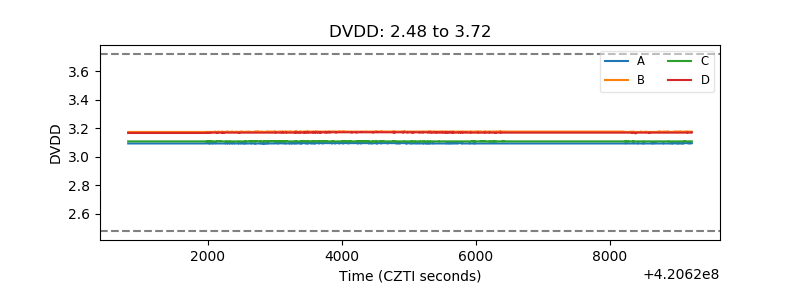 |
| Temperature 1 | 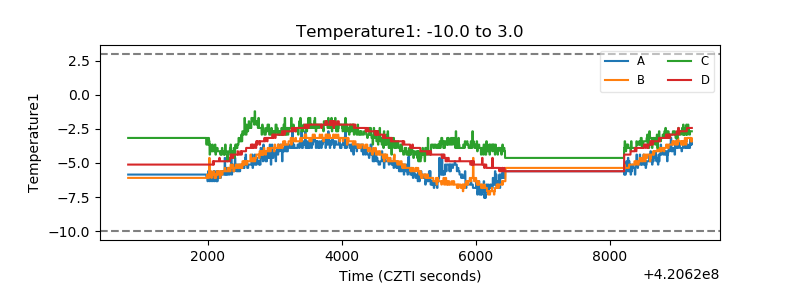 |
| Veto HV Monitor | 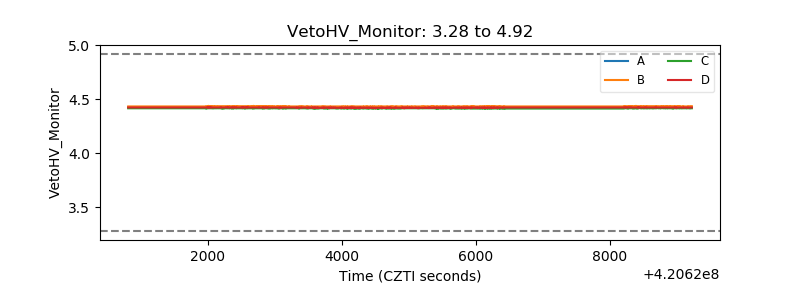 |
| Veto LLD | 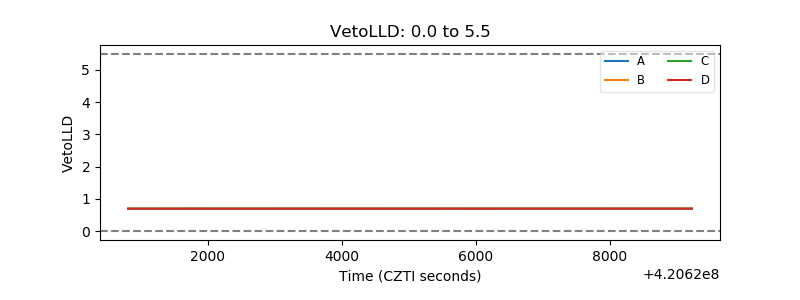 |
| Alpha Counter | 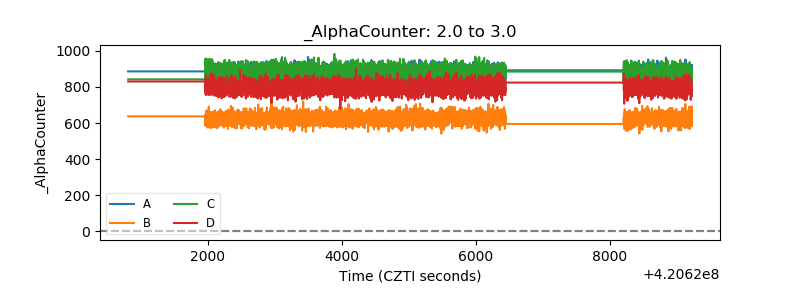 |
| _CPM_Rate | 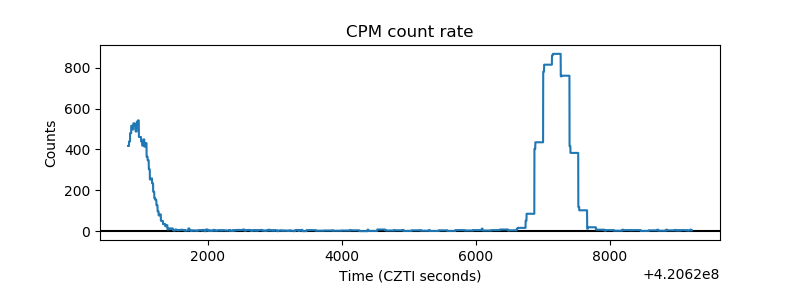 |
| CZT Counter | 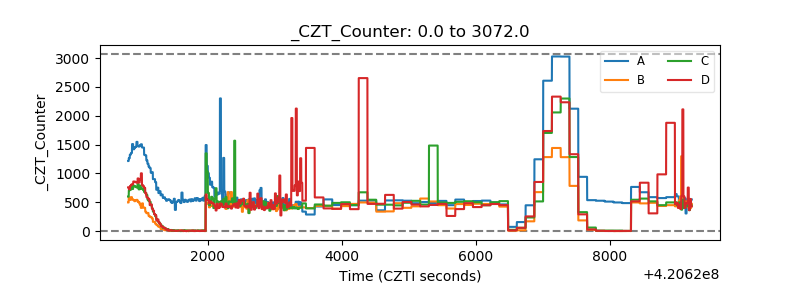 |
| +2.5 Volts monitor |  |
| +5 Volts monitor |  |
| _ROLL_ROT | 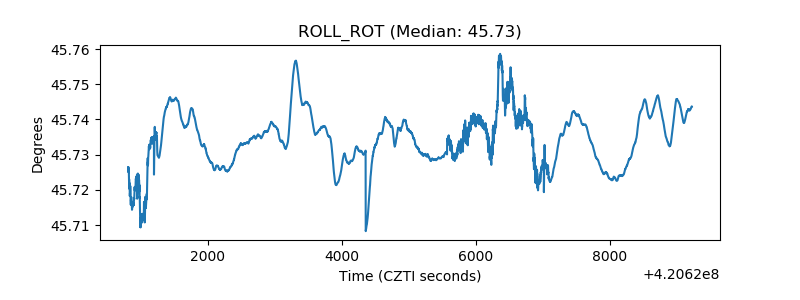 |
| _Roll_DEC |  |
| _Roll_RA | 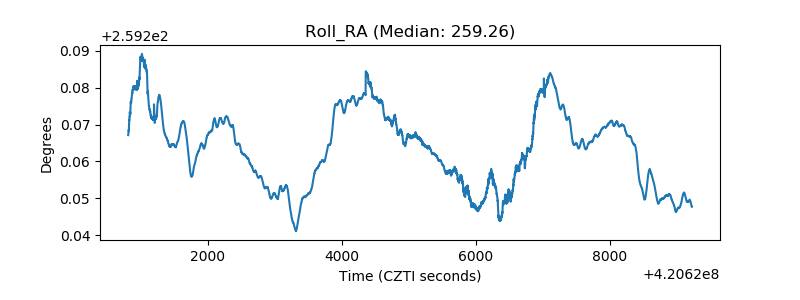 |
| Veto Counter | 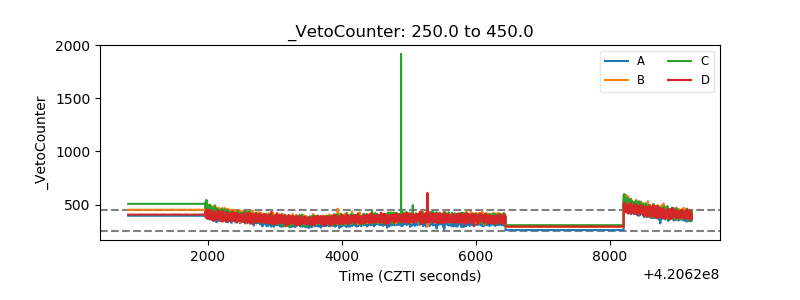 |