| Param | Original file | Final file |
|---|---|---|
| Filename | modeM0/AS1A12_029T02_9000005590_41038cztM0_level2.fits | modeM0/AS1A12_029T02_9000005590_41038cztM0_level2_quad_clean.evt |
| Size (bytes) | 323,406,720 | 92,306,880 |
| Size | 308.4 MB | 88.0 MB |
| Events in quadrant A | 2,898,651 | 633,231 |
| Events in quadrant B | 2,422,077 | 648,632 |
| Events in quadrant C | 2,953,742 | 599,178 |
| Events in quadrant D | 3,289,825 | 547,892 |
| Mode SS | |||
|---|---|---|---|
| Quadrant | BADHDUFLAG | Total packets | Discarded packets |
| A | 0 | 108 | 0 |
| B | 0 | 108 | 0 |
| C | 0 | 108 | 0 |
| D | 0 | 108 | 0 |
| Mode M0 | |||
|---|---|---|---|
| Quadrant | BADHDUFLAG | Total packets | Discarded packets |
| A | 0 | 11684 | 3 |
| B | 0 | 10539 | 2 |
| C | 0 | 11854 | 2 |
| D | 0 | 13342 | 2 |
| Mode M9 | |||
|---|---|---|---|
| Quadrant | BADHDUFLAG | Total packets | Discarded packets |
| A | 0 | 26 | 0 |
| B | 0 | 26 | 0 |
| C | 0 | 26 | 0 |
| D | 0 | 27 | 0 |
| Quadrant | Total seconds | Saturated seconds | Saturation percentage |
|---|---|---|---|
| A | 5226 | 18 | 0.344432% |
| B | 5226 | 9 | 0.172216% |
| C | 5226 | 103 | 1.970915% |
| D | 5226 | 185 | 3.539992% |
Noise dominated data is calculated using 1-second bins in cleaned event files. If a bin has >2000 counts, and if more than 50% of those come from <1% of pixels, then it is considered to be noise-dominated and hence unusable.
| Quadrant | # 1 sec bins | Bins with >0 counts | Bins with >2000 counts | High rate bins dominated by noise | Noise dominated (total time) | Noise dominated (detector-on time) | Marked lightcurve |
|---|---|---|---|---|---|---|---|
| A | 7139 | 5227 | 3 | 3 | 0.04% | 0.06% | 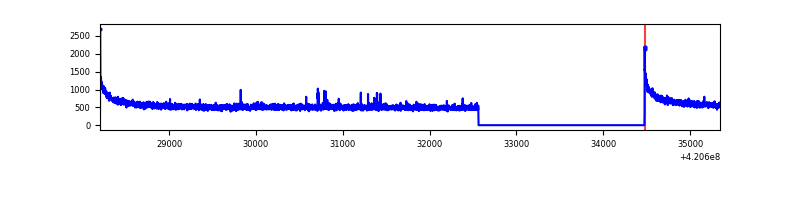 |
| B | 7139 | 5227 | 0 | 0 | 0.00% | 0.00% | 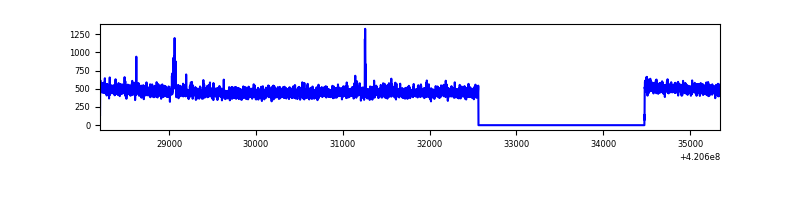 |
| C | 7139 | 5227 | 88 | 88 | 1.23% | 1.68% | 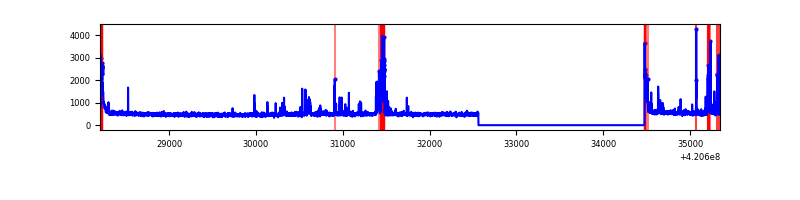 |
| D | 7139 | 5227 | 152 | 152 | 2.13% | 2.91% | 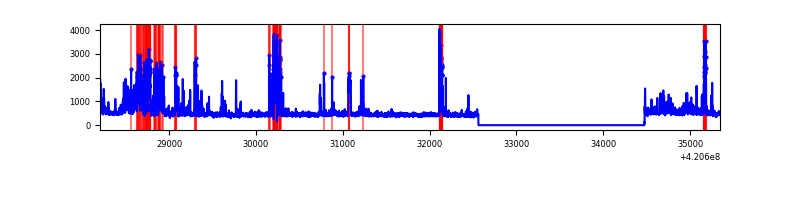 |
Top three noisy pixels from each quadrant. If the there are fewer than three noisy pixels in the level2.evt file, extra rows are filled as -1
| Pixel properties | Quadrant properties | ||||||
|---|---|---|---|---|---|---|---|
| Quadrant | DetID | PixID | Counts | Sigma | Mean | Median | Sigma |
| A | 10 | 83 | 487105 | 3882.54 | 617 | 605 | 125.3 |
| A | 15 | 191 | 14091 | 107.62 | 617 | 605 | 125.3 |
| A | 13 | 254 | 8435 | 62.48 | 617 | 605 | 125.3 |
| B | 12 | 111 | 14813 | 121.33 | 608 | 591 | 117.2 |
| B | 11 | 111 | 13850 | 113.11 | 608 | 591 | 117.2 |
| B | 14 | 111 | 13398 | 109.25 | 608 | 591 | 117.2 |
| C | 14 | 254 | 240304 | 1743.68 | 590 | 594 | 137.5 |
| C | 15 | 214 | 224090 | 1625.73 | 590 | 594 | 137.5 |
| C | 0 | 10 | 128972 | 933.84 | 590 | 594 | 137.5 |
| D | 13 | 249 | 776431 | 5465.64 | 588 | 571 | 142.0 |
| D | 2 | 249 | 98063 | 686.79 | 588 | 571 | 142.0 |
| D | 12 | 79 | 73486 | 513.66 | 588 | 571 | 142.0 |
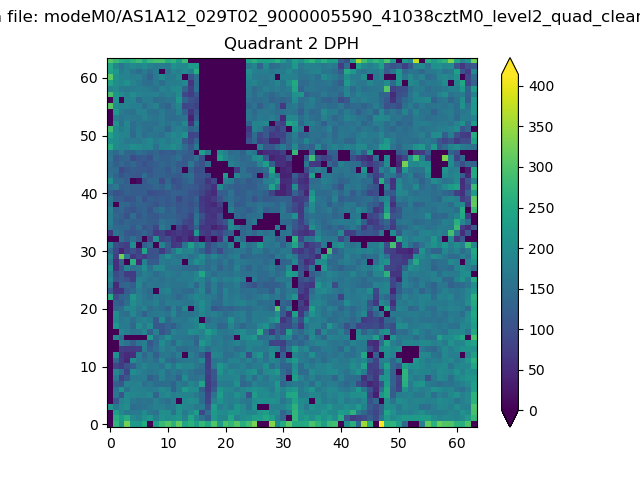
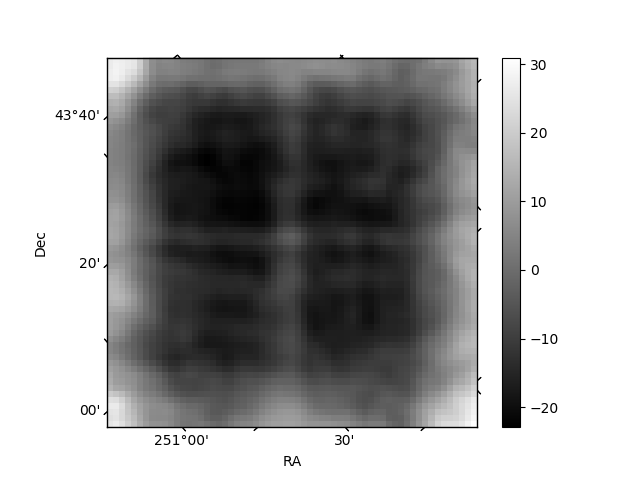
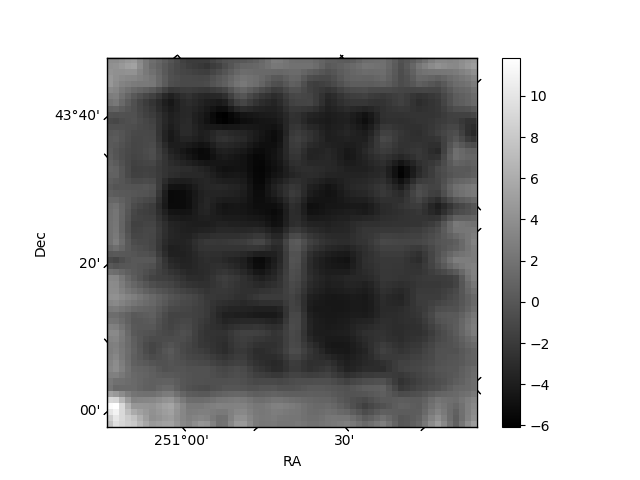
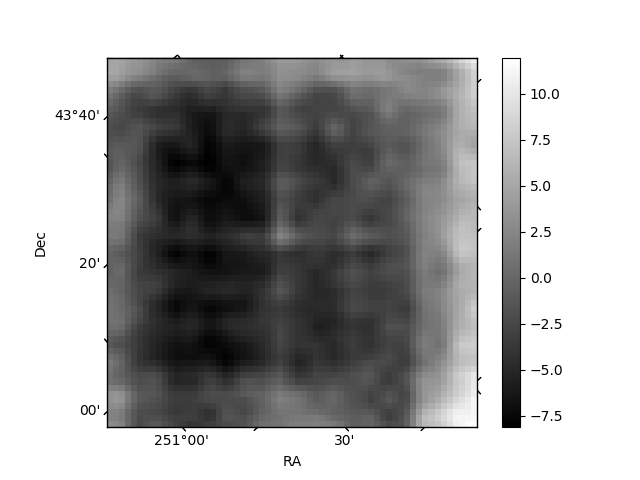
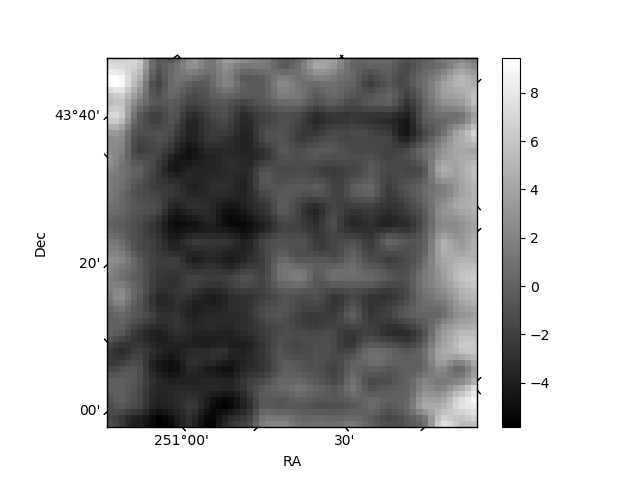
Histogram calculated using DETX and DETY for each event in the final _common_clean file
| Quadrant A | 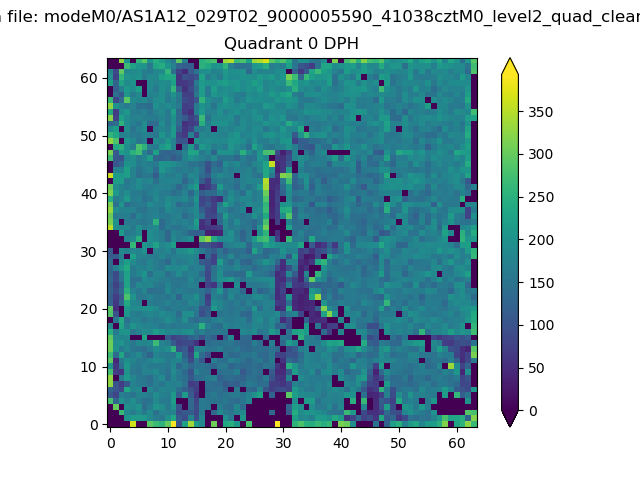 |
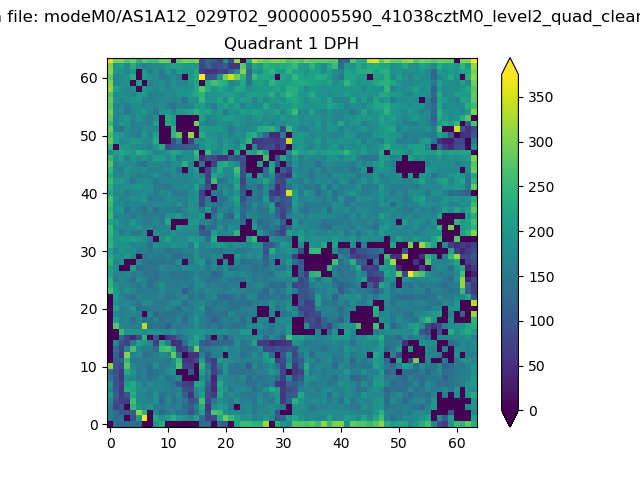 |
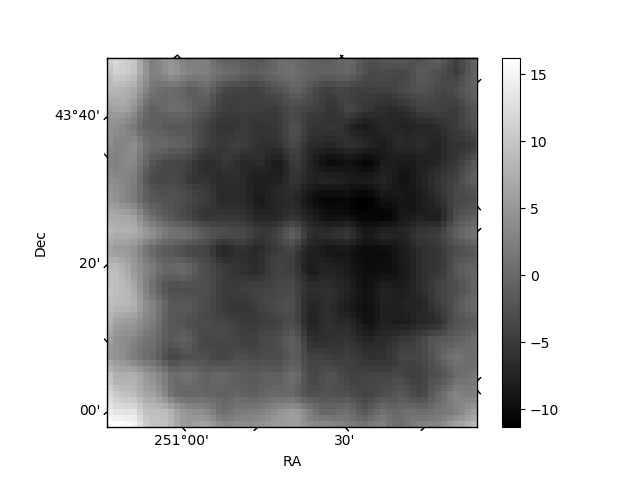
Quadrant B |
|---|---|---|---|
| Quadrant D | 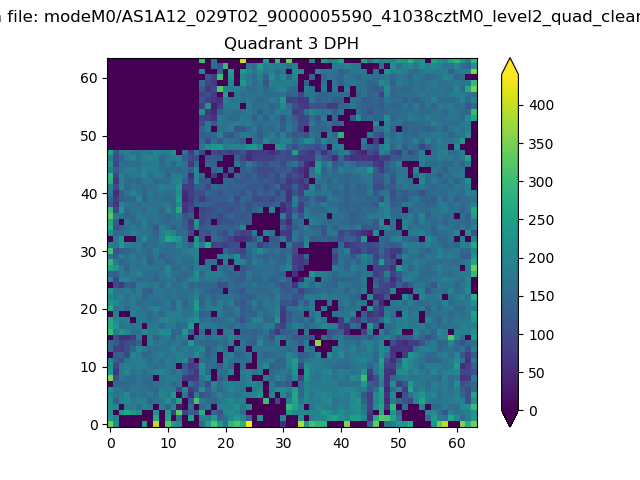 |
 |
Quadrant C |
| Plot type | Count rate plots | Images |
|---|---|---|
| Comparison with Poisson distribution Blue bars denote a histogram of data divided into 1 sec bins. Red curve is a Poisson curve with rate = median count rate of data. |
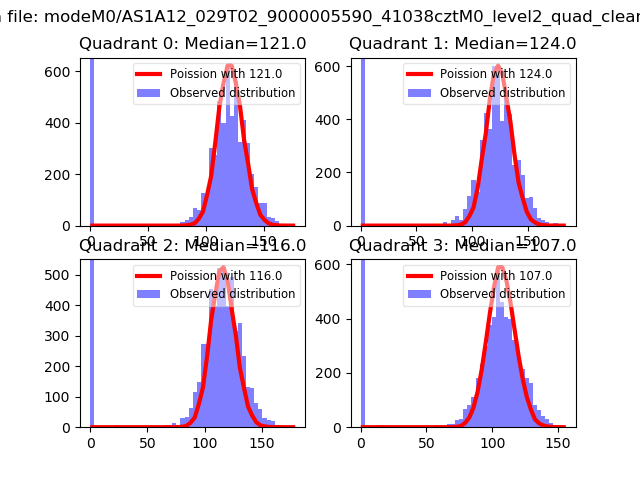 |
 |
| Quadrant-wise count rates Data is divided into 100 sec bins |
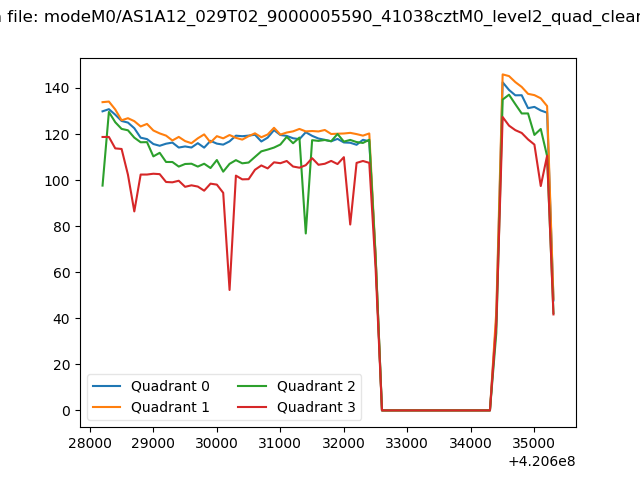 |
|
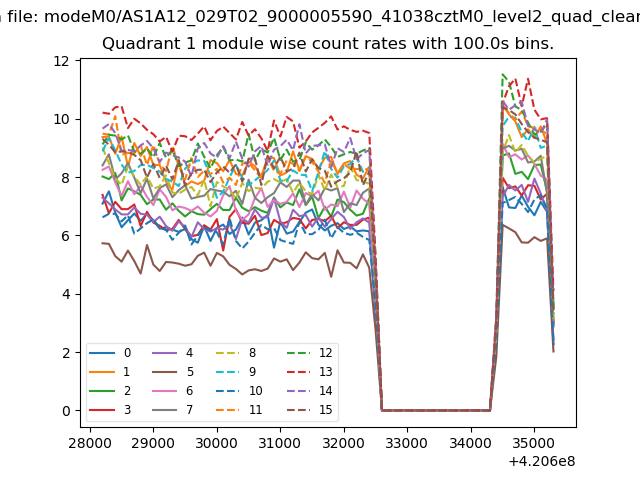
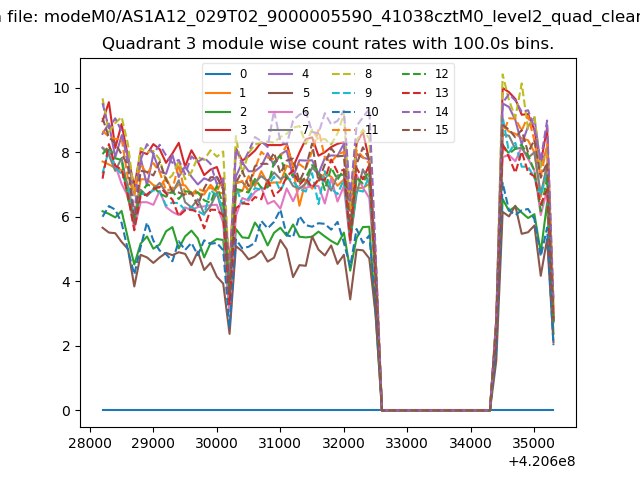
| Module-wise count rates for Quadrant A Data is divided into 100 sec bins |
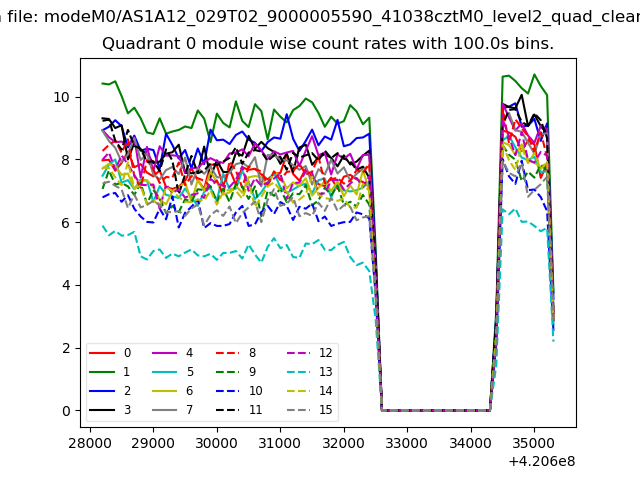 |
 |
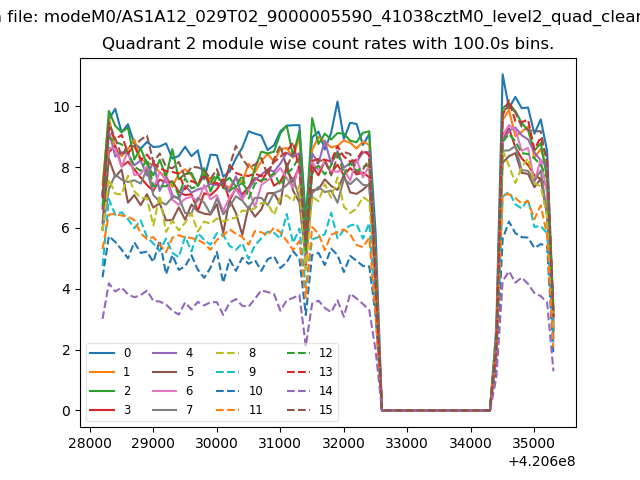
| Module-wise count rates for Quadrant B Data is divided into 100 sec bins |
 |
 |
| Module-wise count rates for Quadrant C Data is divided into 100 sec bins |
 |
 |
| Module-wise count rates for Quadrant D Data is divided into 100 sec bins |
 |
 |
| Parameter | Plot |
|---|---|
| CZT HV Monitor |  |
| D_VDD | 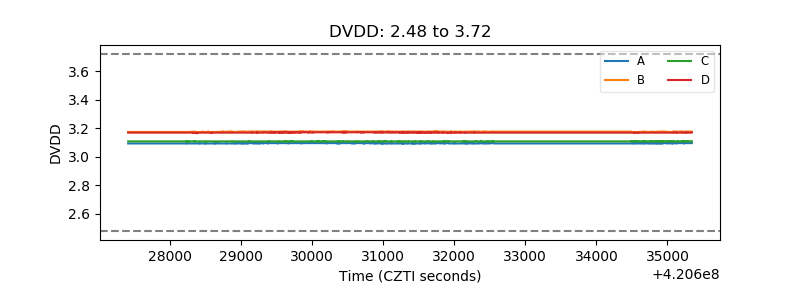 |
| Temperature 1 | 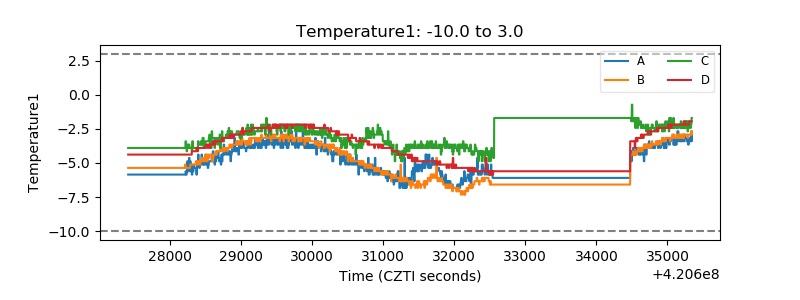 |
| Veto HV Monitor | 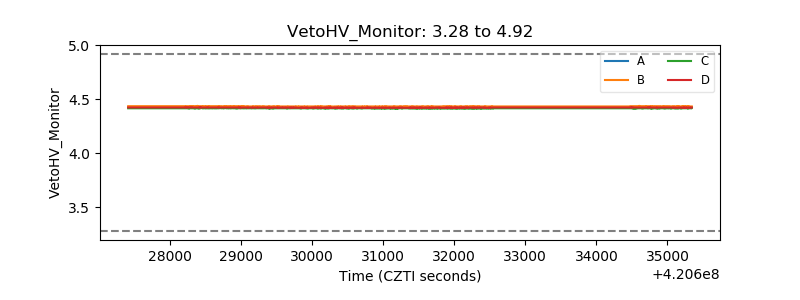 |
| Veto LLD | 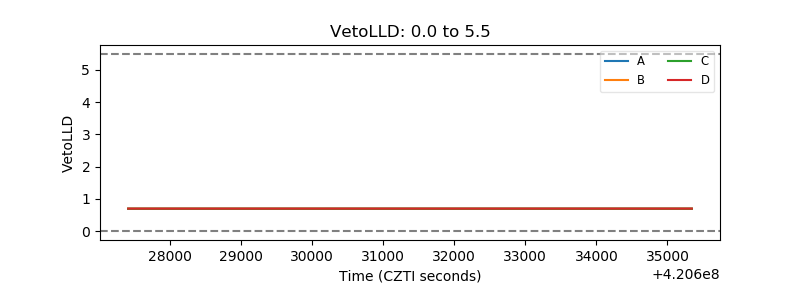 |
| Alpha Counter | 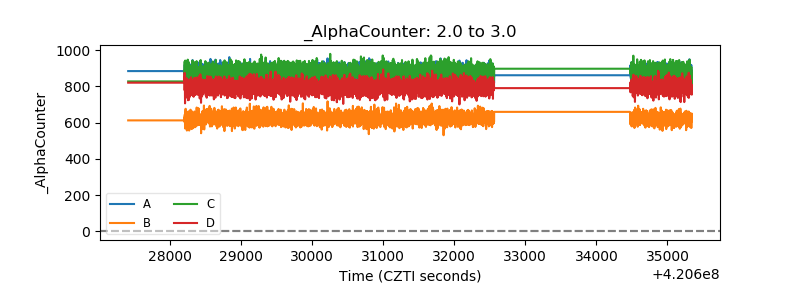 |
| _CPM_Rate |  |
| CZT Counter | 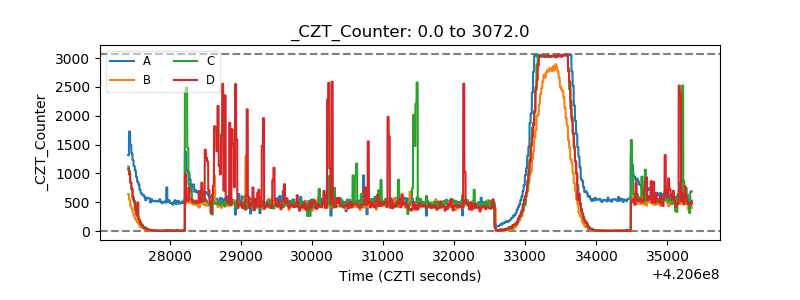 |
| +2.5 Volts monitor |  |
| +5 Volts monitor | 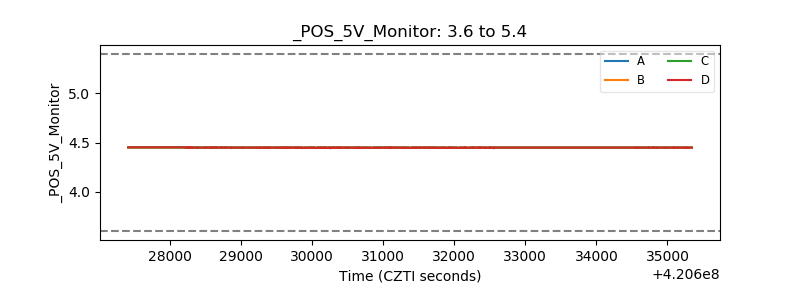 |
| _ROLL_ROT | 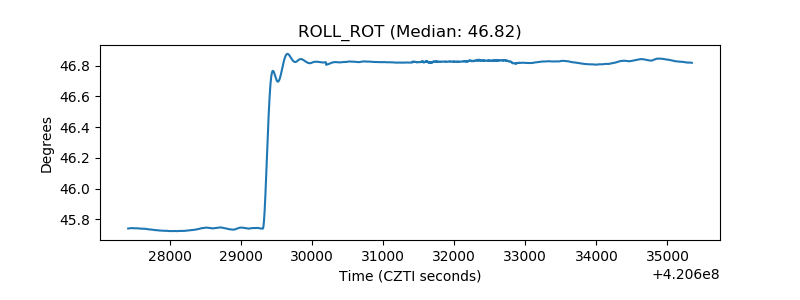 |
| _Roll_DEC | 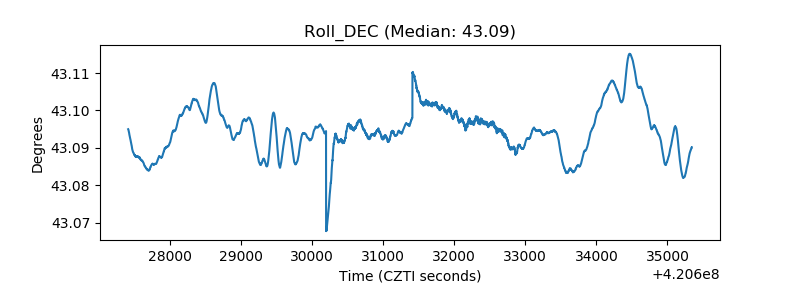 |
| _Roll_RA | 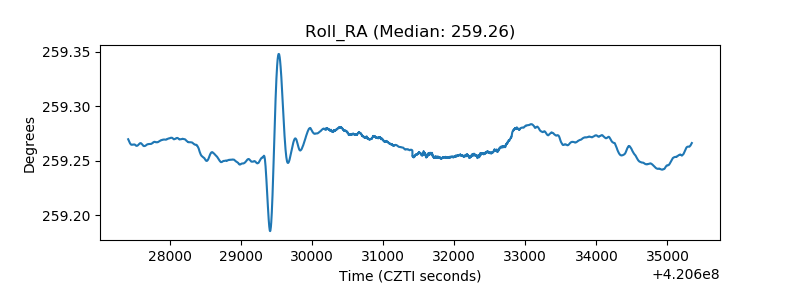 |
| Veto Counter | 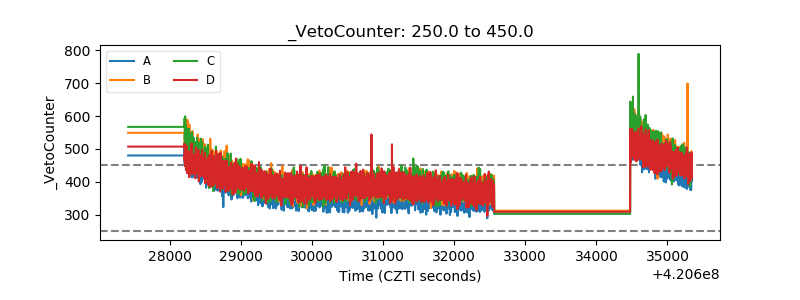 |