| Param | Original file | Final file |
|---|---|---|
| Filename | modeM0/AS1A12_029T02_9000005590_41041cztM0_level2.fits | modeM0/AS1A12_029T02_9000005590_41041cztM0_level2_quad_clean.evt |
| Size (bytes) | 237,928,320 | 74,082,240 |
| Size | 226.9 MB | 70.7 MB |
| Events in quadrant A | 2,250,442 | 498,825 |
| Events in quadrant B | 1,895,130 | 515,258 |
| Events in quadrant C | 2,310,174 | 483,391 |
| Events in quadrant D | 2,024,136 | 450,914 |
| Mode SS | |||
|---|---|---|---|
| Quadrant | BADHDUFLAG | Total packets | Discarded packets |
| A | 0 | 99 | 9 |
| B | 0 | 95 | 4 |
| C | 0 | 96 | 10 |
| D | 0 | 95 | 11 |
| Mode M0 | |||
|---|---|---|---|
| Quadrant | BADHDUFLAG | Total packets | Discarded packets |
| A | 0 | 10679 | 1470 |
| B | 0 | 9493 | 1058 |
| C | 0 | 10579 | 1255 |
| D | 0 | 10076 | 1182 |
| Mode M9 | |||
|---|---|---|---|
| Quadrant | BADHDUFLAG | Total packets | Discarded packets |
| A | 0 | 37 | 4 |
| B | 0 | 36 | 4 |
| C | 0 | 36 | 4 |
| D | 0 | 36 | 6 |
| Quadrant | Total seconds | Saturated seconds | Saturation percentage |
|---|---|---|---|
| A | 4181 | 10 | 0.239177% |
| B | 4197 | 2 | 0.047653% |
| C | 4163 | 64 | 1.537353% |
| D | 4182 | 23 | 0.549976% |
Noise dominated data is calculated using 1-second bins in cleaned event files. If a bin has >2000 counts, and if more than 50% of those come from <1% of pixels, then it is considered to be noise-dominated and hence unusable.
| Quadrant | # 1 sec bins | Bins with >0 counts | Bins with >2000 counts | High rate bins dominated by noise | Noise dominated (total time) | Noise dominated (detector-on time) | Marked lightcurve |
|---|---|---|---|---|---|---|---|
| A | 7012 | 4439 | 3 | 3 | 0.04% | 0.07% | 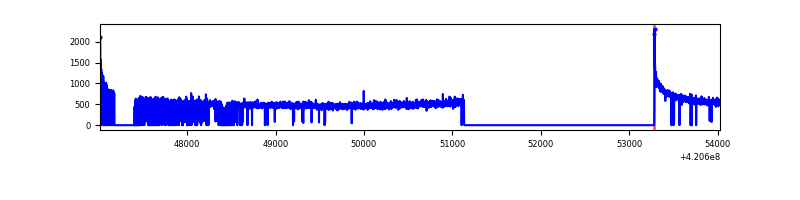 |
| B | 7013 | 4445 | 0 | 0 | 0.00% | 0.00% | 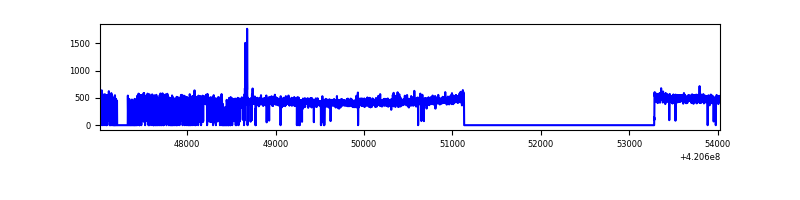 |
| C | 7013 | 4432 | 48 | 48 | 0.68% | 1.08% | 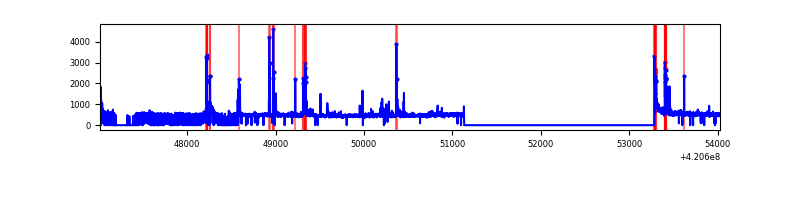 |
| D | 7013 | 4439 | 18 | 18 | 0.26% | 0.41% | 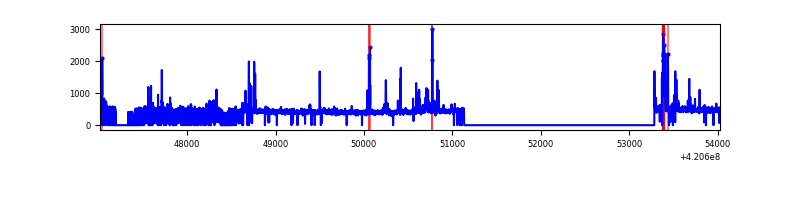 |
Top three noisy pixels from each quadrant. If the there are fewer than three noisy pixels in the level2.evt file, extra rows are filled as -1
| Pixel properties | Quadrant properties | ||||||
|---|---|---|---|---|---|---|---|
| Quadrant | DetID | PixID | Counts | Sigma | Mean | Median | Sigma |
| A | 10 | 83 | 388097 | 3954.18 | 479 | 469 | 98.0 |
| A | 13 | 254 | 7034 | 66.97 | 479 | 469 | 98.0 |
| A | 13 | 6 | 6053 | 56.96 | 479 | 469 | 98.0 |
| B | 12 | 111 | 11531 | 117.53 | 481 | 468 | 94.1 |
| B | 11 | 111 | 10436 | 105.89 | 481 | 468 | 94.1 |
| B | 14 | 111 | 10210 | 103.49 | 481 | 468 | 94.1 |
| C | 14 | 254 | 213911 | 1940.51 | 470 | 474 | 110.0 |
| C | 15 | 214 | 175844 | 1594.41 | 470 | 474 | 110.0 |
| C | 0 | 10 | 68012 | 614.04 | 470 | 474 | 110.0 |
| D | 13 | 249 | 61829 | 527.13 | 473 | 460 | 116.4 |
| D | 12 | 0 | 56936 | 485.1 | 473 | 460 | 116.4 |
| D | 13 | 171 | 43730 | 371.67 | 473 | 460 | 116.4 |
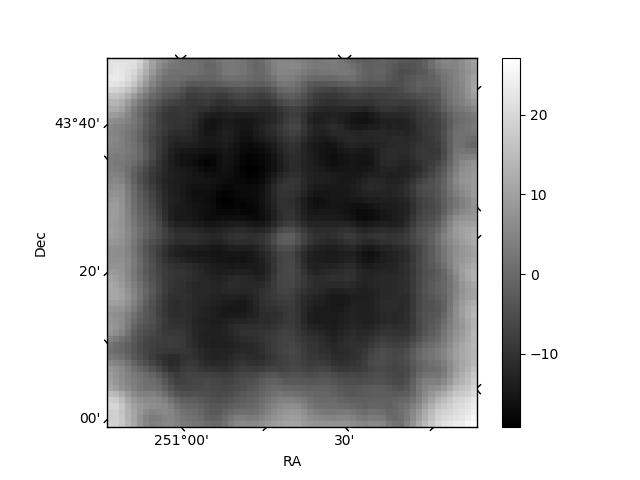
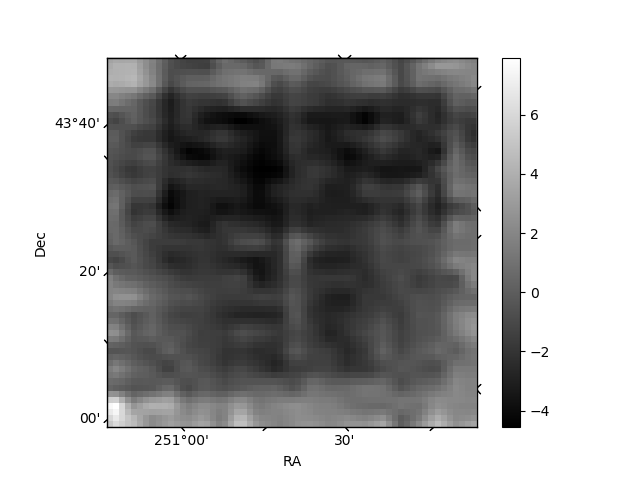
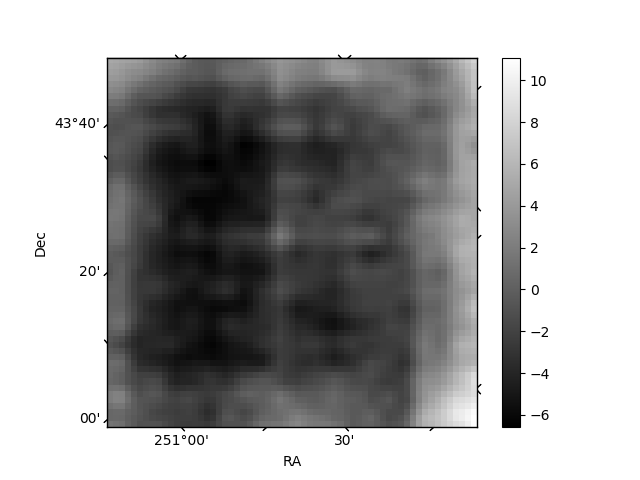
Histogram calculated using DETX and DETY for each event in the final _common_clean file
| Quadrant A | 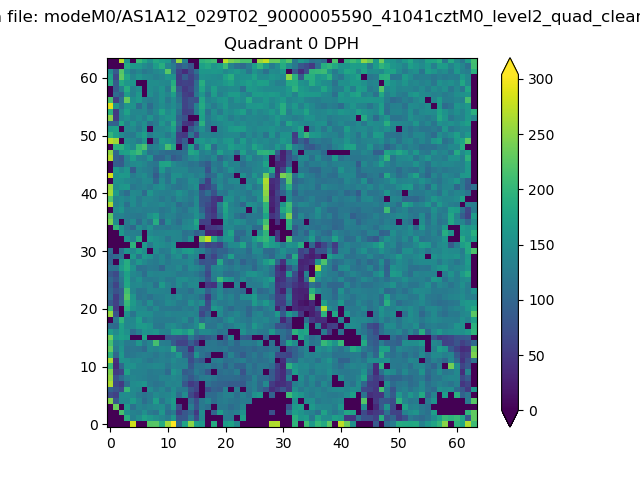 |
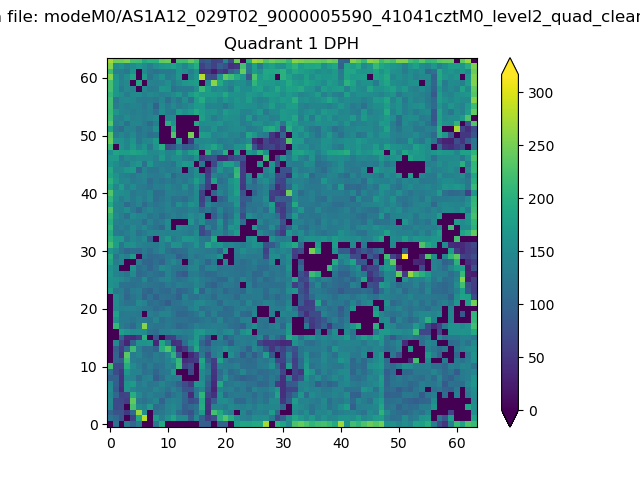 |
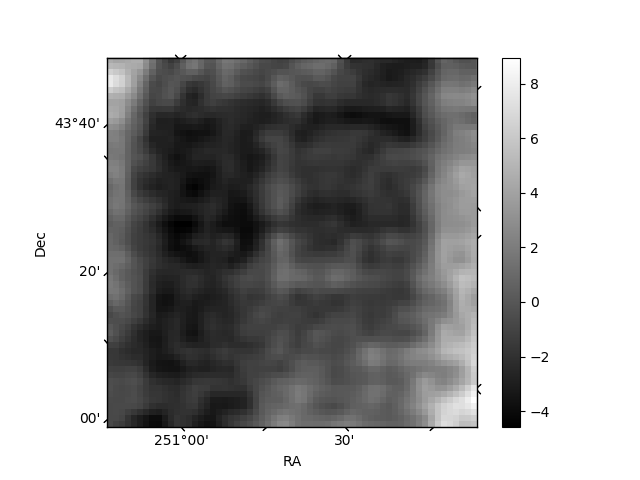
Quadrant B |
|---|---|---|---|
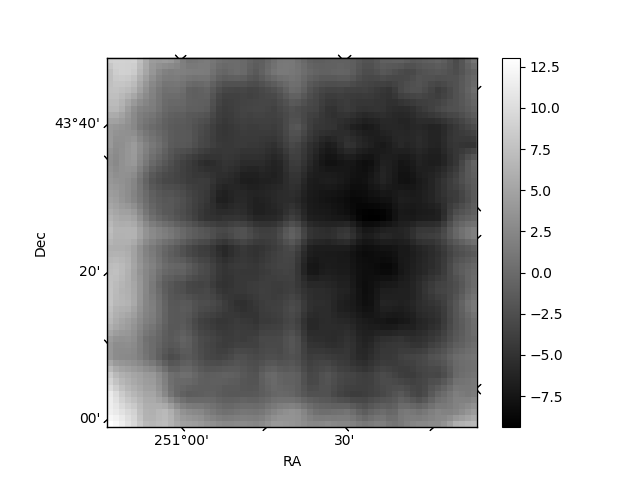
| Quadrant D | 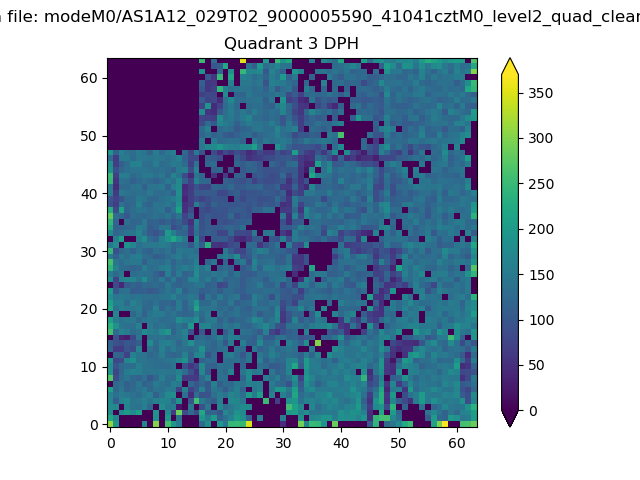 |
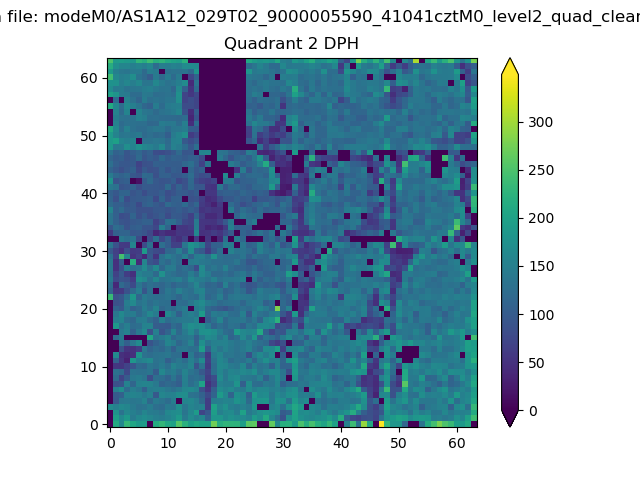 |
Quadrant C |
| Plot type | Count rate plots | Images |
|---|---|---|
| Comparison with Poisson distribution Blue bars denote a histogram of data divided into 1 sec bins. Red curve is a Poisson curve with rate = median count rate of data. |
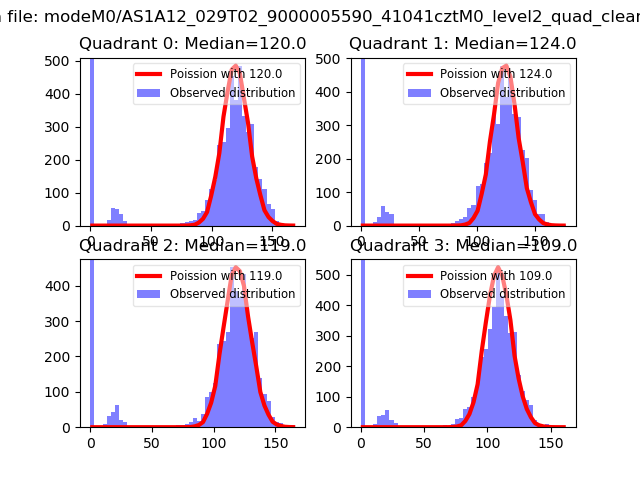 |
 |
| Quadrant-wise count rates Data is divided into 100 sec bins |
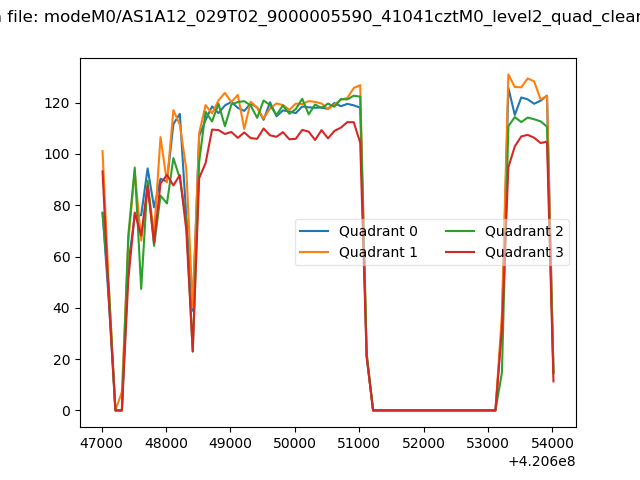 |
|
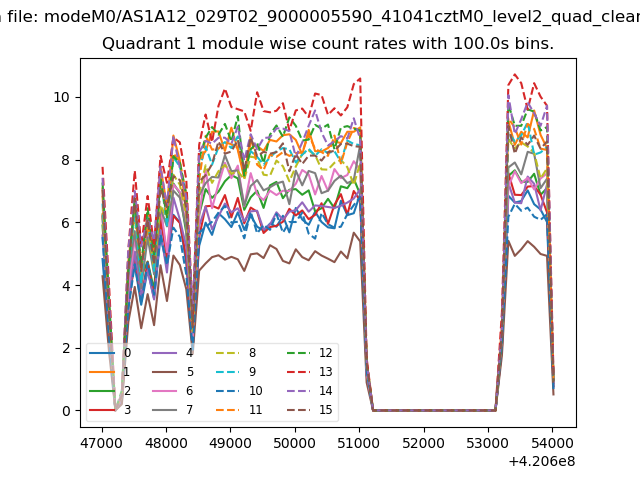
| Module-wise count rates for Quadrant A Data is divided into 100 sec bins |
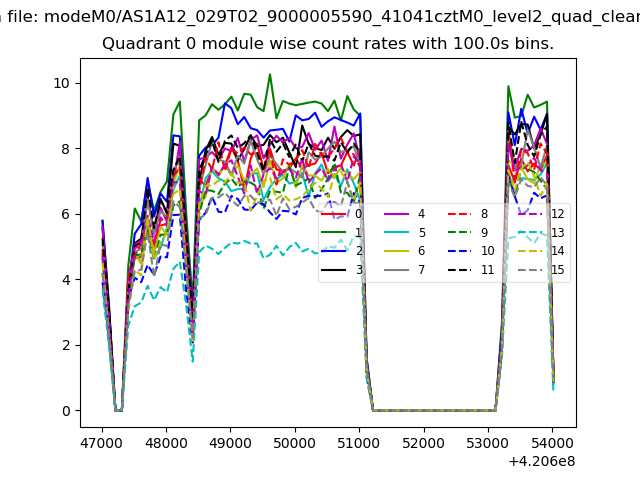 |
 |
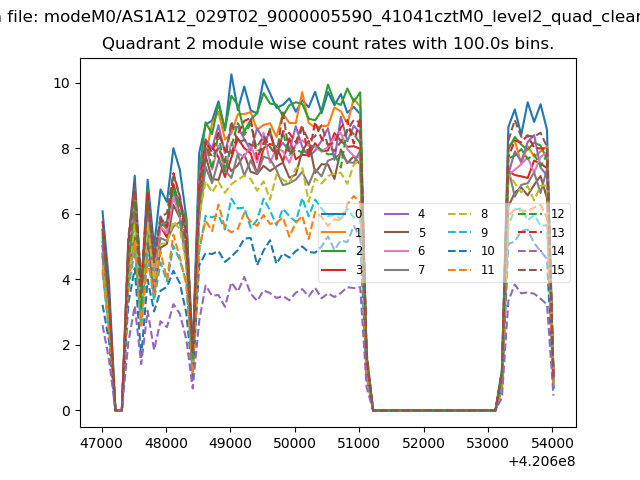
| Module-wise count rates for Quadrant B Data is divided into 100 sec bins |
 |
 |
| Module-wise count rates for Quadrant C Data is divided into 100 sec bins |
 |
 |
| Module-wise count rates for Quadrant D Data is divided into 100 sec bins |
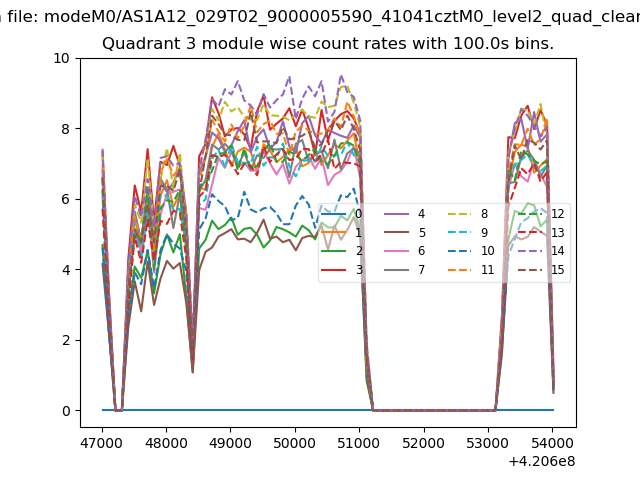 |
 |
| Parameter | Plot |
|---|---|
| CZT HV Monitor | 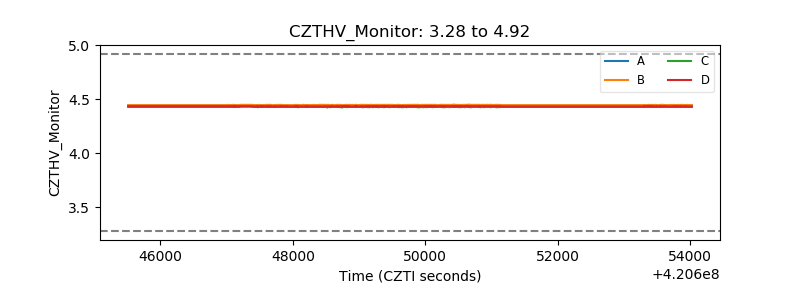 |
| D_VDD | 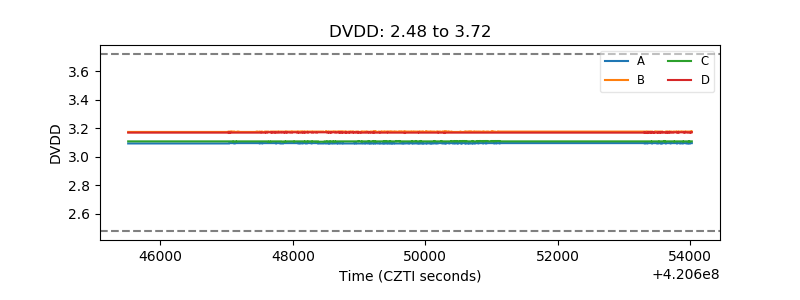 |
| Temperature 1 | 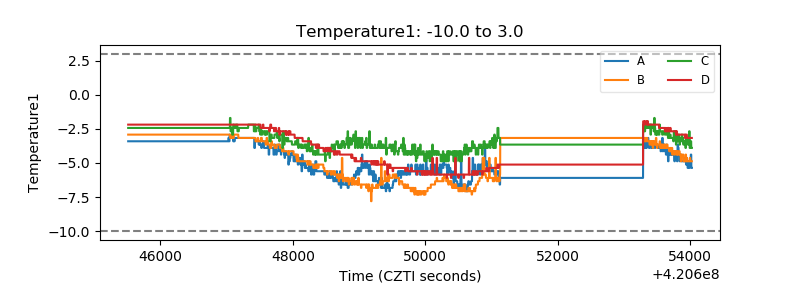 |
| Veto HV Monitor | 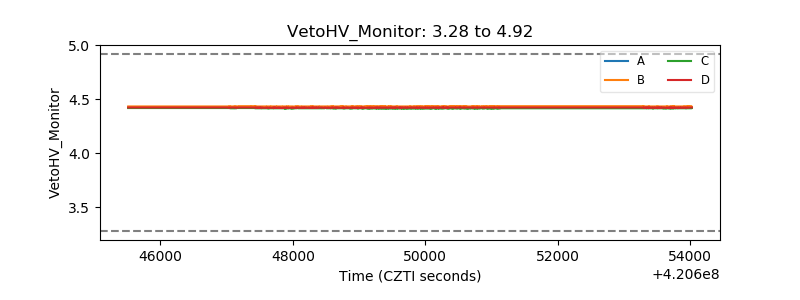 |
| Veto LLD | 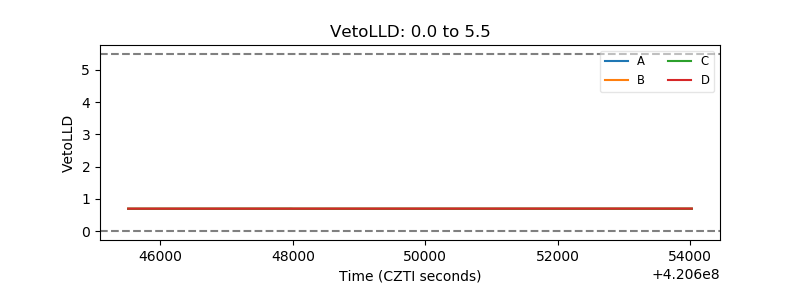 |
| Alpha Counter | 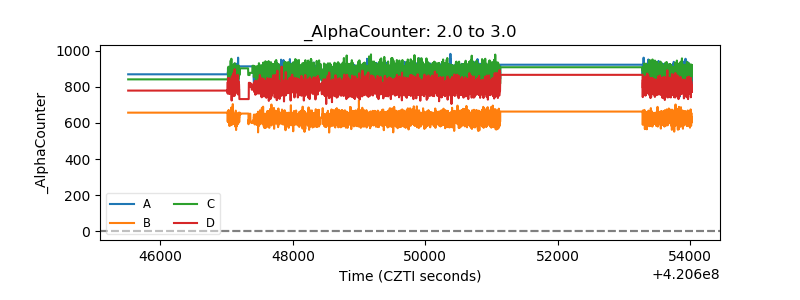 |
| _CPM_Rate | 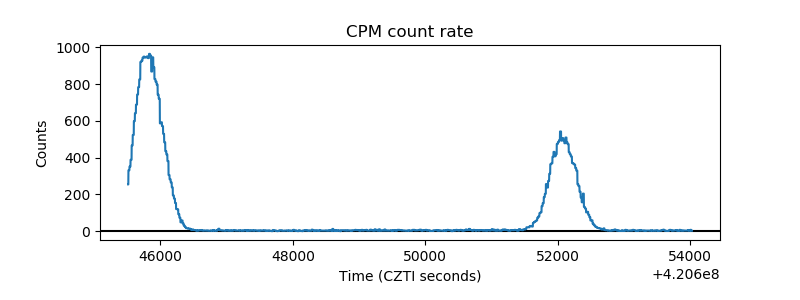 |
| CZT Counter | 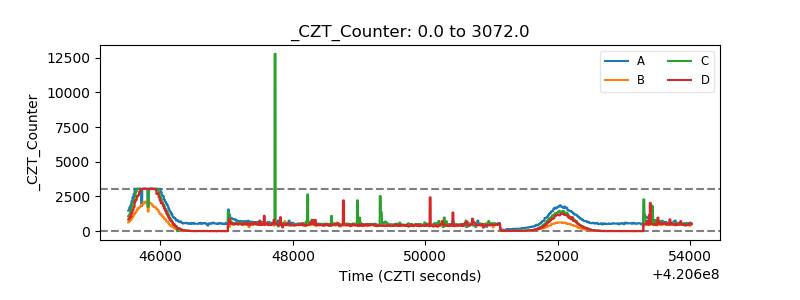 |
| +2.5 Volts monitor |  |
| +5 Volts monitor | 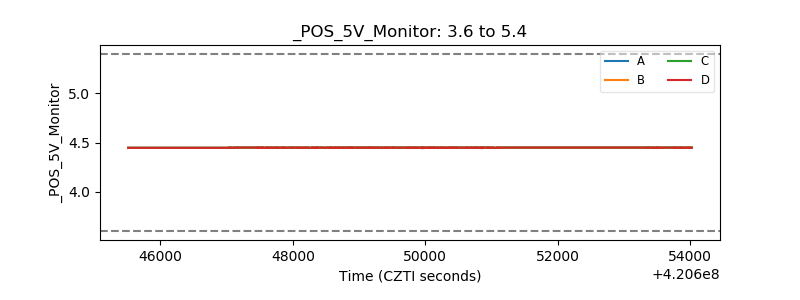 |
| _ROLL_ROT | 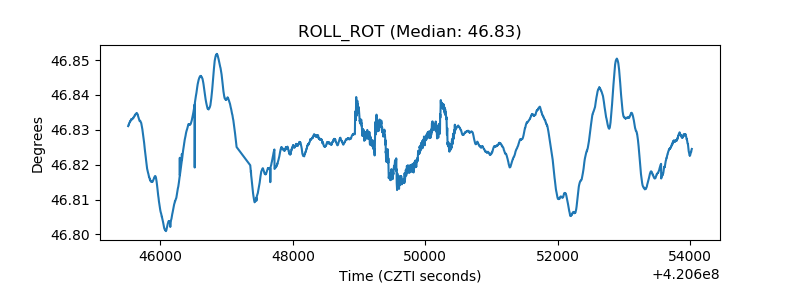 |
| _Roll_DEC | 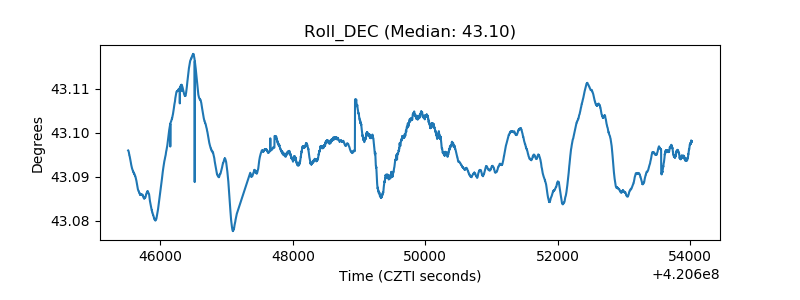 |
| _Roll_RA | 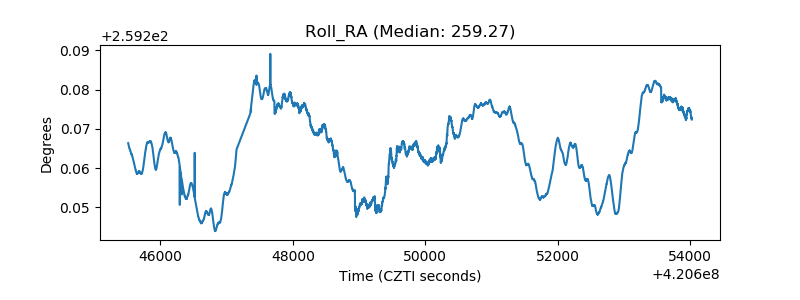 |
| Veto Counter | 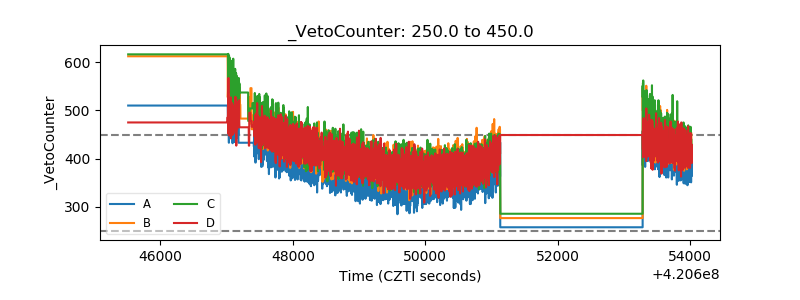 |